
記住我
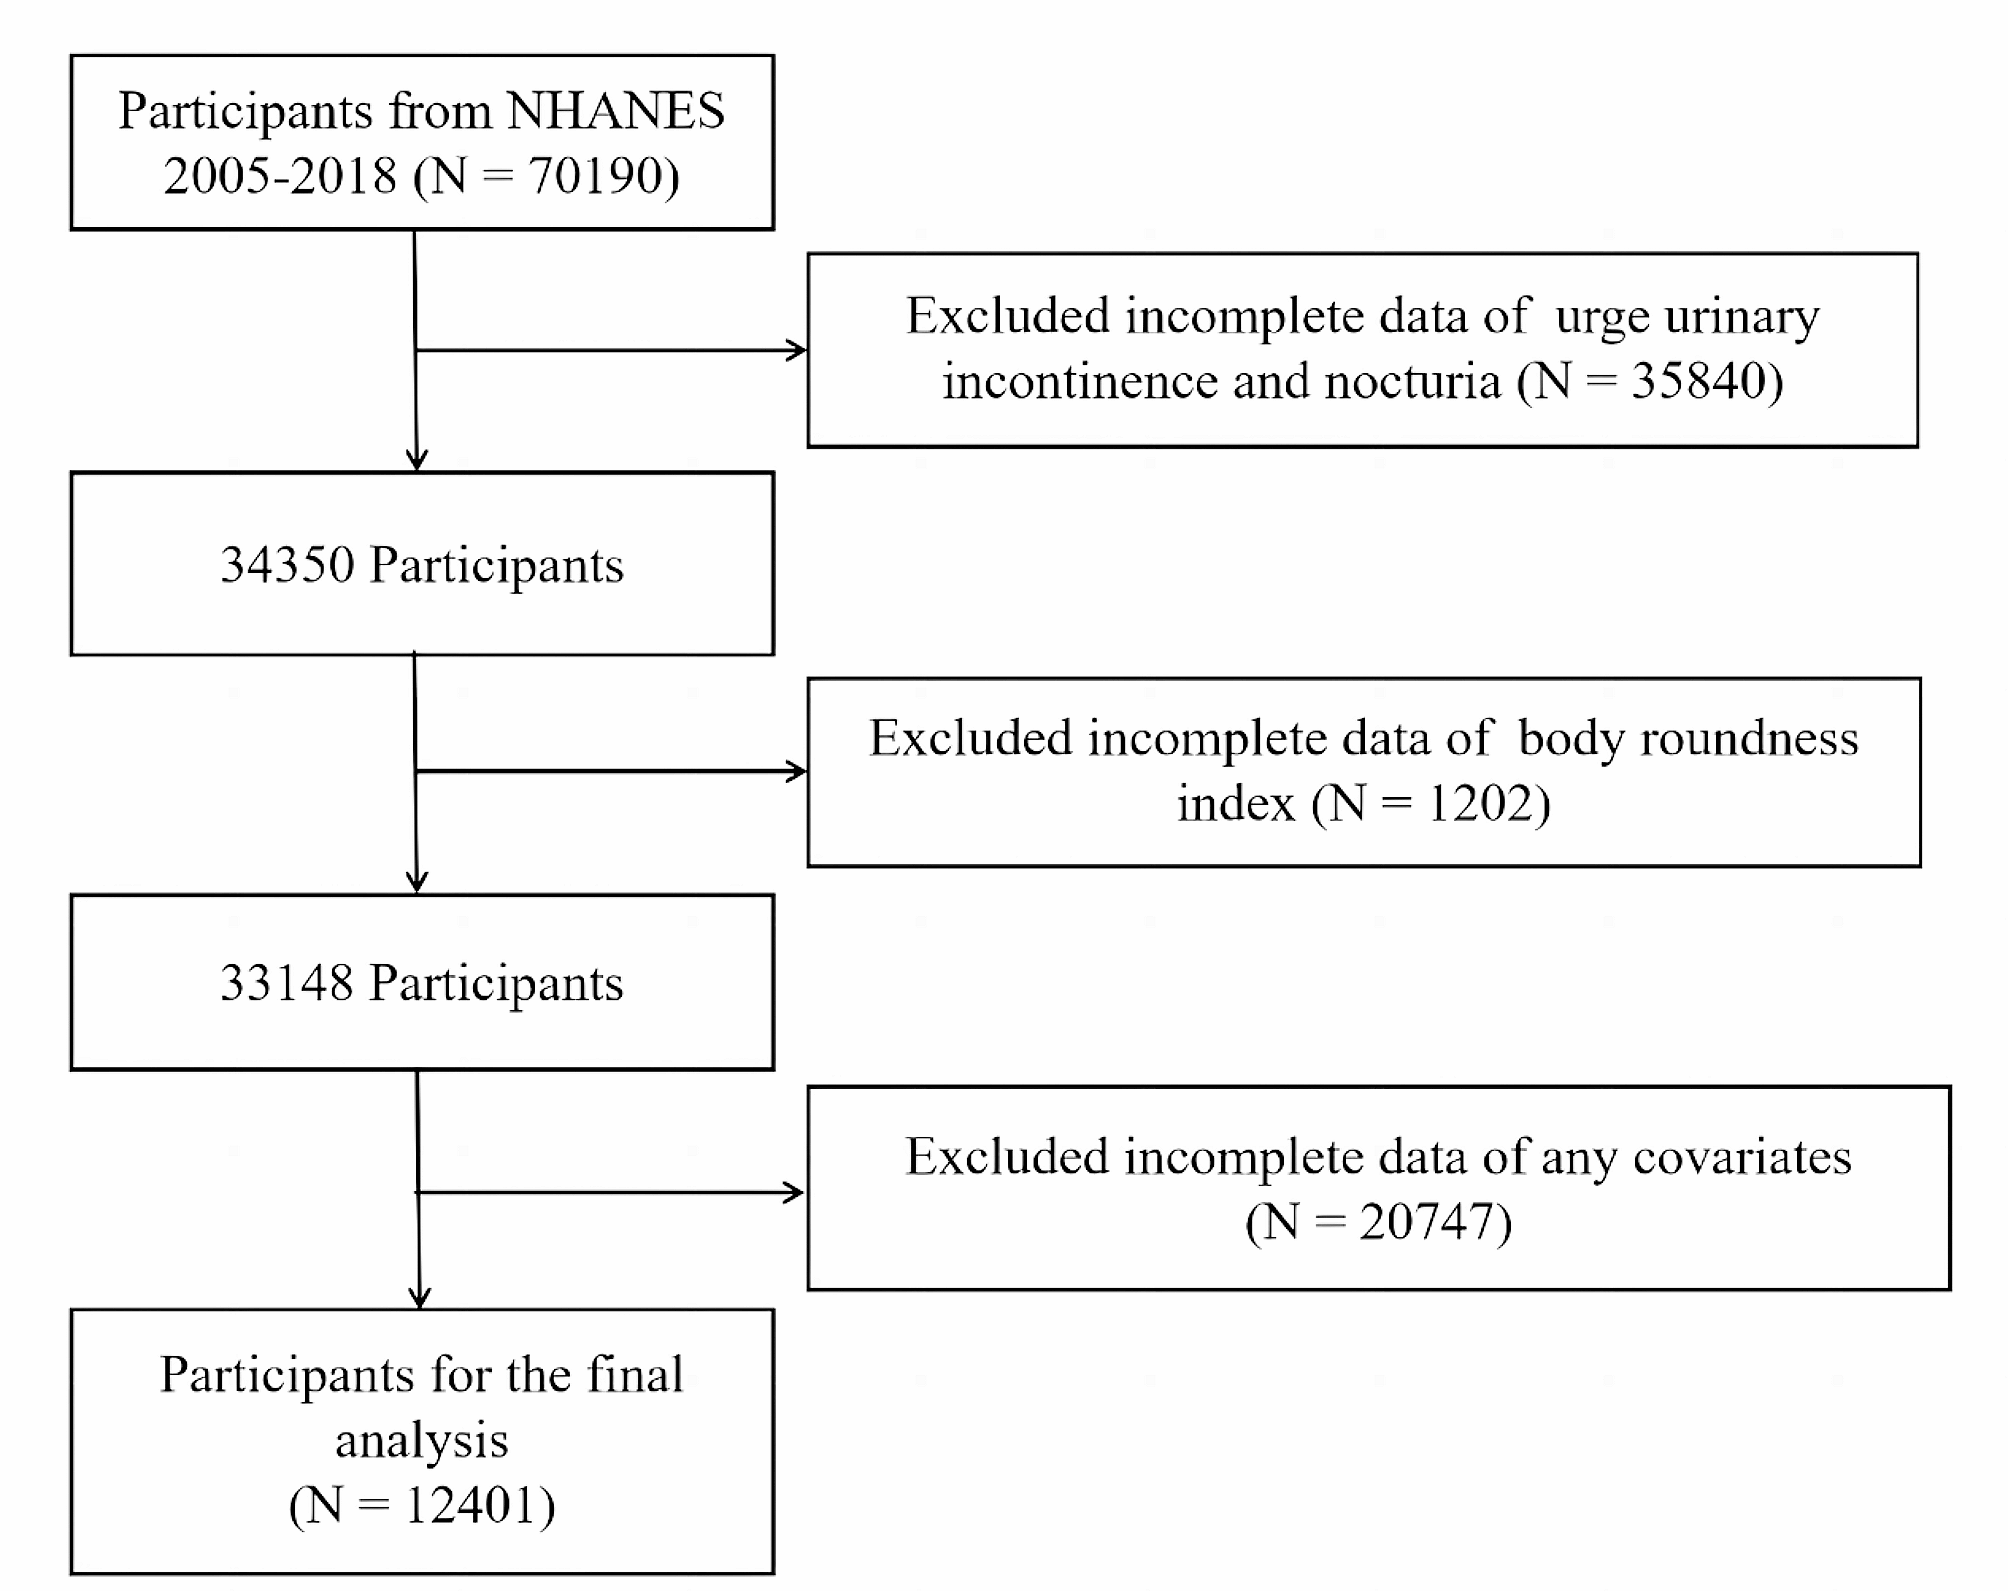
The NHANES is a national nutrition and health program that collects and publicly releases data biennially in the United States. In detail, the National Center for Health Statistics Ethics Review Committee provided ethical consent for the NHANES program. Each participant or their guardians signed informed consent forms for the NHANES programs. The latest three NHANES cycles were combined: 2013–2014, 2015–2016, and 2017–2018. Individuals aged 20 years or older were enrolled in this study. Initially, 29,400 individuals were enrolled in the NHANES 2013–2018. Then, 12,343 subjects were excluded because they were younger than 20 years, 8318 participants were excluded because of missing information on lumbar spine BMD, and 4924 participants were excluded because of missing RC information. Finally, 3815 individuals were enrolled in this study. The participant selection flowchart is displayed in Fig. 1.
Fig. 1
Flowchart of participants selection. BMD: bone mineral density. RC: remnant cholesterol
Assessment of RC and BMDRC was used as the exposure variable in this study. Peripheral blood was drawn from the subjects for analysis after they fasted for at least eight hours in the morning. Serum triglyceride and TC levels were analyzed using the enzymatic method. Serum High-density lipoprotein cholesterol (HDL-C) was assessed by heparin-manganese precipitation or a direct immunoassay technique method. Serum LDL-C was measured by the Friedwald calculation. Serum RC was determined using the formula [RC = TC- LDL-C - HDL-C], which was in accordance with previous research [19, 20].
The total spine BMD was assessed by dual-energy X-ray absorptiometry (DXA) using Hologic densitometers. Professionals collected and standardized BMD data. Total spine BMD was used as an outcome variable in this analysis. Detailed information on BMD can be found in the DXXLSBMD datasets on the NHANES website [21].
CovariatesCovariates were chosen based on the published study [22]. Variables such as race, age, sex, body mass index (BMI), blood urea nitrogen, total protein, serum calcium, serum vitamin D, serum phosphorus, serum uric acid, poverty income ratio (PIR), education level, smoking and drinking behaviors, high pressure, diabetes, physical activities, and statin use were considered in the study. The PIR is a widely used indicator of family income. BMI was determined by dividing weight (in kilograms) by the square of height (in metres). Races were divided into five groups (Other Hispanic, Non-Hispanic Black, Mexican American, Other Race, and Non-Hispanic White). Education level was categorized into three categories (College degree or above, High school graduate, and Under high school). Total protein, blood urea nitrogen, serum total calcium, serum phosphorus, serum uric acid, and serum vitamin D were collected via laboratory measurements. Smoking and drinking behaviors, high pressure, diabetes, physical activities, and statin use were determined by questionnaires: Smoke at least 100 cigarettes in life? Have you ever had 5 or more drinks every day? Doctor told you had high blood diabetes? Ever told you had high blood pressure? How many days did you do moderate recreational activities in a typical week? Have you taken statins in the past 30 days? Detailed data on covariates can be seen at the NHANES website.
Statistical analysisThe present study used the mean ± standard deviation and percentages to represent continuous and categorical variables, respectively. The characteristics of participants were described based on serum RC quartile (Q1: ≤ 0.308 mmol/L, Q2: 0.309–0.464 mmol/L, Q3:0.465–0.699 mmol/L, Q4: ≥ 0.700 mmol/L). To compare differences between the characteristics of participants, the study used weighted linear regression models and weighted χ2 tests for continuous variables and categorical variables, respectively. Furthermore, multivariate linear regression analyses were performed to explore the relationship of RC with total spine BMD. Model 1 was built as an unadjusted model. Then, Model 2 was created by adjusting age, race, and sex. Finally, Model 3 was created by adjusting all variables of race, age, sex, BMI, blood urea nitrogen, total protein, serum calcium, serum vitamin D, serum phosphorus, serum uric acid, PIR, education level, smoking and drinking behaviors, high pressure, diabetes, physical activities, and statin use. Then, the continuous variable serum RC was changed to a categorical variable (quartiles) to detect the correlation of RC with BMD. Stratified analyses and interaction tests were performed by sex (men and women), age (< 50 and ≥ 50), race (Other Hispanic, Non-Hispanic Black, Mexican American, Other Race, and Non-Hispanic White), and BMI (< 25, 25–30, > 30). To explore the effect of menopause on this relationship, further stratified analyses of menopausal women (premenopausal women and postmenopausal women) were conducted. Menopause was defined as the absence of menstruation in the past year because of hysterectomy or natural menopause/life change reasons [23]. The nonlinear association between RC and total spine BMD was detected by restricted cubic spline (RCS). All analyses were conducted by EmpowerStats (4.0) and R software (4.3.1) using MEC weight. A P value < 0.05 was deemed to indicate statistical significance.
留言 (0)