Participants
We recruited participants at the Affiliated Hospital of Guangdong Medical University in China using following inclusion and exclusion criteria. The diagnosis was fully supported by the Department of Psychiatry at the affiliated Hospital of Guangdong Medical University.
Inclusion Criteria: ①Participants should meet the diagnostic criteria of ICD-10 (International Classification of Diseases).②Participants should have clear consciousness and stable condition. ③Participants should be able to complete the questionnaire on their own. ④Participants should be willing to participate in this research and have signed an informed consent form.
Exclusion Criteria:① Participants with anxiety disorders caused by organic and somatic brain diseases.②Participants who were diagnosed by the use of psychoactive substances or have a history of using psychoactive substances. ③Participants who are delirious and in the acute phase of an anxiety disorder. Participants who have been diagnosed with any other mental illness.
After explaining the study procedure to eligible patients, we sign an informed consent form with them. The study protocol and informed consent form were approved by the Institutional Review Board (IRB) of the investigator’s institution of the investigator’s institution.
Measurement tools
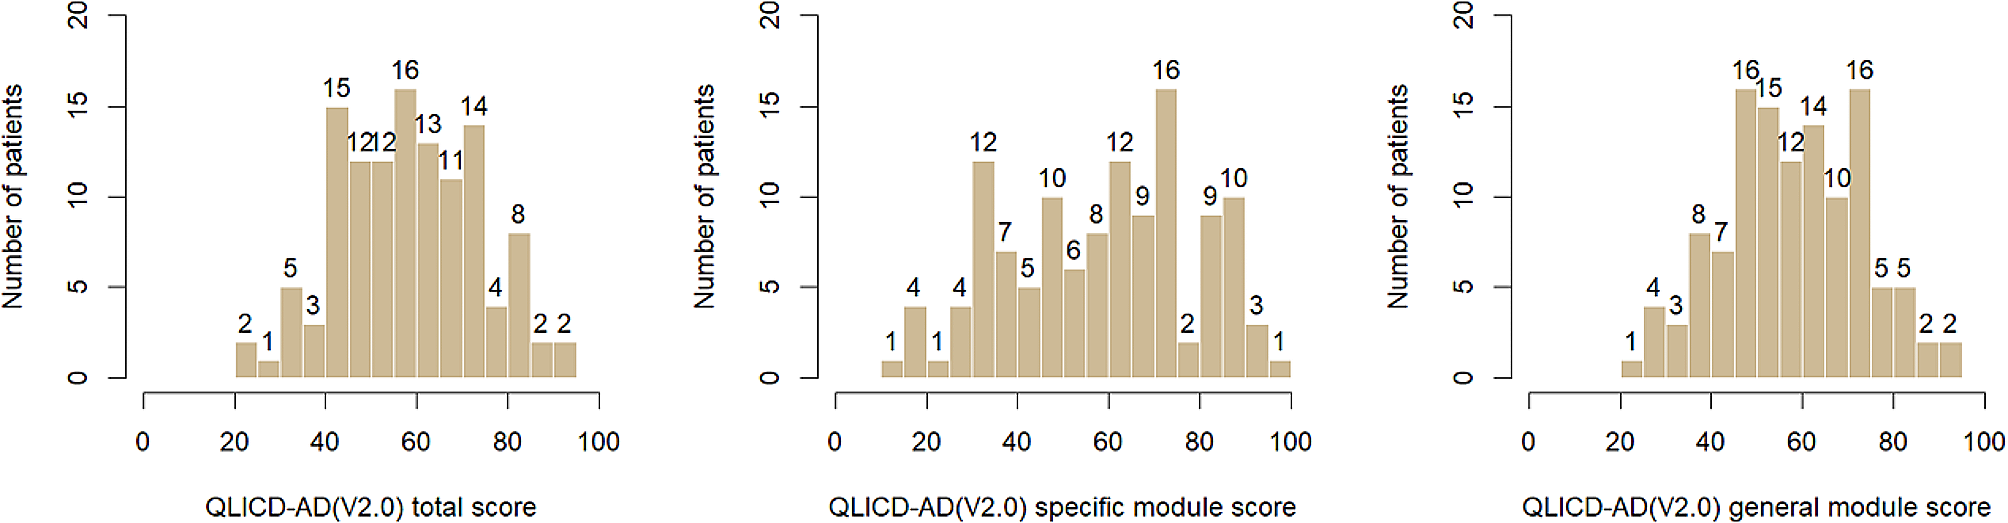
QLICD-AD(V2.0): The second edition of Quality of Life Instruments for Chronic Diseases-Anxiety Disorder (QLICD-AD, V2.0) are combined with general module and anxiety disorder module, 40 items in total [14, 19]. General module includes 3 domains which are physical function (GPH1-GPH9), social function (GSO1-GSO8) and psychological function (GPS1-GPS11), and 9 facets, 28 items in total. Anxiety disorder module includes 12 items. Each item is a five-level item (possible score range: 1 to 5, ranging from 1 no problem to 5 extreme problem). According to score principle, it can calculate the standard score of each domain, facet and the total. The standard score of it is from 0 to 100, the more score, the higher QOL. Details of the items were presented in Table 1.
Table 1 Items of the QLICD-AD (V2.0)Statistical analysis
After collecting the data from the completed scale, the demographic profile was first described after data organization. Then the statistical indicators in the CTT were calculated separately as well as derived using the graded response model (GRM) to calculate the average amount of information, coefficient of difficulty, and discrimination in the IRT. All the above analyses were performed in R studio.
Classical test theory(CTT)
CTT is founded on the proposition that measurement error, a random latent variable, is component of the observed score random variable [19, 20]. It is a traditional quantitative approach to testing the reliability and validity of a scale based on its items [21].
The CTT was analyzed for reliability and validity, and the scale items were evaluated in this study using four statistical methods: the Cronbach’s coefficient method, the variability method, the correlation coefficient method, and the factor analysis method. The items that satisfy at least three of these statistical methods can be comprehensively evaluated as good items. The calculation of CTT in R studio we use ltm package to calculate Cronbach’s coefficient, bruceR package for exploratory factor analysis, degree of variability, correlation coefficients are done using the appropriate formulas.
(1)Cronbach’s coefficient method: to analyze the items from the perspective of internal consistency, calculate the Cronbach’s coefficient α1 for each domain, and then compare it with the α2 coefficient of the domain after deleting this item, if α1 ≥ α2, evaluating it as a good item. If the subscale Cronbach’s α coefficient is above 0.7, it means that the scale has good reliability, between 0.6 and 0.7 means that the scale is acceptable, and if the α reliability coefficient is lower than 0.6, then consider modifying the scale.
(2) Degree of variability method: to analyze the items from a sensitivity perspective, calculate the standard deviation of each item, and evaluate those with a large degree of dispersion (> 0.90) as good items.
(3)Correlation coefficient method: In order to evaluate the independence or representativeness of the analyzed items, the correlation coefficients of the individual items with the scale scores were calculated. If the correlation coefficients of the items in the scale with the scores of the domains to which they belonged and with the total scale were > 0.5, it means that the correlation of the items with the domains to which they belonged and with the total scale was high, and this item could be rated as a good item.
(4) Exploratory factor analysis: In order to evaluate the representativeness of the analyzed items, according to the principle eigenvalue > 1, principal component analysis is used, and after orthogonal rotation with maximum variance, the factor loadings of each item are calculated. An item with a factor loading > 0.5 is considered a good item, and if the factor loading of an item in the scale is < 0.5, it means that the item does not have much influence on the latent variable to be measured. By exploratory factor analysis (EFA) of the minimum residual decomposition to test the unidimensionality of the scale. It is generally accepted that the unidimensionality assumption is largely met when the first factor explains more than 20–40% of the variance and the ratio of the first to second eigenvalue is greater than three [22].
Item response theory(IRT)
Unlike the CTT, the IRT directly simulates the response of an item to its corresponding underlying trait, overcoming the shortcoming that CTT parameter estimation should depend on samples. Compared to the CTT, it can accurately estimate the measurement error of each item and each participant [18].
QLICD-AD (V2.0) is divided into four domains: physical functioning domain, psychological functioning domain, social functioning domain, and the specific module, and each item is scored using a five-point Likert scale, which is in line with the characteristics of the ordered multiclassification, and in this study, we can use the GRM rank-response model of the hierarchical multiclassification in the IRT [23]. The formula of the rating response model [24] as below:
$$ P\left(_=k|\theta =t\right)=\frac\text\text[-1.7_\left(t-_\right)]}-\frac\text\text[-1.7_\left(t-_\right)]}$$
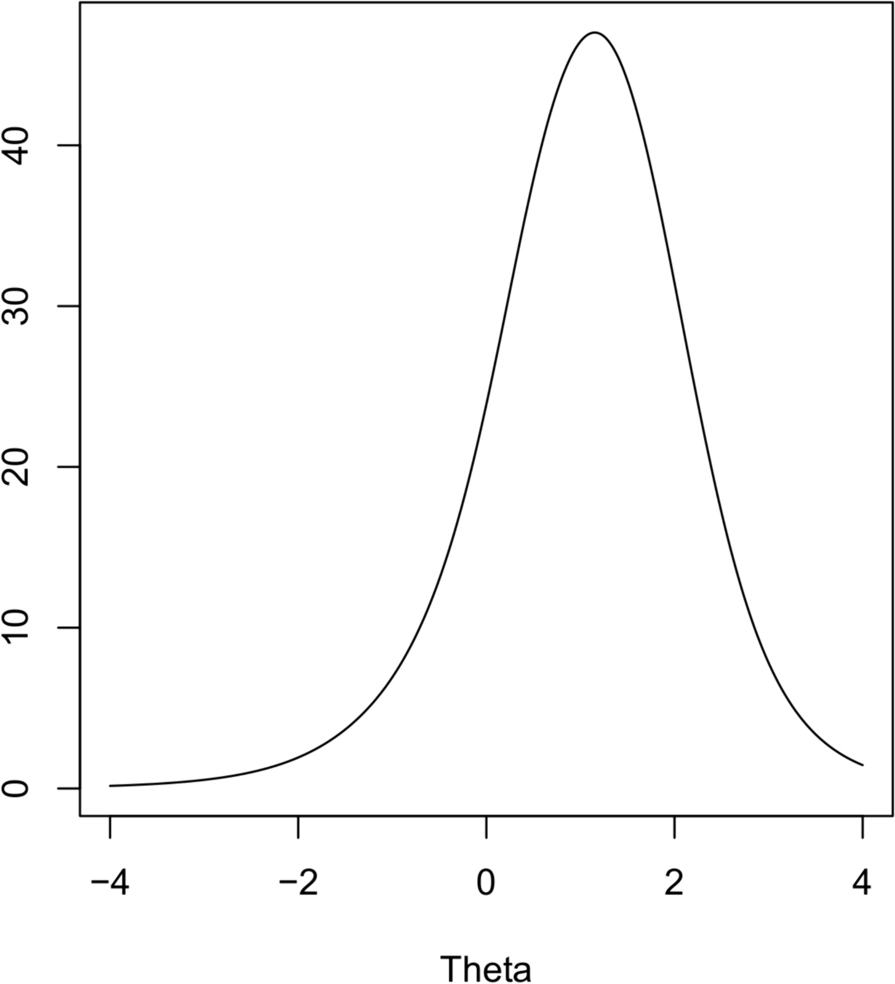
The hierarchical response model treats each item as a series of dichotomies (one minus the number of categories) and estimates each dichotomous 2-parameter model for each dichotom, corresponding to the lowest and highest categories, \( P\left(_=k|\theta \right)=0 \)and 1. \( v\) responses to multilevel scoring items ?, \( k\) indicates a response option, \( \theta \)(theta) is the latent variable measured by the item, a is the discriminant parameter, and b is the threshold parameter.
The amount of information, the average amount of information, the difficulty coefficient, and the degree of differentiation at different positions of each item were calculated to analyze the micro-evaluation of the items on the scale. We also estimated the TIF and the associated standard error of measurement (SE), which indicates the precision of the entire scale [25], to determine the level at which the QLICD-AD (V2.0) provided the most information. The parameters were estimated using the Marginal Maximum Likelihood Estimation (MMLE) method and the Expectation Maximization Algorithm (EM) [26].The computation and plotting of the IRT was done in R Studio in the mirt package, purrr package.
(1) The information amount of the items: reflects the amount of information that each item can provide in estimating the respondent’s ability, the larger the information amount, the smaller the standard error of measurement. In this paper, five points with values of -2, -1, 0, 1, and 2 are selected, and the values of the information function parameter \( \theta \)and its average value at these five points are calculated. Scale measurement information amount > 25 indicates that the quality of the measurement is good, information amount 16–25 indicates that the measurement is acceptable and information amount < 16 indicates that the measurement are poor [14, 19]. The QLICD-AD (V2.0) scale has a total of 40 items, and the average information amount of each item can be obtained by dividing 16 and 25 by 40, so that items with an average information amount > 0.63 (25/40) are judged to be excellent; <0.40 (16/40) are judged to be poor. However, we believe that this criterion is too strict. In this study, the total information amount of the scale was considered to be 5 based on a reliability equal to 0.8, and the average information amount of each item was 0.125 (5/40). Accordingly, when the mean information amount of an item was greater than 0.125, the item was evaluated as “good” and those less than 0.125 (5/40) were evaluated as “poor”.
(2) Difficulty coefficient b: the scale adopts a five-point equidistant scoring method, and each item has four difficulty coefficients, which are b1, b2, b3 and b4, with the increase of difficulty level (b1→b4), the difficulty coefficients corresponding to each item should show a monotonically increasing trend, and the items with the range of [-4, 4] are good; Degree of differentiation a: The greater the degree of differentiation, the greater the amount of information of the cued items, and the items with a degree of differentiation > 0. 5 are considered good.
(3) Item Characteristic Curve(ICC): It is used to describe the functional relationship between a subject’s latent traits and the probability of response. The Item Information Curve (IIC) describes the fact that a larger area under the curve indicates a higher degree of measurement accuracy. Test Information Function (TIF) reflects the precision of the test at various levels for the trait being measured. In general, the quality of the scale was considered high when the total information was 25 or more, and the quality of the scale was considered acceptable when the total information was between 16 and 25 [27, 28]. In addition, a list of conversions between raw total scores and IRT trait scores was calculated using the Expected A Posteriori (EAP) method of Bayesian estimation [20]. The IRT scores were calculated by integrating the parameter estimates (a, b, c) for each item, which means that the corresponding IRT scores are an interval of the same total score.

留言 (0)