Participants
Participants were recruited between February 2022 and September 2023 using the following recruitment strategy: patients were recruited in six psychiatric hospitals in the French-speaking part of Switzerland, and through an online survey. The set of questions and scales was in both instances identical. Both hospital and online participants should be at least 18 years old and no older than 65 to be included in the study. People diagnosed with dementia (F00-F09) or Intellectual disability (F70-F79) were excluded. Moreover, participants from the online survey were informed that they could take part in the study only if they were or had been under psychiatric care, had a psychiatric diagnosis and were sufficiently proficient in French. A correct answer to two control items (i.e., “In order to check your concentration, please answer "rather yes" to this question”) and to have completed sociodemographic and diagnostic data were also required in order for online participants to be included in the analysis. In hospitals, participants were contacted by a research assistant (trained master degree psychology student) in the presence of their attending nurse who provided them information on the study. After a period of consideration, people who agreed to participate signed the consent form and were interviewed individually. The online survey was advertised on various social media platforms and was relayed by patients’ associations.
A total of 274 patients were recruited and included in the study, of which151 (55.1%) were women. Their age ranged from 18 to 64 years old (M = 37.86, SD = 12.70). Primary diagnosis, based on the International Statistical Classification of Diseases and Related Health Problems 10th Revision (ICD-10), were the following: Mental and behavioural disorders due to alcohol use (F10) N = 8 (2.9%), Mental and behavioural disorders due to psychoactive substance use (F11–F19) N = 11 (4.0%), Schizophrenia (F20–F29) N = 63 (23.0%), Mood affective disorders—mania (F30–F31) N = 29 (10.6%), Mood affective disorders – depression (F32–F39) N = 85 (31.0%), Neurotic, stress-related and somatoform disorders (F40–F48) N = 17 (6.2%), Personality disorders (F60–F69) N = 40 (14.6%), Psychological development disorders (F80–F89) N = 5 (1.8%) and No diagnostic information available (first psychiatric hospitalisation) N = 16 (5.8%).
Measures
Patients were asked to report their gender, age, and most significant CIM-10 diagnosis. In some instances, patients were assessed during their first psychiatric hospitalisation and no diagnostic information was yet available.
Development of the pressures in psychiatry scale (P-PSY35)
Being interested in measuring the total amount of pressure experienced by patients, we aimed at designing a unidimensional scale including various forms and levels of severity of pressures, the Pressure in Psychiatry scale (P-PSY35). The items of our pressure questionnaire were generated based on a literature review and through several consultations with a peer specialist and an expert panel [24]. The objective was to generate many items in order to select the best subset for the final scale. Because we were interested in the possibility of measuring change between different measurement occasions, we instructed patients to answer based on the last 3 months period. If needed, this instruction can be easily modified to assess the lifetime experience of treatment pressures in psychiatry.
A research assistant with lived experience of mental illness and recovery embedded within the research team and two psychologists trained in psychometrics and questionnaire development conducted the literature review. About 10 domains in all aspects of life (e.g., health, therapeutic means, belief, finance, work, education, social activities, addiction) related to pressures (stay well pressures, monitoring, persuasion, interpersonal pressure, leverage, threats, deception, decision of one another, show of force, use of violence) were identified. These domains served as a guide to generate items. The peer specialist was involved in reviewing the items suggested by psychologists and proposing new ones. In total, about 200 items were identified. After removing potential duplicates and ill-formulated items, this set was reduced to roughly 115 items. The items were further reviewed and selected using an expert panel session to improve content validity. The panel included three mental health professionals with a track record of research on coercion. All items were reviewed one by one, and changes were discussed on a consensus basis: The first step was to ask panel experts to read all items. The second step involved discarding, rephrasing, or suggesting new items. Items were modified one at a time directly on the screen during the open discussion until validation by all the participants [24]. The final questionnaire contained 98 items answered on a 5-point Likert scale: 0 = “Not at all”, 1 = “Not much”, 2 = “Neutral”, 3 = “A little bit”, and 4 = “Definitively”.
Coercion ladder
The Coercion Ladder [25] was originally adapted from the Cantril Ladder [26]. It is a visual analogue tool on which the patient is asked to mark the degree of perceived coercion on a scale from 1 (Minimum use of coercion) to 10 (Maximum use of coercion). Participants were instructed to answer in relation to their entire experience of psychiatric care.
Coercion experience scale (CES)
The CES [27] is a scale designed to measure patients’ experiences of coercive measures. The scale was first developed in German before being translated and published in English [27] and then validated in French [28]. In this study, we only used the second item which has been designed to evaluate the extent to which patients consider coercive measures stressful on a visual analogue scale from 0 to 100.
Informal coercion dichotomous items
Pressures to adhere to treatment (‘leverage’) were assessed using a 4-item instrument proposed by Burns and colleagues [22], which was adapted from Monahan and colleagues [23]. It aims to measure patients’ lifespan experiences of leverage in four domains of the social welfare: finance, housing, criminal justice and child custody. These items represent rather severe forms of informal coercion. They correspond to inducements and threats as defined by Szmukler & Appelbaum’s [1].
Satisfaction regarding hospitalisation (ANQ)
The Swiss National Association for Quality Development in Hospitals and Clinics (ANQ) developed a satisfaction measure for patients in psychiatry. The questionnaire includes 6 five-point Likert-type items assessing quality of treatment, information and communication, medication, patient’s implication and discharge preparation [29]. We used the first item (that focused on the perceived quality of psychiatric care) and the total score (that can be computed to assess the global satisfaction of the patient).
The self-stigma scale—short (SSS-S)
The SSS-S is a 9-item questionnaire designed to measure the degree of self-stigma of individuals from various minority groups. It consists of a cognition score, an affect score, a behaviour score, and a total score. In the present study, we used the French-version of the SSS-S [30].
The rosenberg self-esteem scale (RSS)
The RSS is the most frequently used instrument to measure self-esteem [31]. It consists of 10 items with a total score ranging from a minimum of 10 to a maximum of 40. Participants respond on a Likert scale by checking one of the four options: “strongly disagree”, “disagree”, “agree”, and “strongly agree”.
The beck hopelessness scale (BHS)
The BHS is a widely used questionnaire that measures negative expectations about the future [32]. The inventory is a self-report measure and consists of 20 items scored on a true–false scale. A total score can be computed and ranges from 0 to 20, with higher scores reflecting higher levels of hopelessness. In the present study, we used the French-version of the BHS [33].
Self-reported health
One item of the ANQ questionnaire is a self-reported five-point Likert-type item about the patient self-perceived global health [29]. Patients can rate their perceived actual health between “bad” and “excellent”.
Procedure
The internal validity of the P-PSY35 was assessed first. This phase aimed to select the final set of items on the basis of the internal structure of the test. The reliability of the scale and the model goodness of fit were then estimated. Next, to evaluate convergent and divergent validity, we studied the relationship between the P-PSY35 score and several other scales. We hypothesised that the P-PSY35 scores would be positively correlated with the Coercion ladder, the CES 0–100 item, the Informal coercion dichotomous items, the SSS-S and the BHS scores. We also hypothesized a negative correlation with the ANQ and the RSS scores. To evaluate the divergent validity, we hypothesized we would find no significant correlation between the P-PSY35 and the Self-reported Health measure.
Finally, a Monte-Carlo simulation was performed to evaluate the number of items needed to transform the paper-and-pencil test into a psychometric CAT with a high reliability (r ≥ 0.90).
Statistical analysisInternal validity
Given the large number of items at the beginning of the procedure, these were first screened using Mokken scale analysis. This is a non-parametric method based on the monotonicity of the item response function. Items with low scalability (Ho < 0.30) were discarded. The “mokken” R-package was used [34]. Next, remaining items were selected on the basis of an item fit statistic. We discarded items with significant signed chi-squared test [35, 36]. The Multidimensional Item Response Theory (mirt) package for R was used [37]. Finally, items pairs were screened for local dependency using Yen's Q3, with values under 0.3 suppressed [38, 39]. From the locally dependent pairs, we deleted items which had less information based on their information curves. A final item fit statistic test was performed at the end of the item selection procedure to ensure all final items did not contribute negatively to the overall fit of the scale. Model fit and items parameters were then estimated using the mirt package for R and a graded response model. Several indicators of model fit were used: the Root Mean Square Error of Approximation (RMSEA), the Tucker–Lewis fit Index (TLI), the Comparison Fit Index (CFI) and the Standardized Root Mean Squared Residual (SRMSR). RMSEA values ≤ 0.06, CFI and TLI values ≥ 0.95, and SRMRS ≤ 0.08 were interpreted as good fits, whereas RMSEA values ≤ 0.08, CFI and TLI values ≥ 0.90 and SRMRS ≤ 0.10 were considered as indicating acceptable fit [40].
Reliability
The reliability of the P-PSY35 scale was estimated using McDonald’s model-based Omega (ω) [41] and Cronbach’s alpha (α) coefficients. We also estimated the Marginal reliability (Rxx) [42]. Reliability coefficients above 0.80 were considered good and above 0.90 were considered excellent [41, 43]. The “psych” and “mirt” R-package were used [37, 44].
Convergent validity
The convergent validity coefficients between the P-PSY35 and the other scales were estimated using Pearson correlation coefficients and Spearman’s Rho coefficient when the indicator was dichotomous. Under Classical Test Theory (CTT) the score reliabilities (more precisely their square root) act as an upper bound for validity coefficients. Therefore, the acceptable range is typically lower than for reliability coefficients [45]. Correlation coefficients between 0.40 and 0.60 were considered as good and any values higher than 0.30 (a medium effect size, according to Cohen [46]) as satisfactory.
CAT Simulations
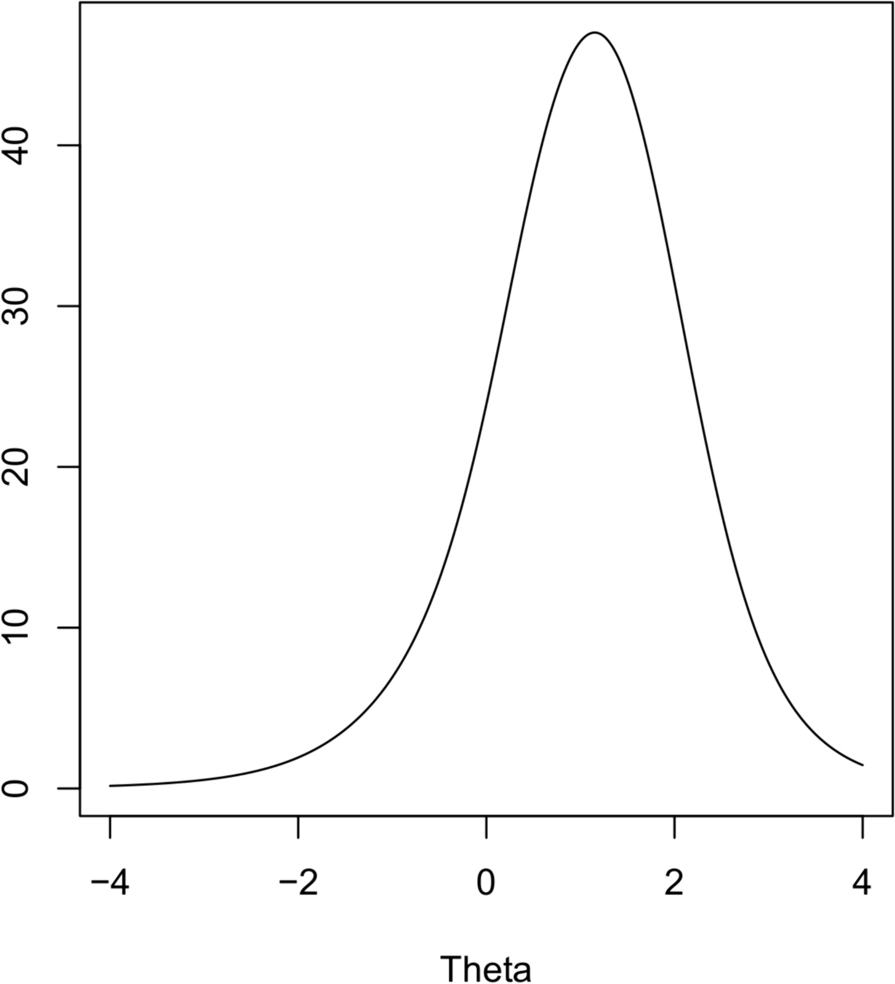
We used the Firestar software designed to simulate CAT with polytomous items [47]. A large number of participants (10,000) were simulated to achieve accurate estimates under reasonable computing time. The simulated thetas were sampled from a normal distribution with a mean of 0 and a standard deviation of 1 which correspond to the level and dispersion of the original sample. Minimum and maximum thetas ranged between − 4 and 4 with increments of 0.05. The maximum number of items to administer was set to 35 and the minimum was 2. The stopping rule was set to a standard error corresponding to a reliability of 0.90. Interim theta estimations were carried out using expected a posteriori (EAP) estimations. The next items were selected using the Fisher maximum information method. During the Firestar simulation, we recorded the minimum, maximum, mean and median numbers of items administered before the stopping criterion. Pearson correlations were estimated between simulated and estimated thetas, and the mean reliability was based on the final standard errors.

留言 (0)