
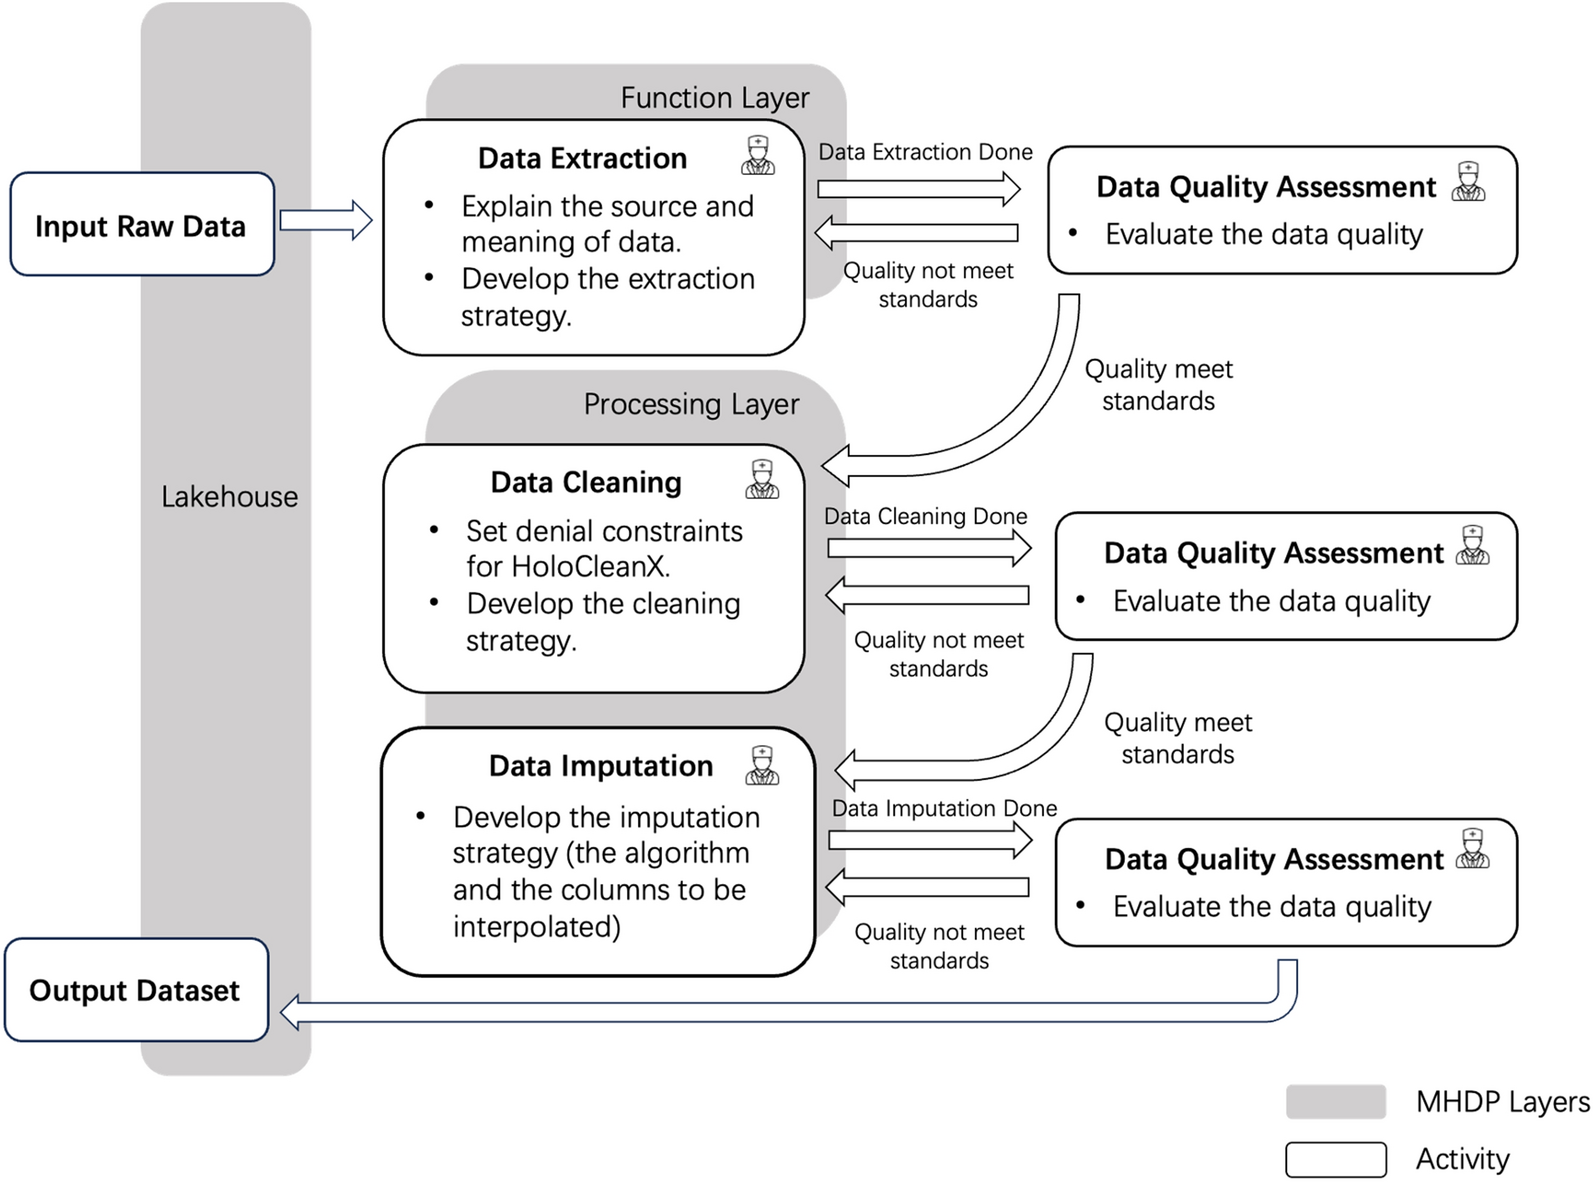
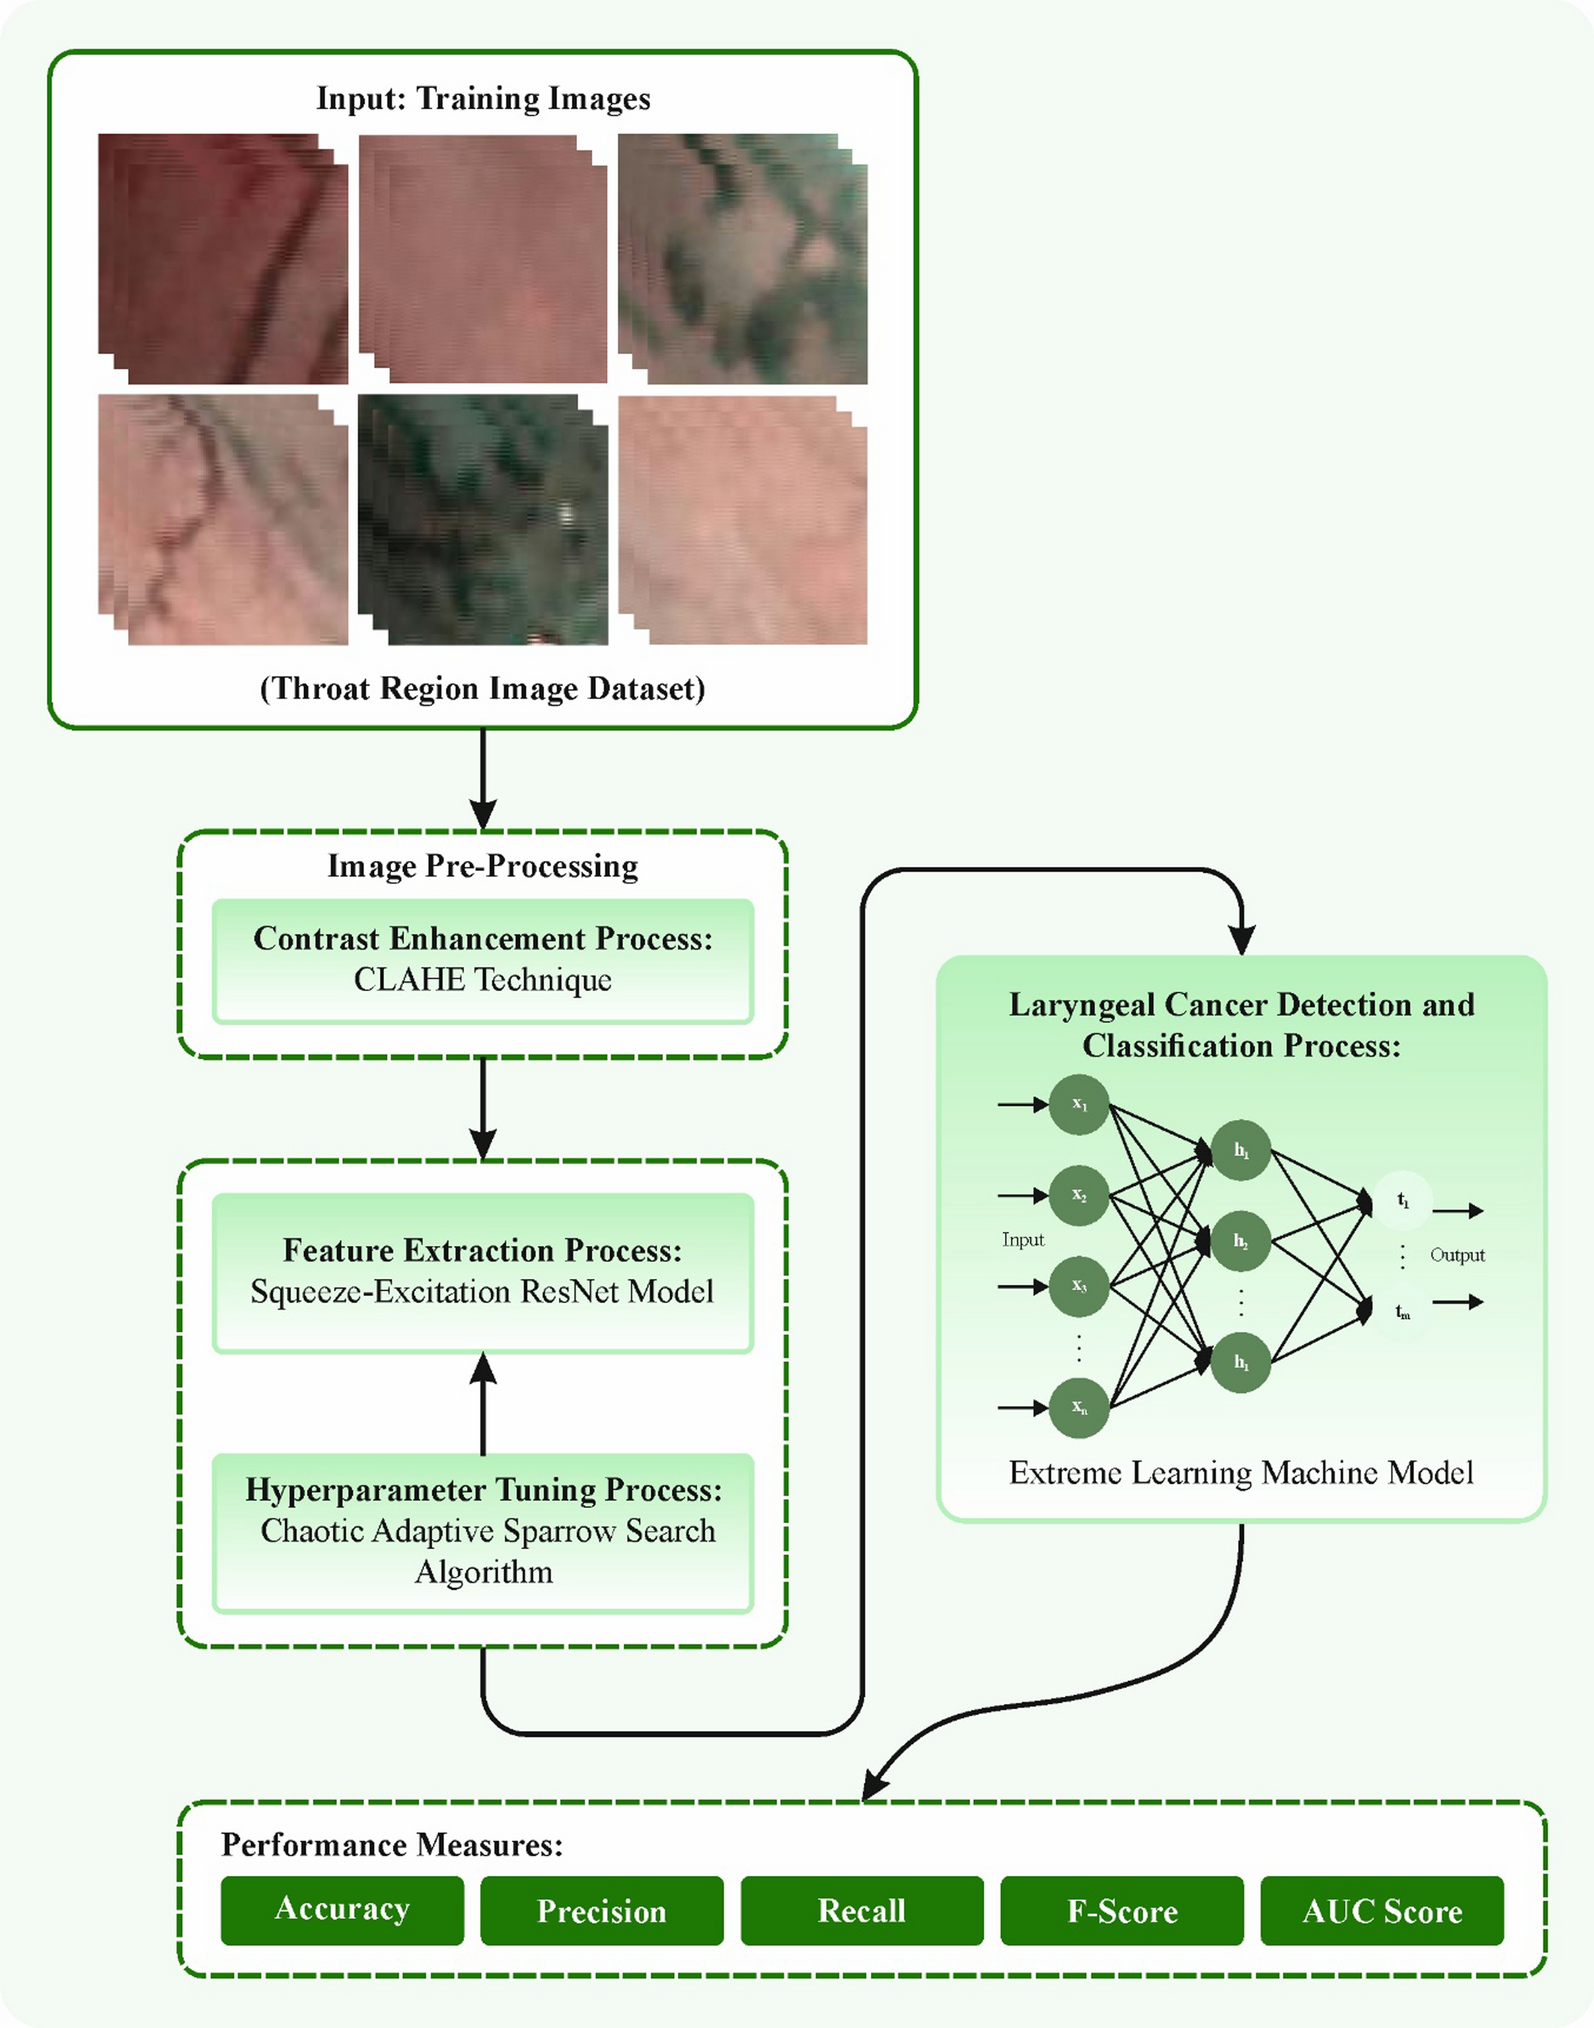
記住我


Numerous experimental investigations were conducted to meticulously analyze the classification accuracy of our SC-MP-Mixer model. This section presents these experimental studies. Within this section’s progression, initial focus is placed on elaborating the parameter settings. Subsequently, the classification performance outcomes obtained from experiments conducted on three datasets utilizing our SC-MP-Mixer model are delineated. Lastly, comparisons were drawn with analogous studies found in the existing literature.
Parameter settingsThe experimental studies utilized BCCD, PBC and Raabin datasets. The BCCD dataset was originally allocated for 9957 samples in training and 2487 samples in testing. To ensure a fair comparison, we used the training and test examples in the dataset as is. Additionally, 15% of the training samples were set aside for validation purposes. In contrast, for the PBC and Raabin datasets, the training and test samples were not separated in the original dataset, so we partitioned them into specific proportions. The PBC and Raabin dataset was divided into 70% training, 15% validation, and 15% testing.
The experimental studies were conducted on a computer equipped with an Intel i9 processor, 64 GB RAM, and an RTX 3080 Ti graphics card. The design of the deep learning model utilized the Python programming language and the Keras-TensorFlow library. In the training of deep learning models, a learning rate of 0.0001, a batch size of 16, and 100 epochs were employed. Additionally, the Adam method was used for parameter optimization.
In the first stage of the proposed SC-MP-Mixer module, 3 different ConvMixers (CM1, CM2, and CM3) were used in parallel with the input image. The p (patch size) values were 2, 4, and 8 for CM1, CM2, and CM3, respectively. In addition, the number of filters and depth size used in all ConvMixer models were 128 and 4, respectively. Additionally, the s values used in the upsampling layers were set to 2 and 4 (see “Proposed method” or “Stage 1: Multipath ConvMixer (MPCM)” Sects.). On the other hand, two Swin Transformers were used in the second part of the proposed model. The p values here are set to 2 and 4, respectively, for the patching process of each Swin Transformer (see “Proposed method” or “Stage 2: multipath Swin transformer (multipath SwTrans-MPST)” Sects.). Finally, the c values in the classification process were set as 4 for the BCCD dataset, 8 for the PBC dataset, and 5 for the Raabin dataset.
The evaluation of the SC-MP-Mixer model’s efficiency was performed using criteria such as classification accuracy (Acc), recall (Re), F1-score (F1s) and precision (Pr). These evaluation criteria provide an objective and quantitative measure of the model’s prediction effectiveness, essential for performance assessment and identifying areas for improvement. The formulas of these metrics is given in Eqs. (9–12).
The Eqs. (9–12) derive the true positives (TP), false positives (FP), false negatives (FN) and true negatives (TN) values from the confusion matrix. They represent: FP as the number of WBC inaccurately identified as non-target WBC types, FN as the total of incorrectly identified WBC types, TN as the tally of WBC correctly recognized as non-target WBC types and TP as the count of correctly identified WBC types.
Experimental resultsIn this section, the results of the applications on the BCCD, PBC and Raabin datasets are included. These three datasets were compared with ResNet (ResNet50, ResNet101) [46], EfficientNet [47], ConvMixer [22], Swin Transformer [14], MobileNet [48] and VGG16 [49] from the literature. The reasons for selecting these methods for comparison are as follows. The proposed model uses parallel ConvMixer and Swin Transformer models. In order to observe the effect of using only ConvMixer and Swin Transformer, the proposed model is first compared with these two models. Certain models, including EfficientNet, MobileNet, ResNet101, ResNet50, and VGG16, were chosen for comparison in the experiments due to their widespread adoption and established performance in the computer vision field. Each of these models represents a different architectural paradigm offering varying balances between model complexity, computational efficiency, and accuracy. The VGG16 is a classical deep convolutional neural network architecture characterized by its simplicity and uniform architecture. It is widely used as a baseline for many computer vision tasks due to its effectiveness and ease of implementation. The ResNet50 and ResNet101 architectures pioneered the use of skip connections and achieved superior performance by developing very deep network structures. Finally, the MobileNet and EfficientNet architectures are efficient network architectures with low parameters that utilize both skip connections and depthwise separable convolution layers. Additionally, the EfficientNet architecture offers a powerful network structure by performing layer optimization. These network architectures are actively used in many studies today, either in their original or modified versions. In addition, they also include skip connections and depthwise separable convolution layers, as in our proposed model. Discussions of the results are provided below in subsections.
Classification results for BCCDThe BCCD consists of four classes: N, EO, L and M. Class-based results for BCCD are presented in Table 2. Table 2 shows that the best results are obtained for class L with 99.8% Acc, 99.60% F1s, 99.68% Pr and 99.52% Re. This shows that the model performs extremely well in identifying L class cells, achieving very high accuracy and other performance metrics. It also shows that the model is very good at both identifying true positives and avoiding false positives, with the model rarely making errors for class L. The proposed model performs well on class M with high Acc (98.47%) and F1s (96.84%). Notably, it has a perfect Pr (100%), meaning it never classified anything else as M if it wasn’t actually M. However, the Re (93.87%) is slightly lower, suggesting there might be some true positives from class M that the model missed. The proposed model exhibits good Acc (92.88%) for the EO class, however, improvements are needed in its F1s (85.53%), Re (83.95%), and Pr (87.17%). A slightly higher Pr compared to Re suggests that the model might be better at avoiding false positives (misclassifying other classes as EO), but it could potentially miss some true positives (actual EO data points). Class N has the lowest performance among the other classes. The Acc (91.48%) is still good, but the F1s (83.82%) is the lowest. The Pr (80.03%) is also lower than the Re (87.98%), indicating that the model may struggle to distinguish class N from other classes. Overall, the proposed model performs well on the BCCD dataset, especially on class L. However, improvements could be made in distinguishing classes EO and N from other classes, especially in Pr for class N and Re for class EO. In additon, Table 3 outlines the application results of different models using this dataset. Upon examination of Table 3, it is apparent that the proposed SC-MP-Mixer achieved the best classification result, boasting an macro Acc of 95.66%. Additional evaluation criteria for our SC-MP-Mixer method yielded the following results: 91.44% F1s, 91.72% Pr, and 91.33% Re. Comparatively, the results closest to the our SC-MP-Mixer model was acquired with EfficientNet, achieving 93.87% Acc and 88.05% F1s. Similarly, ResNet101 attained 93.65% Acc and 87.61% F1s. The ResNet50 reached Acc score of 93.14%, while the MobileNet achieved Acc score of 92.22%. The VGG16 obtained the lowest scores among pre-trained models. When comparing pre-trained models with the SC-MP-Mixer, it produced approximately 3–5% higher scores than the pre-trained models. These results demonstrate the superior effectiveness of the SC-MP-Mixer model over pre-trained models. On the other hand, the Swin Transformer and ConvMixer structures, representing the latest technological models, achieved Acc scores of 92.62 and 93.18%, respectively. Despite the Swin Transformer capturing strong long-context features with the latest transformer technology, it exhibited weaknesses against the proposed model. This is attributed to transformer models struggling to capture spatial details from input images and requiring a large number of images for training. In the SC-MP-Mixer architecture developed based on this, Swin Transformers were fed with features obtained from ConvMixer, allowing for numerous and effective features through a multi-path approach. Consequently, the proposed SC-MP-Mixer produced the highest results by leveraging the Swin Transformer and ConvMixer blocks together.
Table 2 Class-based results for BCCD (%)Table 3 Classification results of different models for BCCD (%)Classification results for PBC and RaabinThe PBC dataset comprises eight classes: N, EO, B, L, M, IG, P and ER. Class-based results for PBC are presented in Table 4. Analysing Table 4, we can see that the proposed method generally performs well in all classes, with some differences. Classes B, EO, L, ER and P achieved very high Acc (over 99.8%) and F1s (over 99%). They also have Pr and Re values close to 100%, indicating that the model excels in classifying these classes with minimal error. Classes M and N show good Acc (over 98.9%) but slightly lower F1s (around 97–99%). The Pr and Re values for these classes are still quite high, suggesting that the model performs well but may have some room for improvement in distinguishing these classes from others. Class IG has the lowest Acc (98.91%) and F1s (96.70%) of all classes. In addition, the Pr (96.93%) is slightly higher than the Re (96.48%), indicating that the model may be better at avoiding false positives for this class, but may miss some true positives. Overall, the model performs well on the PBC dataset, particularly in the B, EO, L, ER and P classes. Some improvement is needed in the IG class, particularly in Re, and potentially in the M and N classes. The application results using this dataset are summarized in Table 5. According to the Table 5, the most notable classification outcomes were obtained with our proposed SC-MP-Mixer. The SC-MP-Mixer demonstrated impressive performance, achieving 99.65% Acc, 98.71% F1s, 98.67% Pr, and 98.76% Re values. In comparison, the methods that closely approached the performance of the proposed SC-MP-Mixer on this dataset were ResNet50 and VGG16. ResNet50 achieved a 99.53% Acc score, while VGG16 obtained a 99.59% Acc score. Additionally, the EfficientNet, MobileNet, and ResNet101 models provided Acc scores of 99.51, 99.04, and 99.35%, respectively. On the other hand, ConvMixer (98.51%) and SwinTransformer (97.9%) yielded the lowest Acc scores. However, the SC-MP-Mixer, utilizing both ConvMixer and SwinTransformer in tandem and supported by a multi-path (parallel) application and a different patch size approach, outperformed ConvMixer and SwinTransformer by 1.14 and 1.75%, respectively.
Table 4 Class-based results for PBC (%)Table 5 Classification results of different models for PBC (%)The Raabin dataset comprises five classes: N, EO, B, L and M. Class-based results for Raabin are presented in Table 6. When analysing Table 6, the performance of the model varies according to the classes in this dataset. Class N achieves the highest F1s (98.55%) with very close Pr (98.40%) and Re (98.70%). This suggests that the model is good at identifying and correctly classifying class N with minimal error. Compared to class N, classes B and EO have good accuracy (over 99%) but lower F1 values (around 94–98%). While the precision for class B is excellent (100%), the recall is lower (96.30%), indicating that the model may miss some true positives (B) but is successful in avoiding false positives. Similarly, Pr and Re are lower in the EO class. Class L has the lowest Acc value, while class M has the lowest Pr, Re and F1s values. This indicates that the model has difficulty distinguishing class M from the others and may make more errors in its classifications. Overall, the model seems to give a balanced result of class N in all evaluation metrics in the Raabin dataset. Although the highest Acc value was obtained in class B, it gave lower results than class N, especially in F1s and Re. It is clear that the model needs improvement, especially for class M. In addition, The experimental results using this dataset are summarized in Table 7. According to the Table 7, the most notable classification outcomes were obtained with our proposed SC-MP-Mixer. The SC-MP-Mixer demonstrated impressive performance, achieving 98.68% Acc, 94.42% F1s, 94.34% Pr, and 94.63% Re values. The closest result to the proposed SC-MP-Mixer was achieved in MobileNet with 97.71% Acc, 93.86% F1s, 93.79% Pr, and a 93.96% Re. When compared to MobileNet, the proposed SC-MP-Mixer seems to yield superior results by 0.97% in Acc, 0.56% in F1s, 0.55% in Pr, and 0.67% in Re. Furthermore, when pitted against ConvMixer, the suggested SC-MP-Mixer attains notably improved outcomes with an increase of 21.33% in Acc, 37.95% in F1s, 27.56% in Pr, and 38.14% in Re. Likewise, in comparison to the SwTrans, the SC-MP-Mixer achieves superior results with a marginal uptick of 2.13% in Acc, 0.8% in F1s, 0.82% in Pr, and 0.91% in Re. Against other methodologies, the SC-MP-Mixer surpasses EfficientNet by 31.25% in Acc, 44.34% in F1s, 45.06% in Pr, and 37.68% in Re. Correspondingly, it outperforms ResNet101 with a slight increase of 2.12% in Acc, 2.34% in F1s, 3.71% in Pr, and 1.05% in Re, surpasses ResNet50 with 2.17% higher Acc, 2.87% higher F1s, 4.97% higher Pr, and 0.79% higher Re, and outshines VGG16 with a significant lead of 37.08% in Acc, 69.05% in F1s, 64.55% in Pr, and 58.58% in Re.
Table 6 Class-based results for Raabin (%)Table 7 Classification results of different models for Raabin (%)The confusion matrices obtained from the experimental studies conducted using the proposed SC-MP-Mixer with all three datasets are presented in Fig. 6. According to Fig. 6, the proposed SC-MP-Mixer correctly predicted all 172 B images, 492 out of 493 EO images, 221 out of 223 ER images, 411 out of 426 IG images, 172 out of 175 L images, 210 out of 212 M images, 478 out of 491 N images, and all 372 P images in the PBC dataset. Similarly, in the Raabin dataset, it correctly predicted 52 out of 54 B images, 147 out of 157 EO images, 498 out of 529 L images, 113 out of 125 M images, and 1295 out of 1312 N images. Finally, within the BCCD dataset consisting of 4 classes, it correctly predicted 523 out of 623 EO images, 617 out of 620 L images, 582 out of 620 M images, and 549 out of 624 N images. Considering the total correctly predicted images, class-specific accuracy values for each dataset are provided in Table 2 for BCCD, Table 4 for PBC, and Table 6 for Raabin. The macro Acc values obtained using the proposed SC-MP-Mixer for BCCD, PBC, and Raabin datasets are as follows: 95.66, 99.65, and 98.68%, respectively.
Fig. 6
Confusion matrices obtained for each data set using the proposed SC-MP-Mixer. The x-axis and y-axis of the complexity matrices indicate the predicted label and the true label, respectively
Ablation analysisThe proposed SC-MP-Mixer model comprises a combination of Multipath SwTrans (MPST) and Multipath ConvMixer (MPCM) architectures. While the MPCM structure consists of three parallel ConvMixer blocks, the MPST structure comprises two parallel SwTrans blocks. The individual impact of each component within the proposed SC-MP-Mixer model on classification results (Acc, Pr, Re, and F1s) has been examined and presented in Table 8. Model 1 contains only ConvMixer, Model 2 includes solely SwTrans, Model 3 incorporates solely the MPCM structure, Model 4 integrates both MPCM and SwTrans, Model 5 contains only MPST, Model 6 is the combination of ConvMixer and MPST, and finally, Model 7 encompasses the components within the proposed SC-MP-Mixer model.
Table 8 Results of ablation analysisAnalysing Table 8, the lowest classification results are obtained when the ConvMixer (Model 1) and SwTrans (Model 2) models are used alone. When comparing the results between Model 1 and Model 3 in Table 8, Model 3 has yielded a respective improvement of 0.06%, 0.26%, and 19.99% in accuracy for the BCCD, PBC, and Raabin datasets compared to Model 1. These outcomes indicate that the MPCM structure is more effective than a single ConvMixer block. MPST (Model 5), when used alone, achieves lower accuracy compared to models with other components except for ConvMixer only and SwTrans only. However, the inclusion of MPST with ConvMixer (Models 6 and 7) improves performance for BCCD, PBC and Raabin. This suggests that MPST, when combined with ConvMixer, may be helpful in addressing certain aspects of the data. Furthermore, including ConvMixer consistently improves performance across all datasets. This suggests that ConvMixer effectively extracts important features from the images. Moreover, in Model 4, augmenting the SwTrans model to the MPCM model exhibits further enhancement: the accuracy values increase by 1.15, 0.77, and 1.1% for the BCCD, PBC, and Raabin datasets, respectively. Introducing the MPST block instead of a single SwTrans model alongside the MPCM model leads to an increase in accuracy by 1.27, 0.11, and 0.24% for the BCCD, PBC, and Raabin datasets, respectively. When all models are analyzed, it is seen that Model 7, the proposed SC-MP-Mixer model, achieves the most successful results in all evaluation metrics in all datasets.
Comparison analysis with different models in the literatureTo demonstrate the effectiveness of our SC-MP-Mixer model, we compared it with different studies from the literature. The comparison results are shown in Table 9. In these comparisons, our proposed model was repeated 4 times, and its standard deviation was calculated and added to this table. When Table 9 is examined, it is seen that the SC-MP-Mixer method achieved the best results in BCCD, PBC and Raabin datasets. In the BCCD dataset, our SC-MP-Mixer method achieved 95.66% macro Acc. In this dataset, the closest result to the SC-MP-Mixer method was found with the proposed Canonical Correlation Analysis (CCA)—(InceptionV3 + LSTM) method by Patil et al. [1] with 91.06%. The SC-MP-Mixer method gives 4.6% better results. In addition, Patil et al. [1] found an Acc of 89.85% when using VGG16 in conjunction with LSTM. The SC-MP-Mixer method achieved a 5.81% higher Acc value than VGG16 + LSTM. Similarly, our SC-MP-Mixer method has 4.65% better Acc than Bani-Hani et al. [24] method (CNN + Genetic Algorithm) and 4.87% better than Liang et al. [35] method (Xception + LSTM). Moreover, our SC-MP-Mixer achieved 8.21% higher Acc than InceptionV3 + LSTM proposed by Liang et al. [35] 6.28% higher than ResNet50 + LSTM, and 7.08% higher than Xception + ResNet50 + LSTM. The SC-MP-Mixer method achieved 9.7% higher Acc than the CNN + SVM developed by Ekiz et al. [33], 7.73% higher than LeNet5 developed by Sharma et al. [26], and 4.87% higher than the Fused CNN presented by Banik et al. [27].
Table 9 Comparison classification results with different models in the literatureIn the PBC dataset, our SC-MP-Mixer model achieved 99.65% Acc. Our SC-MP-Mixer model achieved 0.66% better results than the proposed method by Uçar et al. [30]. Similarly, it obtained 2.6% better accuracy than the proposed VGG16 method by Acevedo et al. [50] and 3.6% better than the InceptionV3 proposed by Acevedo et al. [50]. Moreover, our SC-MP-Mixer model achieved Acc values that were 0.35% higher than the Capsule network-based model suggested by Long et al. [51], 0.76% higher than the Modified Inception-based module developed by Fırat [52], and finally, 0.34% higher than the R-CNN-based classification presented by Atıcı et al. [53]. SC-MP-Mixer model achieved an Acc of 98.68% with the Raabin, which was another dataset used in the experimental studies. When compared to different studies using the Raabin, SC-MP-Mixer model shows the closest Acc value to our model at 98.33%, achieved by the ViT-Base-16 model developed by Tsutsui et al. [54]. However, our SC-MP-Mixer model outperformed the ViT-Base-16 model by 0.35% in Acc. Upon further examination of other models, our SC-MP-Mixer model obtained Acc values that were 3.51% higher than the Discriminative Region Detection Assisted Feature Aggregation Network model presented by Jiang et al. [45], 0.68% higher than the hybrid use of Detectron2 and YOLOv5 model developed by Akalin et al. [55], and 4.03% higher than the SVM used by Tavakoli et al. [56]. When all models in Table 9 are compared, it’s evident that SC-MP-Mixer model outperformed the studies in the literature across all three datasets, yielding significantly better results.
留言 (0)