
記住我

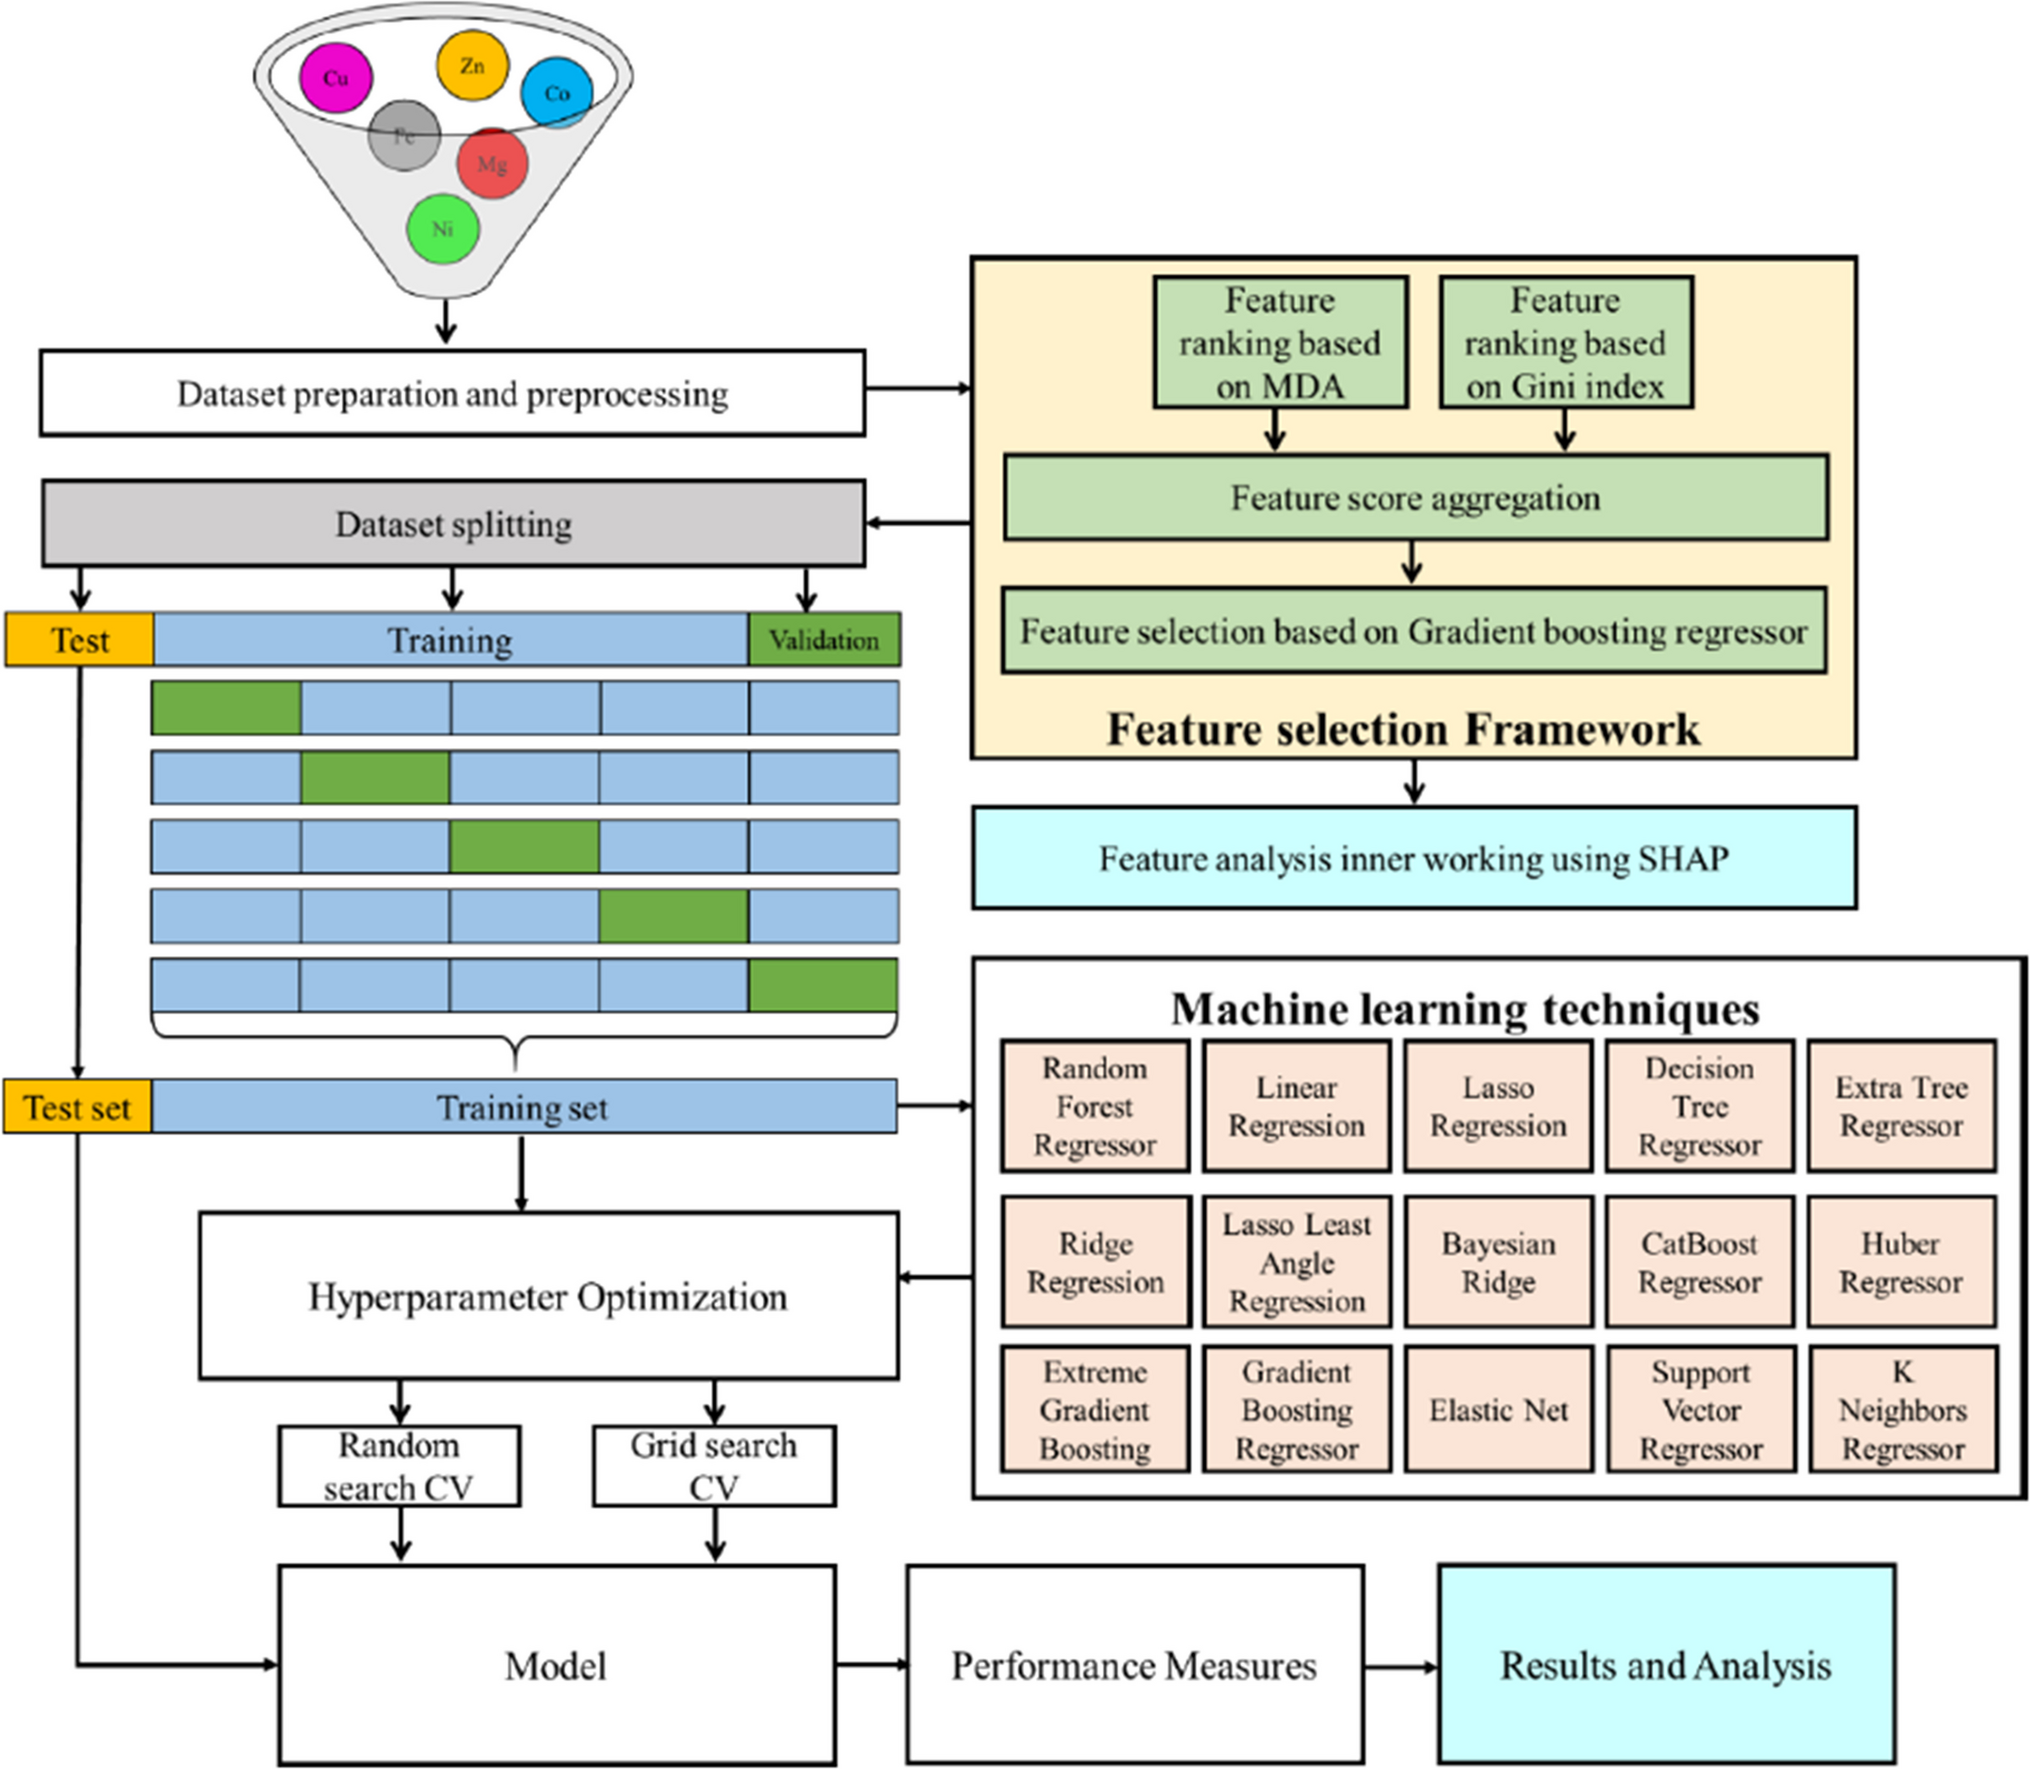
In this study, a hybrid machine learning framework is proposed to optimize CHO cell culture media and predict the critical quality attribute. The model is composed of machine learning techniques including random forest regression, linear regression, lasso regression, decision tree regression, extra tree regression, ridge regression, lasso least regression, Bayesian ridge, catboost regression, Huber regression, extreme gradient boosting, gradient boosting regression, elastic net, support vector regression, and k-nearest regression. A graphical representation of the proposed framework is provided in Fig. 1. The pipeline consists of five distinct operational stages: (1) preparation and preprocessing, (2) feature selection and analysis, (3) optimization, (4) model development, and (5) model evaluation. Media formulations were prepared by supplementing the various combinations of metal salts such as copper (Cu), iron (Fe), zinc (Zn), manganese (Mn), magnesium (Mg), cobalt (Co), and nickel (Ni) into the basal medium. To enhance the accuracy of the proposed algorithm, it is necessary to perform preprocessing steps on the dataset, including data sampling, missing value imputation, and normalization. Following the preprocessing stage, two distinct approaches, namely, mean decrease accuracy (MDA) and Gini Index, were used, and SHapley Additive exPlanations were utilized to visualize the significance of the features. For training the model, the dataset is divided into K equal parts (K = 6), and the model that is trained is verified by utilizing the remaining dataset. Following the data pre-processing, various models for machine learning are established utilizing the hyperparameter optimization approach with cross-validation. Hyperparameter tuning methods for finding the optimal values for a model’s parameters include grid search and random search. Finally, a total of fifteen ML methods were used to screen metal ion concentrations, analyze their impact on the charge variant profile, and estimate the optimal concentrations.
Fig. 1
Proposed machine learning framework for prediction of critical quality attributes
Cell line and reagentsIgG1 protein (Trastuzumab) producing CHO-GS(-/-) cell line was used and was provided by an industrial collaborator (Imgenex®, Bhubaneswar, India). The cell line is suitable for growth in glutamine-free media, once transfected with the vector containing glutamine synthetase gene (GS). A commercially available proprietary cell culture medium CD CHO® (Gibco™—12,490–001) was used as a basal medium, and Efficient Feed B medium (Gibco™—A1245605) as a medium feed supplement for fed-batch culture. Metal salts, copper (II) chloride dihydrate, magnesium sulfate heptahydrate, manganese chloride, iron sulfate heptahydrate, cobalt sulfate heptahydrate, zinc chloride, and nickel (II) chloride hexahydrate were purchased from Merck (Kenilworth, NJ, USA).
Cell cultureWorking cell bank (WCB) vial was revived from liquid nitrogen (− 196 °C) for 2 min at 37 °C in the water bath. As cells were thawed, immediately transferred into a freshly prepared CD CHO basal medium. Cells were passaged and maintained at least 2–3 times in basal media in a shaker flask (SF) after being well acclimated before the main experiment. Cell culture propagated in 125-mL shaker flasks (SF-125) having a working volume of 30 mL was incubated in a humidified incubator shaker (New Brunswick™ S41i—Eppendorf), at 5% CO2 concentration at 37 °C and 110 rpm agitation. Culture flasks were seeded with the initial cell density of 0.5 × 10⁶ cells/mL and were in both batch and fed-batch mode.
Batch mode was operated for 6 days, and these data were utilized for feature selection and regression model development while fed-batch data were used for validation of optimized media with respect to the control (basal medium). Fed-batch mode operated for 10 days with 10% of efficient feed B supplemented every alternate day starting from day 3rd to day 9th. Samples were collected every alternate day before the addition of feed and analyzed for various culture metabolites, cell count, and viability. Flasks were harvested on day 6 of culture for batch and day 10 for fed-batch, after centrifugation (Eppendorf – 5810R) at 5000 rpm and 25 °C. Harvest (spent medium) was further analyzed for titer, charge variants, and low and high molecular variants.
Trypan Blue exclusion method was used with a hemocytometer to determine cell viability and count. This device is based on the cell membrane’s structural integrity. In contrast to dead cells, which stain and appear dark, living cells have a well-integrated membrane that prevents dye from entering and prevents staining (Strober 2001).
Medium formulationsMedia formulations were prepared by supplementing the various combinations of metal salts into the basal medium. Previous studies have also demonstrated the significance of metal ions in determining the CQAs. Concentrations of the metal ions (Cu, Fe, Zn, Mn, Mg, Co, and Ni) were based on previous literature (Gangwar et al. 2021), shown in parts per million (ppm) and summarized in Table 1.
Table 1 Summary of the dataset used in this studyAnalytical methodsCulture harvest was purified by preparative Protein A chromatography using an Akta Avant (GE Healthcare, Sweden) system. Mobile phases consisted of equilibration buffer (50 mM phosphate and 150 mM NaCl, pH 7.5) and elution buffer (100 mM glycine, pH 3.0). The purification protocol was followed as per the established procedure (Rathore and Narnaware 2022).
Protein A eluted fractions were further analyzed for charge heterogeneity using cation-exchange high-performance liquid chromatography (CE‐HPLC). The analysis was performed on a Thermo Fisher RSLC system (Thermo Fisher Scientific, Waltham, 8 USA), having a DAD detector. The CEX method used to evaluate charge variants consisted of a linear gradient of mobile phase A (15 mM sodium phosphate, pH 6.2) and mobile phase B (150 mm sodium phosphate, pH 6.2) with 0.05% sodium azide. The separation was performed on a MAbPaC SCX‐10RS column (4.6 × 250 mm, Thermo Fisher Scientific, Waltham, USA) at a flow rate of 0.8 mL/min and 28 °C, and elution was monitored using UV absorbance at 280 nm. The reference CEX profile is provided in Fig. S1.
For estimating metal ions, inductively coupled plasma mass spectrometry (ICP-MS, Agilent Technologies, USA) was used. It combines a high-temperature ICP source with a mass spectrometer. The ICP ionizes the atoms of the elements in the sample. These ions are then separated and detected by the mass spectrometer.
DatasetThe screening dataset was generated by culturing cells in batch mode using various media formulations and prepared as suggested in the previous section. Charge variants, i.e., acidic (Y1) and basic (Y2) variant amounts in purified mAb were taken as target variables. Media formulations having different concentrations of metal ions were used as predictor variables. A total of seven metal ions were taken as features or predictors, while a total of 34 formulations used in the experiment were used as observations. Finally, the features with the corresponding targets were fed as an input to the feature selection framework. The dataset (Table S1) and variables are explained in Table 1.
Machine learning methodsFeature selection based on various biostatistics tools and ML approaches were discussed in order to identify the features that have significant effects on the target variables. Then, medium optimization was performed to get the optimum concentration of Fe and Zn to achieve the desired charge variant profile. Finally, different ML regressor models on featured variables were used to evaluate the performance of various models for the prediction of charge variants.
Feature rankingThe possibility of a feature being connected to the target variable was effectively quantified by statistical methods, with the coefficients produced by the Pearson correlation coefficient (PCC). Using these scores, we were able to construct a ranking of the features, which is based on their degree of association with the target variable. Features with higher scores indicate a stronger relationship with the target, while those with lower scores exhibit a weaker connection (Sedgwick 2012; Obilor and Amadi 2018). This approach allows us to effectively identify and prioritize features based on their relevance to the target variable. Pearson correlation matrix was generated using the “seaborn (version: 0.12.2),” a Python library.
For ML feature ranking, we focused on embedded methods such as random forests and gradient-boosting regressors. The “RandomForestRegressor” and “GradientBoostingRegressor” functions from the “ensemble” module of the “scikit-learn (version:1.3.0)” library were used respectively for ML-based feature selection. Random forests provides two feature ranking techniques: permutation-based feature importance or mean decrease in accuracy (Altmann et al. 2010) (“permutation_importance” function in the “inspection” module of the “scikit-learn” library) and Gini importance or mean impurity reduction (Menze et al. 2009; Nembrini et al. 2018) (inbuilt attribute “feature_importances” in “RandomForestRegressor” function of “ensemble” module in “scikit-learn” library). SHAP (SHapley Additive exPlanations) is a game theoretic approach to explain the output of any machine learning model (Lundberg and Lee 2017). We have used SHAP to explain the contribution of features.
Model developmentSupervised learning models were developed for the prediction of charge variant composition of mAbs produced in various media formulations after the culturing of cells. Several ML techniques such as linear regression (LR), lasso regression, ridge regression, lasso least angle regression (LLA), Bayesian ridge (BR), decision tree regressor (DT), Huber regressor, support vector machine (SVR), random forest regressor (RF), CatBoost regressor, extreme gradient boosting (XGBoost), gradient boosting regressor (GBR), elastic net, extra tree regressor (ET), and K neighbors regressor (KNN) were employed.
Medium optimizationOne of the ML-based boosting techniques, the gradient-boosting regressor (GBR), was used to optimize media components. The “GradientBoostingRegressor” from the “ensemble” module of the “scikit-learn” library was used to construct the ML model, where the medium components and charge variants were employed as the explanator and the objective variables, respectively. Fivefold cross-validation was performed to search for hyperparameters using both grid and randomized search. “GridSearchCV” in the “model_selection” module of the “scikit-learn” library was used for grid search of hyperparameter tunning while “RandomizedSearchCV” of the same module and library was used for randomized search. The hyperparameters were searched for “learning_rate” from 0.001 to 0.5 in increments of 0.005, “max_depth” from 2 to 5 in increments of 1, and n_estimators at 300 and 400, respectively. The other hyperparameters were used by default.
Performance measureTo evaluate prediction accuracy, various metrics were used, including mean absolute error (MAE), mean squared error (MSE), root mean square error (RMSE), coefficient of determination (R-sqr), and adjusted R-squared (Adj R-sqr). The “mean_absolute_error,” “mean_squared_error,” and “r2_score” functions from the “metrics” module within the “scikit-learn” library were employed to calculate mean absolute error (MAE), mean squared error (MSE), and coefficient of determination (R2), respectively. Root mean squared error (RMSE) was computed by calculating the square root of MSE using the “sqrt” function from the “numpy” library. Adjusted R2 (Adj_R2) was calculated by using R2, number of features (k), and number of observations (n) using the following formula:
$$}\_R}^=1- \frac^)(n-1)}$$
A prediction accuracy assessment of the machine learning models was conducted through a sixfold cross-validation approach.
留言 (0)