
記住我

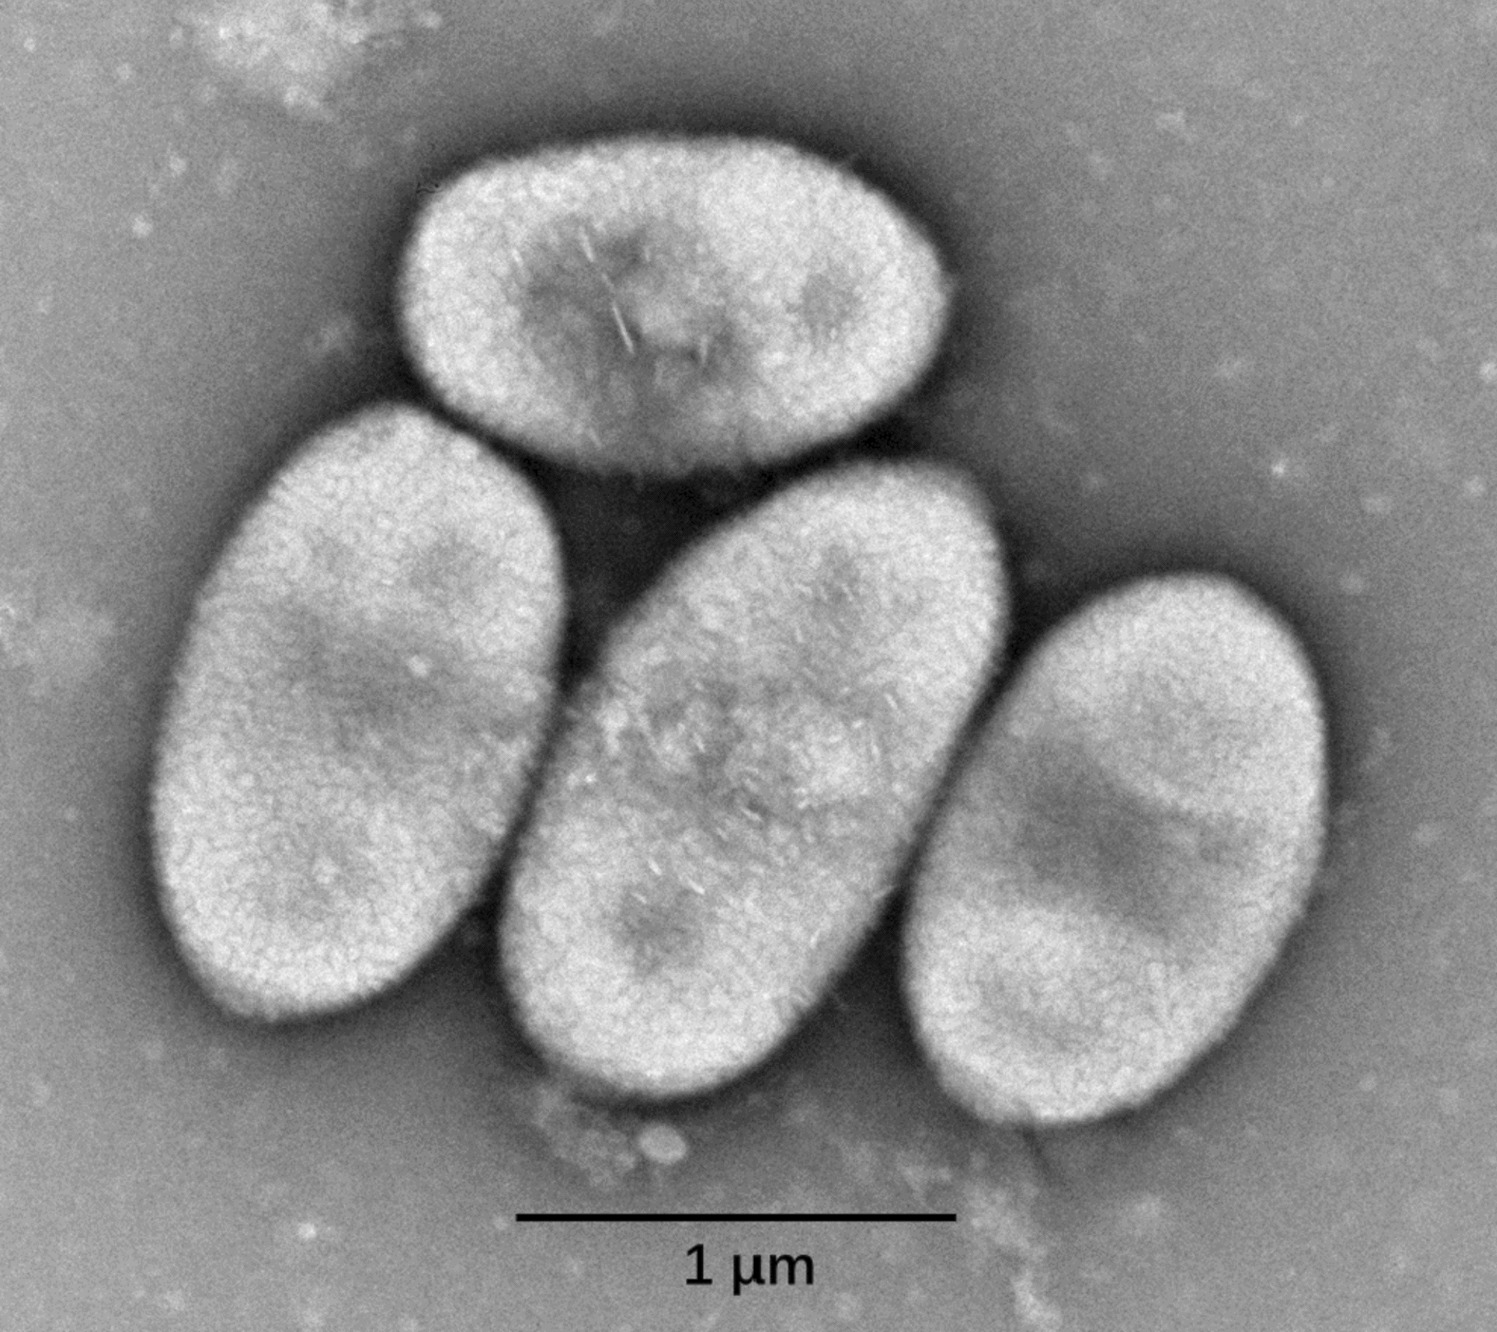
Colonies of JXJ CY 53 T were yellow, smooth, circular, and wet in appearance after 3 days of inoculation on TSA plates. Cells were Gram-stain-negative, aerobic, and oval-shaped (0.7–1.0 × 0.9–2.0 μm) (Fig. 1). The growth ranges of pH values, temperatures, and NaCl contents were pH 4.0–11.0, 4.0–40.0 °C, and 0–3.0% (w/v) NaCl, with optimal ranges of pH 7.0–8.0, 28 °C, and 0% (w/v) NaCl, respectively. Bubbles arising from the bacterial cell mass showed that its catalase-reaction was positive. After staining with Lugol iodine solution, transparent zones forming around colonies of JXJ CY 53 T grown on starch medium showed that it was positive for starch hydrolysis. Halos formed around colonies of JXJ CY 53 T grown on the media containing Tween 20, 40, and 80, indicating that it could hydrolyze these Tweens. Detailed features were listed in Table 2 with the species description.
Fig. 1
The transmission electron micrograph of strain JXJ CY 53 T
Table 2 Differential characteristics of strain JXJ CY 53 T and the two reference strainsChemotaxonomic characteristicsThe primary cellular fatty acids were C18:1ω7c (48.74%) and C16:0 (14.56%), similar to S. panni DSM 15761 T and S. hankookensis KCTC 22579 T (Supplemental Table S1). Q-10 was its prime ubiquinone. The strain in addition contained diphosphatidylglycerol (DPG), phosphatidylmethylethanolamine (PME), sphingoglycolipid (SGL), phosphatidylcholine (PC), an unidentified lipid (L1), and an unidentified phospholipid (PL) (Supplemental Fig. S1).
Molecular phylogenetic analysisStrain JXJ CY 53 T shared high 16S rRNA gene sequence identities with S. panni DSM 15761 T (98.9%), S. hankookensis KCTC 22579 T (98.7%), and Sphingomonas desiccabilis CP1DT (97.3%), while it formed a stable clade with S. hankookensis KCTC 22579 T on three different trees (Fig. 2 and Supplemental Figs. S2 and S3). Chun et al. (2018) recommended that ANI and dDDH values needed to be calculated to determine a new taxon only when the 16S rRNA gene sequence identity was higher than 98.7%. In the present study, hence, the ANI and dDDH values were calculated only between JXJ CY 53 T and S. panni DSM 15761 T or S. hankookensis KCTC 22579 T, and they were 83.35% and 29.40%, and 83.02% and 28.90%, respectively, much lower than 95–96% and 70%, the generally accepted species cutoff values (Chun et al. 2018). Hence, combined with other data given above, JXJ CY 53 T was undoubtedly assigned as a novel species of the genus Sphingomonas, and the species epithet was proposed as Sphingomonas lacusdianchii sp. nov.
Fig. 2
Neighbor-joining phylogenetic tree based on 16S rRNA gene sequences of strain JXJ CY 53 T and its closest relative species of the genus Sphingomonas. Bootstrap values (≥ 50%) based on 1000 replications are shown at the branching points. Asterisks indicate that the corresponding nodes were conserved in the trees generated with the maximum-likelihood and maximum-parsimony tree-making algorithms. Bar, 0.02 changes per nucleotide position
Genomic featuresThe draft genomes accession numbers of JXJ CY 53 T, S. panni DSM 15761 T, and S. hankookensis KCTC 22579 T were JAKRET000000000, JAKREU000000000, and JAKREV000000000, respectively. Features of the established sequence of JXJ CY 53 T were listed in Table 3. Strain JXJ CY 53 T had 1.34% of repeat region, while S. panni DSM 15761 T and S. hankookensis KCTC 22579 T had no repeat region; and JXJ CY 53 T had 63 tRNA and 5 rRNA gene sequences, while S. panni DSM 15761 T and S. hankookensis KCTC 22579 T had 59 tRNA and 3 rRNA gene sequences, 60 tRNA and 3 rRNA gene sequences, respectively.
Table 3 Genomic features and comparison between strain JXJ CY 53 T and the reference strainsJXJ CY 53 T harbored genes that facilitated the reciprocity and mutual benefit with the cyanobacterial cells (Supplemental Table S2-S4), including genes involved in coexisting with the cyanobacterium (Supplemental Table S2), exchange of nutrients, synthesis of plant growth hormones, vitamins, and carotenoids (Supplemental Table S3), dissolving insoluble phosphorus and fixing nitrogen (Supplemental Table S4), etc. Meanwhile, metabolism-related genes were retrieved from the genomes of JXJ CY 53 T, S. panni DSM 15761 T, and S. hankookensis KCTC 22579 T, such as phosphate assimilation-related genes (phoB, phoR, pstA, pstB, pstC, and pstS) and nitrogen fixing genes (glnA, glnB, glnD, ntrX, and ntrY) (Supplemental Fig. S4).
Phytoene desaturase can catalyze the four-step desaturation of phytoene with the resultant product of lycopene, a kind of carotenoid (Fournié and Truan 2020). Here, the gene for the phytoene desaturase CrtI was detected in all of the genomes of strains JXJ CY 53 T, S. panni DSM 15761 T, and S. hankookensis KCTC 22579 T. In addition, the potential for four-step desaturations which desaturated phytoene to lycopene was detected in all of these bacteria (Supplemental Fig. S5).
Capacity to dissolve insoluble phosphorus and fix nitrogenAfter 2 days of cultivation in a nitrogen-free medium, living cellular density increased to 2.5 × 10⁷ CFU/mL from 1.0 × 10⁶ CFU/mL. Accordingly, we supposed that JXJ CY 53 T might convert N2 into NH3 to support its growth. After 2 days of cultivation, soluble phosphorus elements increased by 6.05 ± 0.35 mg/L in tricalcium phosphate medium and 4.59 ± 0.30 mg/L in phytin medium. Resumptively, JXJ CY 53 T might convert insoluble organic and inorganic phosphorus into soluble phosphorus.
Effects of co-culture on the growths of MF-905 and its attached bacteriaOn days 5 and 10 of cultivation, chl-a concentrations in the MF-905 control group increased to 0.550 and 1.158 mg/L from 0.092 mg/L, respectively. In the 5-day cultures, six bacterial strains in BCs exhibited no effects on the biomass of MF-905 (p > 0.05) in contrast to JXJ CY 11, 37, and 57, which resulted in the decreases of chl-a concentrations by 26.4, 8.6, and 21.3% (p < 0.05, p < 0.01), respectively (Fig. 3A). Chl-a concentrations of TCs were similar to that of the control (p > 0.05) except TCs with JXJ CY 53 + 11 and 53 + 57, of which the chl-a concentrations decreased by 8.1, and 15.2% (p < 0.05, p < 0.01) compared with that of the control (Fig. 3A). Chl-a concentrations of TCs with JXJ CY 53 + 11, 53 + 37, and 53 + 57 were 0.505, 0.536, and 0.466 mg/L, which were 24.8, 6.7, and 7.7% higher (p < 0.05, p < 0.01) than those of BCs with JXJ CY 11, 37, and 57 (Fig. 3A), respectively. However, chl-a concentrations of TCs with JXJ CY 53 + 11, 53 + 28, and 53 + 57 decreased by 10.0, 9.5, and 16.9% (p < 0.05, p < 0.01) when compared with that of BC with JXJ CY 53 (Fig. 3A).
Fig. 3
Influences of BC and TC on the growth of MF-905. + , adding JXJ CY 53 T. Error bars indicate standard deviations for the three replicates. A and B were samples of days 5 and 10, respectively. * and ** indicated the significant differences between control and BCs (or TCs) at the levels of p < 0.05 and p < 0.01, respectively. (*), (**) indicated the significant differences between BC with JXJ CY 53 T and TC at the levels of p < 0.05 and p < 0.01, respectively. # and ## indicated the significant differences between relevant BC and TC with eight other strains at the levels of p < 0.05 and p < 0.01, respectively
On day 10 of co-cultivation, chl-a concentrations of BCs with JXJ CY 05, 18, and 37 were 0.834, 1.049, and 0.935 mg/L, which decreased by 28.0, 9.4, and 19.3% (p < 0.05, p < 0.01), respectively, when compared with that of the control (Fig. 3B). In contrast, the chl-a concentration of BC JXJ CY 28 was 1.264 mg/L, which increased by 9.2% (p < 0.05) when compared with that of the control (Fig. 3B). On day 10 of co-cultivation, six out of eight TCs did not exhibit an effect on the biomass of MF-905 (p > 0.05) except TCs with JXJ CY 53 + 11 and 53 + 28, of which the chl-a concentrations were 1.331 and 1.328 mg/L, that increased by 14.9 and 14.7% (p < 0.01) when compared with that of the control (Fig. 3B). Chl-a concentrations of TCs with JXJ CY 53 + 05, 53 + 11, 53 + 16, and 53 + 37 were 1.183, 1.331, 1.205, and 1.108 mg/L, which increased by 41.8, 10.7, 6.9, and 18.5% (p < 0.05, p < 0.01), respectively, when compared with those of the relevant BCs (Fig. 3B). Chl-a concentrations of TCs with JXJ CY 53 + 11 and 53 + 28 increased by 16.3 and 16.1% (p < 0.01), respectively, when compared with that of BC JXJ CY 53.
After 5 days of co-cultivation (Table 4), cellular densities of JXJ CY 16, 28, and 31 in BCs decreased significantly (p < 0.01), while that of JXJ CY53, 05, 11, 37, and 57 in BCs increased significantly (p < 0.01); cellular densities of JXJ CY 28 and 31 in TCs, and JXJ CY 53 T in TCs with JXJ CY 11, 18, 28, and 57 decreased significantly (p < 0.01), while that of JXJ CY 05, 11, 16, 18, 37, and 57 in TCs, and JXJ CY 53 T in TCs with JXJ CY 05, 16, 31, and 37 increased significantly (p < 0.05, p < 0.01). Then, the densities of these bacteria generally decreased significantly with the culture times in both BCs and TCs (p < 0.01). The addition of different bacteria into the BC with JXJ CY 53 T resulted in different effects on the growth of JXJ CY 53 T, including inhibiting, promoting (p < 0.05, p < 0.01), or showing no influences (p > 0.05). The addition of JXJ CY 53 T into the BCs with any other of the eight bacteria resulted in similar phenomena.
Tabel 4 Cellular densities of nine strains in BC and TCEffects of co-culture on MC-LR concentrationThe I-MC-LR concentrations of the control were 1038.9 and 908.1 µg/mg chl-a on days 5 and 10 of cultivation, respectively. On day 5 of co-cultivation, I-MC-LR concentrations of BCs with JXJ CY 11, 16, and 18, increased by 6.9 and 6.2%, and decreased by 8.2%, respectively, when compared with that of the control (p < 0.05); and I-MC-LR concentrations of TCs with JXJ CY 18 + 53, 28 + 53, 31 + 53, 37 + 53, and 57 + 53 decreased by 15.6% (p < 0.01), and increased by 17.1, 13.2, 9.8, and 12.3% (p < 0.05, p < 0.01), respectively, when compared with that of the control (Fig. 4A). On day 10 of co-cultivation, I-MC-LR concentrations of BCs with JXJ CY 11, 37, 57, and 31 increased by 13.3, 14.2, and 8.6% (p < 0.05, p < 0.01), and decreased by 14.9% (p < 0.01), respectively, when compared with that of the control; and I-MC-LR concentrations of TCs with JXJ CY 31 + 53 and 37 + 53 decreased by 11.8 and 19.3% (p < 0.05, p < 0.01), respectively, when compared with that of the control (Fig. 4B).
Fig. 4
Influences of BC and TC on E-MC-LR and I-MC-LR contents of MF-905. + , adding JXJ CY 53 T. Error bars indicate standard deviations for the three replicates. A and C were samples of day 5; B and D were samples of day 10. * and ** indicated the significant differences between control and BC (or TC) at the levels of p < 0.05 and p < 0.01, respectively. (*) and (**) indicated the significant differences between BC with JXJ CY 53 T and TC at the levels of p < 0.05 and p < 0.01, respectively. # and ## indicated the significant differences between relevant BC and TC at the levels of p < 0.05 and p < 0.01, respectively
The E-MC-LR concentrations of the control were 37.0 and 180.8 µg/mg chl-a on days 5 and 10 of cultivation, respectively. On day 5 of co-cultivation, E-MC-LR concentrations of BCs with JXJ CY 11, 37, and 57 increased by 18.6, 18.9, and 21.0% (p < 0.05, p < 0.01), respectively, when compared with that of the control; E-MC-LR concentrations of TCs with JXJ CY 53 + 16, 53 + 57, and 53 + 18 increased by 16.2 and 10.6% (p < 0.05), and decreased by 33.2% (p < 0.01), respectively, when compared with that of the control (Fig. 4C). On day 10 of co-cultivation, E-MC-LR concentrations of BCs with JXJ CY 05, 16, 31, and 37 increased by 53.2, 20.8, 22.9, and 45.9% (p < 0.05, p < 0.01), respectively, when compared with that of the control, while E-MC-LR concentrations of BCs with JXJ CY 11, 18, 28, and 57 decreased by 28.0, 26.7, 33.5, and 40.0% (p < 0.01), respectively, when compared with that of the control (Fig. 4D). On day 10 of co-cultivation, E-MC-LR concentrations of TCs with JXJ CY 53 + 05, 53 + 31, and 53 + 37 increased by 23.1, 15.1, and 58.1% (p < 0.05, p < 0.01), respectively, when compared with that of the control, while E-MC-LR concentrations of TCs with JXJ CY 53 + 11, 53 + 28, and 53 + 57 decreased by 50.0, 42.9, and 61.9% (p < 0.01), respectively, when compared with that of the control (Fig. 4D).
Effects of limited bio-available N and P on the growth of MF-905 and JXJ CY 53 TIn tricalcium phosphate medium, the inoculation of JXJ CY53T significantly influenced the growth and MC-LR synthesis of MF-905 (Table 5). The chl-a concentrations of MF-905 co-cultured with JXJ CY53T were 0.826 and 1.074 mg/L on days 9 and 18 and increased by 35.2 and 25.0% (p < 0.01), respectively, when compared with those of the controls. The I-MC-LR concentrations of MF-905 co-cultured with JXJ CY53T were 914.2 and 1517.9 μg/mg chl-a on days 9 and 18 and decreased by 14.5 and 18.3% (p < 0.05, p < 0.01), respectively, when compared with those of the controls. The E-MC-LR concentration of MF-905 co-cultured with JXJ CY53T was 19.6 μg/mg chl-a on day 18 and decreased by 53.3% (p < 0.01) when compared with that of the control.
Table 5 Influences of limited available P on the growths of MF-905 and JXJ CY 53 TIn bio-available nitrogen-limited medium, the inoculation of JXJ CY53T also influenced the growth and MC-LR synthesis of MF-095 (Table 6). The chl-a concentrations of MF-905 co-cultured with JXJ CY53T were 0.315 mg/L on day 14 and increased by 61.5% (p < 0.01) when compared with that of the control. The I-MC-LR concentration of MF-905 co-cultured with JXJ CY53T was 553.0 μg/mg chl-a on day 7 and decreased by 14.0% (p < 0.01) when compared with that of the control. The E-MC-LR concentration of MF-905 co-cultured with JXJ CY53T was 113.2 μg/mg chl-a on day 14 and decreased by 76.2% (p < 0.01) when compared with that of the control.
Table 6 Influences of limited available N on the growths of MF-905 and JXJ CY 53 TThe cellular densities of JXJ CY53T cultured with no MF-905 did not change in the samples collected at the first time for both media, followed by decreasing to about 104–105 CFU/mL (Table 5 and 6). However, the cellular densities of JXJ CY53T co-cultured with MF-905 decreased to 103–104 CFU/mL in the samples collected at the first time, and then increased to 8.83 × 10⁴ CFU/mL in tricalcium phosphate medium, and 2.77 × 10⁶ CFU/mL in bio-available nitrogen-limited medium.
Inhibitory activity of the metabolites from MF-905 on the attached bacteriaAntibacterial assays showed that the extracts from MF-905 exhibited obvious inhibitory activities on JXJ CY 16, 31, 37, and 53, and no or weak inhibitory activities on other attached bacterial strains (Supplemental Fig. S6). Fraction IV showed no inhibitory activity on all attached bacteria. Fraction II showed the strongest inhibitory activity with inhibition zone diameters of 0.8–1.6 cm on JXJ CY 16, 31, 37, and 53, followed by fraction I. Fraction III, containing MC-LR at 4 μg/disk, showed almost non-inhibitory activities on all of these bacteria.
Effects of JXJ CY 53.T on nonculturable attached bacteria of MF-905The data of Illumina MiSeq sequencing showed that relative abundances of MF-905 cultured without JXJ CY 53 T were more than 99.9% on days of 5, 10, and 15, and decreased to 98.35% on day 35. Many other bacteria belonging to different phyla were also detected with relative abundances of 0.0028–0.05% except Pseudomonadota, of which the relative abundance could reach 1.59% on day 35. This was due to the relative abundance of Brevundimonas affiliated to the Pseudomonadota that increased from 0 on day 5 to 1.59% on day 35. The relative abundance of Lactobacillus affiliated to the Bacillota increased from 0 on day 5 to 0.0265% on day 15, and then it reduced to 0.0118% on day 35. Furthermore, the relative abundance of Mucilaginibacter which belongs to the Bacteroidota increased from 0 on day 5 to 0.0079% on day 15, and then it reduced to 0.0039% on day 35. However, the relative abundance of Dubosiella which belongs to the Bacillota reduced from 0.0031% on day 10 to 0 on day 35. Similarly, the relative abundance of Akkermansia which belongs to the Verrucomicrobiota reduced from 0.0071% on day 10 to 0 on day 35.
JXJ CY 53 T co-cultured with MF-905 in BG11 medium did not die out 35 days later. The relative abundances of MF-905 co-cultured with JXJ CY 53 T were 86.90, 52.35, 92.96, and 98.46% on days 5, 10, 15, and 35, respectively; meanwhile, the relative abundances of JXJ CY 53 T co-cultured with MF-905 were 12.25, 17.42, 0.92, and 1.46% on days 5, 10, 15, and 35, respectively. However, the growth trends of nonculturable attached bacteria changed significantly in MF-905 cultures inoculated with JXJ CY 53 T. The relative abundance of Brevundimonas affiliated to the Pseudomonadota increased to 0.005% on day 35, which was much lower than when MF-905 was cultured without JXJ CY 53 T. The relative abundance of Lactobacillus affiliated to the Bacillota increased from 0.0115% on day 5 to 0.0139% on day 10, and then it reduced from 0.0086% on day 15 to 0.0046% on day 35. In addition, the relative abundances of Mucilaginibacter which belongs to the Bacteroidota were 0.0000, 0.0028, 0.0000, and 0.0054% on days 5, 10, 15, and 35, respectively. However, the relative abundance of Dubosiella which belongs to the Bacillota was 0.0106, 0.0000, 0.0086, and 0.0093% on days 5, 10, 15, and 35, respectively. Besides, the relative abundance of Akkermansia which belongs to the Verrucomicrobiota was 0.0048, 0.0111, 0.0034, and 0.0000% on days 5, 10, 15, and 35, respectively. The change of the growth state of these bacteria with the prolonged culture time of MF-905 co-cultured with JXJ CY 53 T was completely different from that of MF-905 cultured without JXJ CY 53 T.
In addition, the relative abundances of Mycobacterium affiliated to the Actinomycetota were 0.80, 30.17, 6.05, and 0.00% on days 5, 10, 15, and 35, respectively, which was totally undetected in MF-905 cultured without JXJ CY 53 T. Similarly, the relative abundances of Pseudomonas affiliated to the Pseudomonadota were 0.017, 0.028, 0.017, and 0.00% on days 5, 10, 15, and 35, respectively, which was also undetected in MF-905 cultured without JXJ CY 53 T. Therefore, the growth states of nonculturable attached bacteria of MF-905 were influenced greatly by the inoculation of JXJ CY 53 T.
Description of Sphingomonas lacusdianchii sp. nov.Sphingomonas lacusdianchii sp. nov. (la.cus.di.a'n.chii L. gen. n. lacus, of a lake; N.L. gen. n. dianchii, of Dianchi; N.L. gen. n. lacusdianchii, of Dianchi lake).
Cells are aerobic, Gram-stain-negative, and oval-shaped (0.7–1.0 × 0.9–2.0 μm), and grow well on TSA medium and secrete mucus. The growth ranges of temperatures, pH values, and NaCl contents are 4.0–40.0 °C, pH 4.0–11.0, and 0–3.0% (w/v) NaCl, respectively, with optimal values of 28 °C, pH 7.0–8.0, and 0% (w/v) NaCl. It can hydrolyze starch, Tweens (20, 40, and 80), and produce catalase. But it shows no activity in oxidase and nitrate reduction. C16:0 and C18:1ω7c are the primary cellular fatty acids. The prime ubiquinone is Q-10. It contains diphosphatidylglycerol (DPG), phosphatidylcholine (PC), phosphatidylmethylethanolamine (PME), sphingoglycolipid (SGL), an unidentified lipid (L1), and an unidentified phospholipid (PL).
The type strain, JXJ CY 53 T (= KCTC 72813 T = CGMCC 1.17657 T), was isolated from the cyanosphere of Microcystis sp. FACHB-905, collected in Lake Dianchi Yunnan province, China. The GenBank accession numbers for the 16S rRNA gene sequence and draft genome sequence of JXJ CY 53 T are MW723390 and JAKRET000000000, respectively.
留言 (0)