
記住我


The three groups in this study included HY individuals, HE individuals, and elderly individuals with CMDs. Principal component analysis (PCA) based on the samples was first performed for quality control. The results showed that one of the CMDs samples deviated from the group whose IQR was beyond the mean IQR +/- IQR_outlierDef standard deviation. Hence, its data were removed from further analysis (Figure S1). Table 1 shows the baseline characteristics of the subjects. The average age of the HY group was 28.60 (3.53), and that of the HE group and the CMDs group was 80.7 (4.69) and 79.3 (4.67), respectively. In the three groups, there were no statistically significant differences in the plasma indexes that represented the basic metabolic function of the liver and kidney, such as ALT, AST, TBIL, Scr, and BUN. Of note, elderly individuals with CMDs presented higher triglyceride (TG) and FPG levels than HE individuals, while other serum lipids, such as TC, HDL-C, and LDL-C, in the two groups were not significantly different.
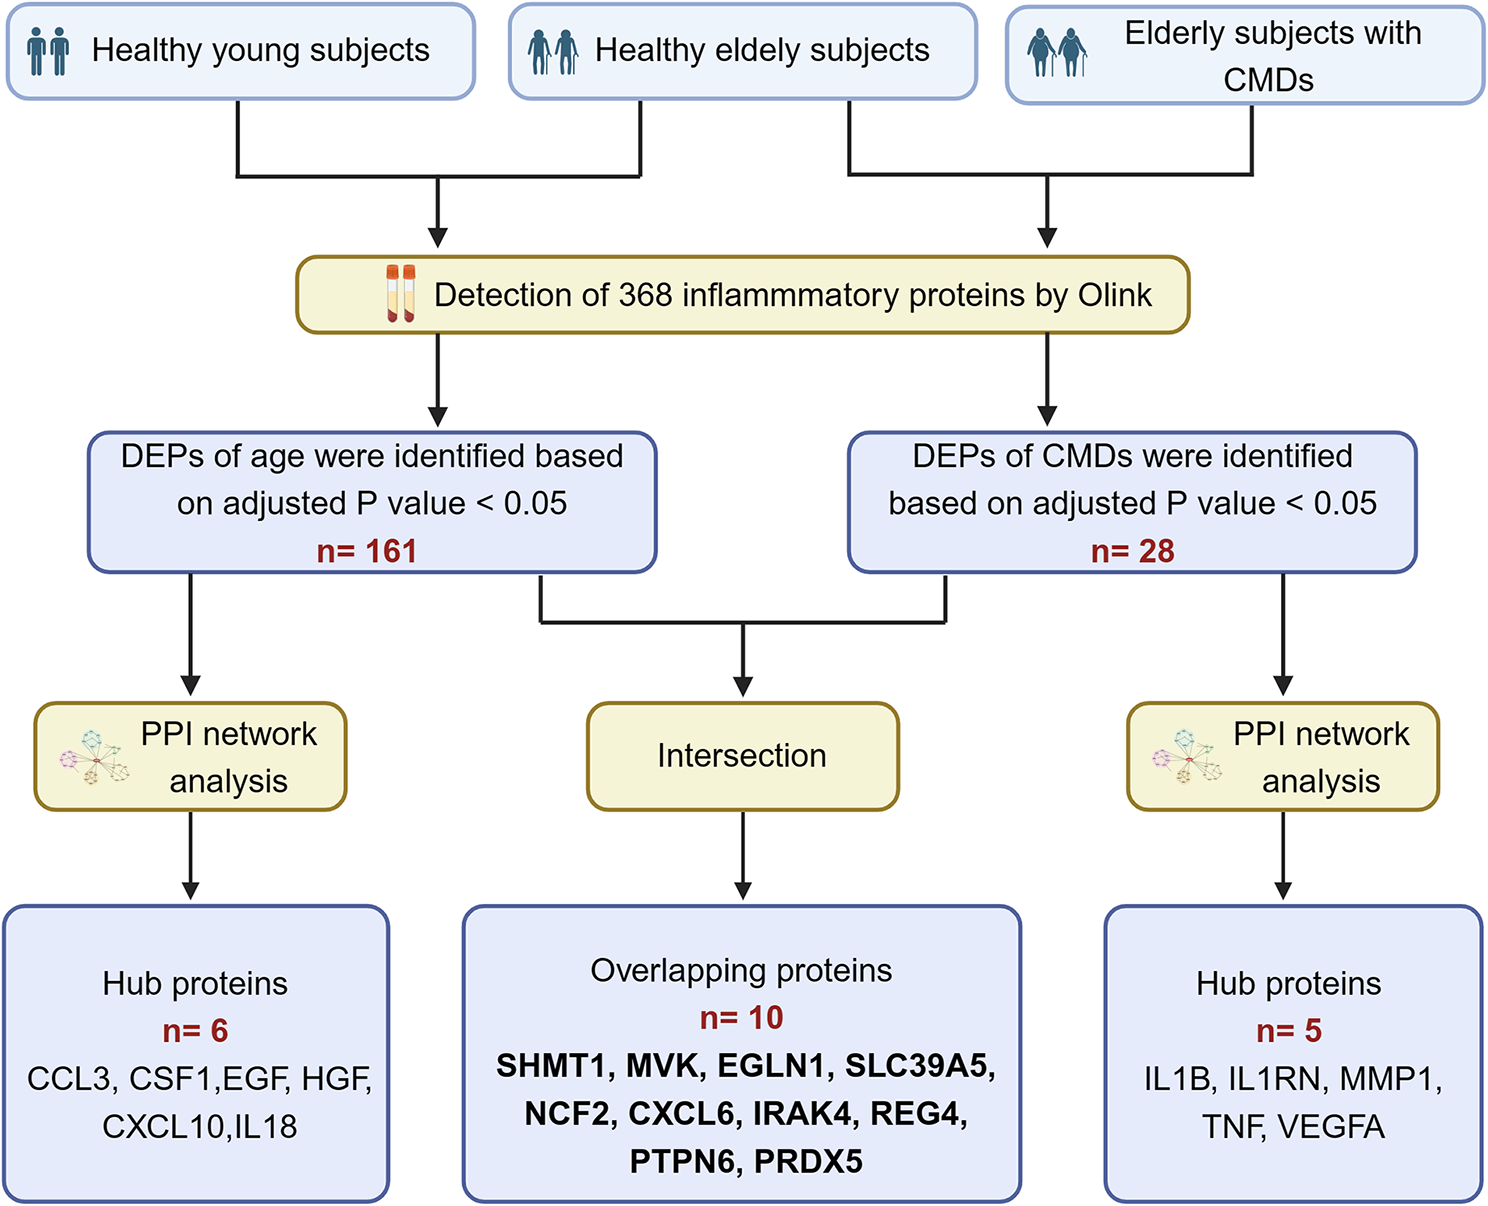
Table 1 Baseline Characteristic of study participantsDifferentially expressed inflammatory proteins between healthy young and healthy elderly individualsThe flow chart for this research is shown in Fig. 1. We detected 368 inflammatory proteins in the plasma of the three groups by O-link. The comparison of inflammatory proteins between the HY group and HE group indicated significant differences in 161 proteins (adjusted p < 0.05) at the plasma level. Of these, 96 inflammatory proteins were upregulated, and 65 inflammatory proteins were downregulated with aging (Fig. 2A). The top 30 DEPs are presented in Fig. 2B. To study the functions of DEPs associated with age, GO biological process and KEGG pathway enrichment analyses were performed. The results showed that DEPs associated with aging were mainly enriched in chemotaxis in GO analysis and NF-κB signaling pathway in KEGG pathway analysis (Fig. 2C and D). To explore the interaction between DEPs, a PPI network with combined scores greater than 0.4 was constructed using the STRING database. The PPI network of DEPs between HY and HE showed that CXCL10, EGF, IL7, IL18, CSF1, CCL3, CXCL1, CXCL9, and CSF3 most closely interacted with other proteins (Fig. 2E). To determine the hub genes in DEPs between HY and HE, functional modules of the PPI network were constructed by the MCODE plug-in in Cytoscape. The cluster with the highest score (9.56) contained 86 edges and 10 nodes, including CXCL10, CCL3, CSF1, CSF3, IL7, IL18, HGF, CXCL9, OSM, and EGF (Fig. 2F). Furthermore, we utilized seven algorithms to screen the top 15 hub proteins. There were 7 proteins in all 7 methods, namely, CXCL10, CSF1, EGF, HGF, IL18, CCL3, and CXCL1 (Table S1 and Fig. 2G). Of these, CXCL10, CSF1, EGF, HGF, IL18, and CCL3 also exist in the functional module. Therefore, these 6 proteins were considered hub proteins of inflammation in aging in this study and were used to construct a coexpression network for analyzing the functions of hub proteins using the GeneMANIA database (Fig. 2H). The relative expression levels of hub proteins are presented in Fig. 2I, which shows that EGF was the most significantly differentially expressed hub protein in aging.
Fig. 2Differentially expressed inflammatory proteins between healthy young and healthy elderly individuals. (A) Volcano map of differentially expressed proteins between healthy young and healthy elderly individuals. (B) Heatmap shows the top 30 differentially expressed proteins (p < 0.05) in healthy young individuals and healthy elderly individuals. (C, D The enrichment analysis results of GO and KEGG pathways are presented by bubble graphs. An adjusted p-value < 0.05 was considered significant. (E) PPI network. Node size indicates the number of proteins that interact with it. The green node represents downregulated proteins, and the red node represents upregulated proteins. Edge width indicates the strength of the interaction between the two proteins. (F) The node protein clusters with the highest scores were constructed by the MCODE plug-in in Cytoscape. (G) The top 15 hub proteins were constructed by cytoHubba. The figure shows the top 15 hub genes constructed by the MCC method. (H) The common hub proteins calculated by seven algorithms of plug-in cytoHubba and their coexpressed genes were analyzed via GeneMANIA. (I) Relative expression of common hub proteins in DEPs between healthy young individuals and healthy elderly individuals
Differentially expressed inflammatory proteins between healthy elderly individuals and elderly individuals with CMDsCompared with HE, CMDs presented significantly different expressions of 28 proteins. Among these, there were 26 upregulated proteins and 2 downregulated proteins (SCG3 and WFIKKN2) (Fig. 3A and B). To study the function of DEPs between HE and CMDs, the results of enrichment analysis indicated that the DEPs were enriched in positive regulation of phosphatidylinositol 3-kinase signaling of GO analysis (Fig. 3C) and IL-17 signaling pathway of KEGG pathway analysis (Fig. 3D). Through protein-protein interaction analysis between DEPs, the network was constructed and consisted of 13 nodes and 54 edges showing that TNF, IL1B, VEGFA, IL1RN, and MMP1 were closely connected with the other proteins (Fig. 3E). Module analysis was used to determine the key cluster in the network of DEPs between HE and CMDs. The functional module consisted of 6 nodes and 28 edges, including TNF, IL1RN, IL1B, MMP1, VEGFA and ANGPT1 (Fig. 3F). In addition, the top 10 hub proteins of the DEPs were analyzed by 7 algorithms, which are shown in Table S2 and Fig. 3G. The common hub proteins include TNF, IL1B, IL1RN, VEGFA, MMP1, IL18R1 and IRAK4. TNF, IL1B, IL1RN, VEGFA, and MMP1 exist in the cluster with the highest score as well. Accordingly, the above 5 proteins were deemed hub proteins in elderly individuals with CMDs, and the co-expression network and functions of these proteins were analyzed as shown in Fig. 3H. Further analysis showed the relative expression of hub proteins, and MMP1 was the most significant hub protein in CMDs (Fig. 3I).
Fig. 3Differentially expressed inflammatory proteins between healthy elderly individuals and elderly individuals with CMDs. (A) Volcano map of DEPs between healthy elderly individuals and elderly individuals with CMDs. (B) Heatmap shows the differentially expressed proteins (p < 0.05) in healthy elderly individuals and elderly individuals with CMDs. (C, D) The enrichment analysis results of GO and KEGG pathway analyses. An adjusted p-value < 0.05 was considered significant. (E) PPI network. Node size indicates the number of proteins that interact with it. Edge width indicates the strength of the interaction between the two proteins. (F) The node protein clusters with the highest score are constructed by the MCODE plug-in in Cytoscape. (G) The top 10 hub proteins were constructed by cytoHubba. The figure shows the top 10 hub genes constructed by the MCC method. (H) The common hub proteins calculated by seven algorithms of plug-in cytoHubba and their coexpressed genes were analyzed via GeneMANIA. (I) Box plot showing the relative expression of common hub proteins in DEPs between healthy elderly individuals and elderly individuals with CMDs
Common DEPs between normal aging and CMDsBased on the expression of inflammatory proteins, principal component analysis (PCA) indicated that there was the largest difference between HY and HE, but the separation between HE and CMDs was less pronounced (Fig. 4A). The Venn diagram showed that there were 10 overlapping proteins: PRDX5, NCF2, IRAK4, EGLN1, MVK, CXCL6, SHMT1, REG4, SLC39A5 and PTPN6 (Fig. 4B). The related functions of these DEPs are shown in Table S3. To verify the accuracy of overlapping proteins for the diagnosis of CMDs in aging, we performed ROC analysis. The results showed that these proteins had good diagnostic value for CMDs with AUCs > 0.7, which were 0.8, 0.7889, 0.7556, 0.7444, 0.8667, 0.8444, 0.7111, 0.8222, 0.8111 and 0.8222 for PRDX5, NCF2, IRAK4, EGLN1, MVK, CXCL6, SHMT1, REG4, SLC39A5 and PTPN6, respectively (Fig. 4C). We also determined the correlation between these DEPs and clinical traits and found that all overlapping proteins correlated with the level of HDL-C, TG, or FPG in plasma (Fig. 4D). These results suggested that the overlapping proteins have good predictive value for CMDs in aging. We further explored the relative expression of overlapping proteins and found that EGLN1, NCF2, REG4, and SLC39A2 significantly increased in both normal aging and aging with CMDs (Fig. 4E).
Fig. 4Common DEPs between normal aging and CMDs. (A) PCA. The first two primary components (PC1 and PC2) are plotted. (B) Venn diagram shows an overlap of differentially expressed proteins between healthy young individuals vs. healthy elderly individuals and healthy elderly individuals vs. elderly individuals with cardio-metabolic disorder. (C) ROC curve analysis of overlapping proteins. (D) Correlation between differentially expressed proteins and clinical traits in cardio-metabolic disorder. Each cell contains a correlation coefficient. *p < 0.05, **p < 0.01, ***p < 0.001. (E) Box plot showing the relative expression of overlapping proteins
留言 (0)