
記住我


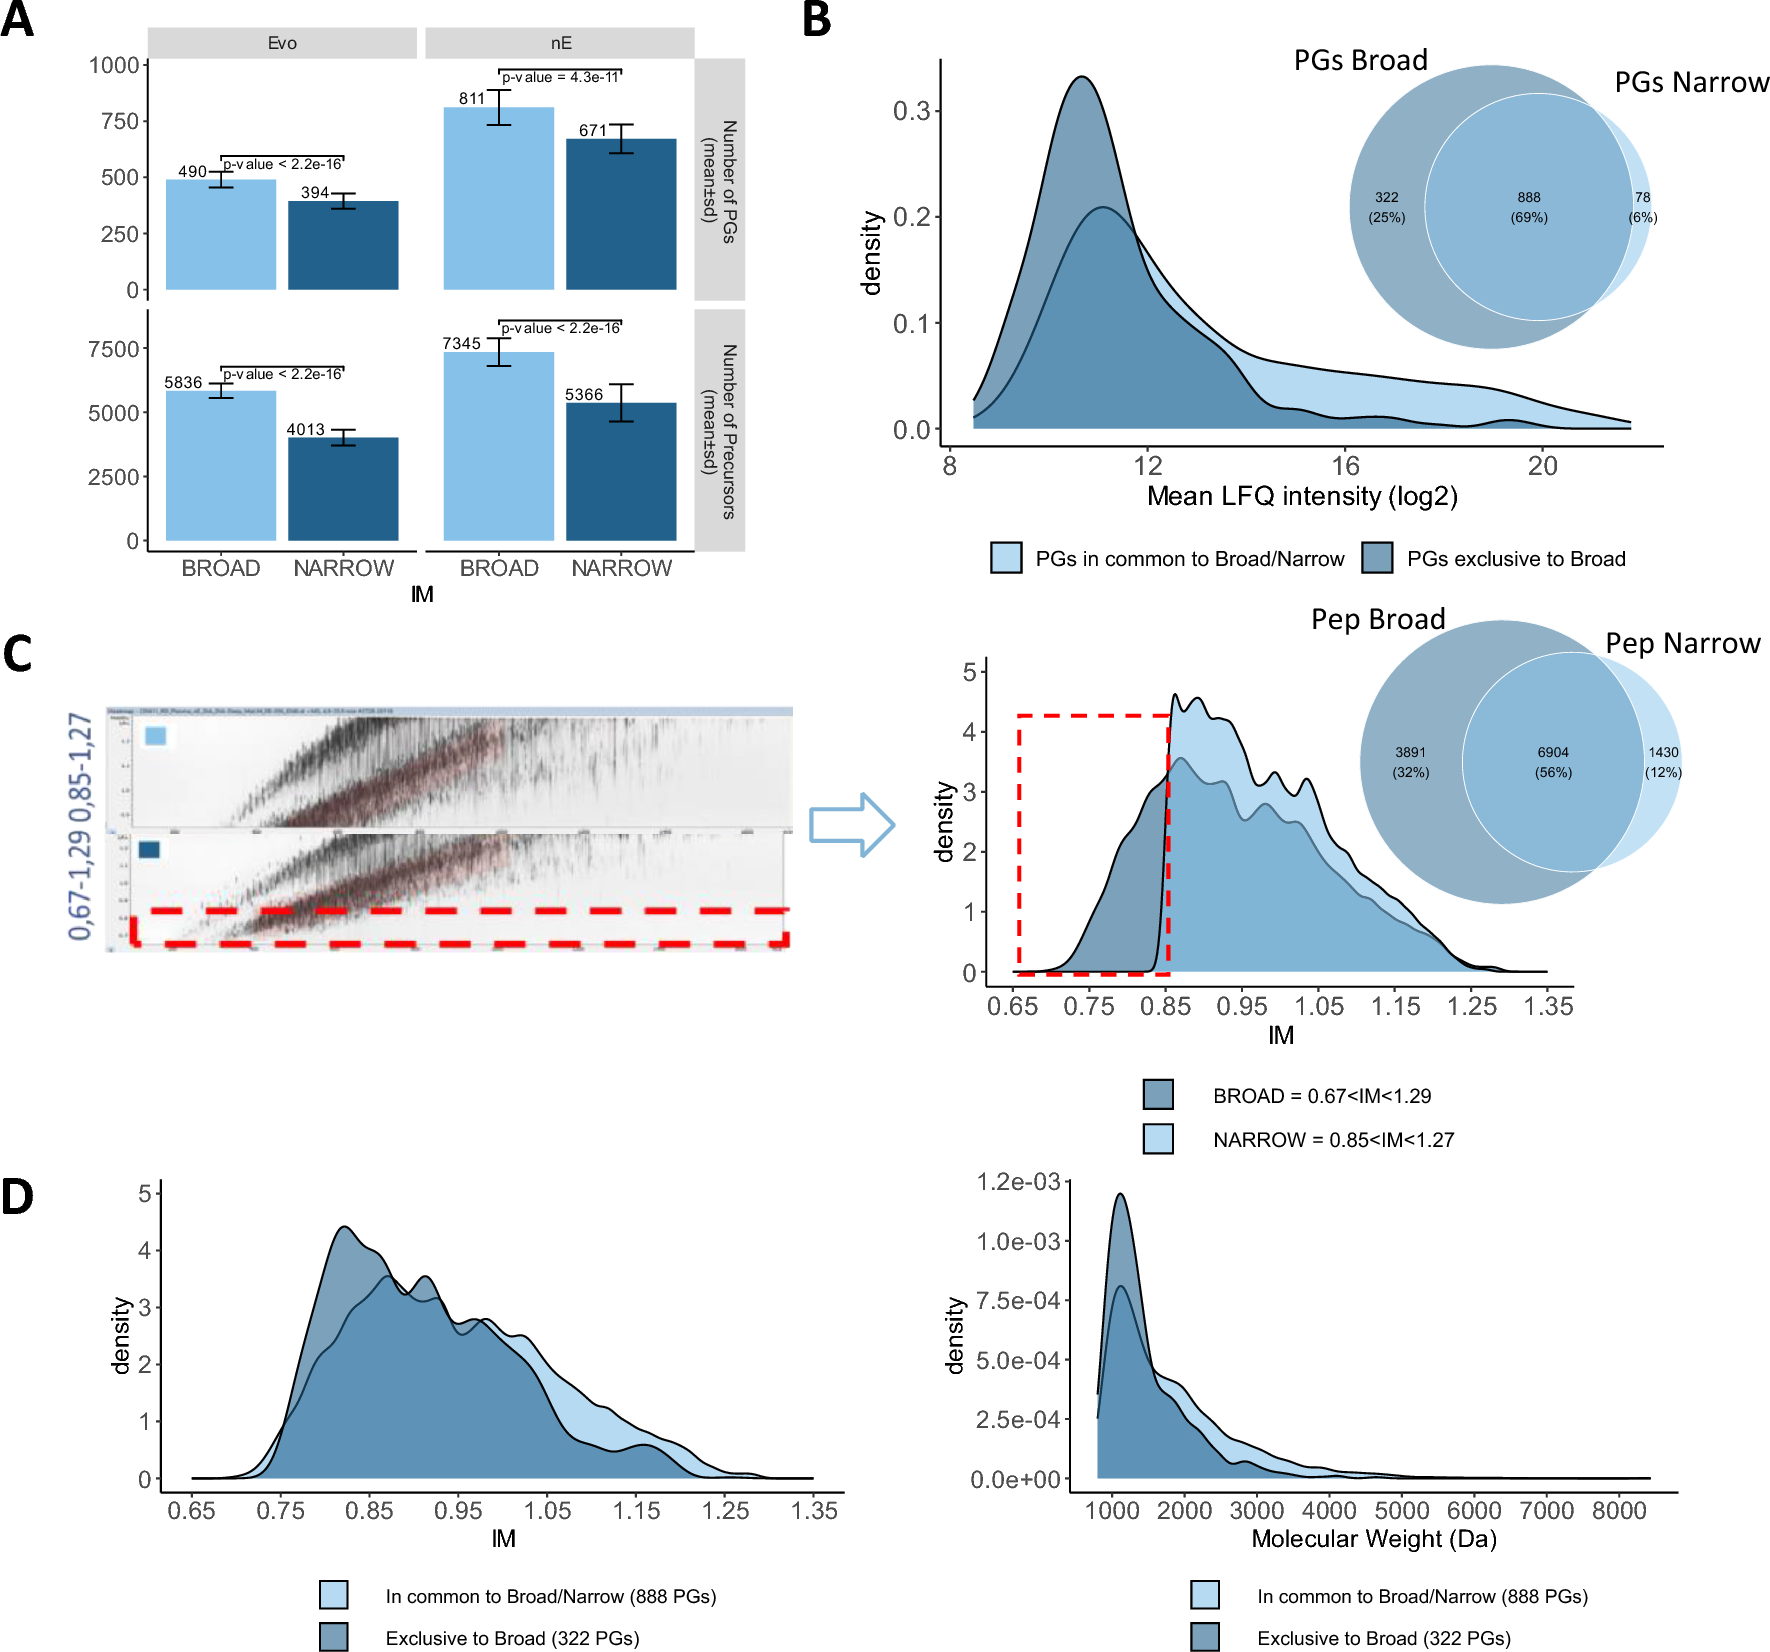

We tested two different dia-PASEF acquisition methods: one method with narrower ion mobility (IM) (1/K0 = 1.27 to 0.85 Vs cm-2) and one with broader ion mobility (1/K0 = 1.29 to 0.67 Vs cm-2). Mass range was also broadened from 475–1000 Da to 400–1027 Da. The “Broad” method allows to significantly identify 21% to 24% more proteins and 37% to 45% peptides on average (Fig. 1A), suggesting that the ions with low ion mobility, between 0.67 and 0.85 Vs cm-2, contain additional peptides valuable for lower abundance protein identification (Fig. 1B, 1C).
Fig. 1
Impact of dia-PASEF acquisition method optimization. A Number of identified protein groups and precursors across 33 neat plasma samples (mean ± standard deviation) using “Narrow” and “Broad” methods for nE and Evosep liquid chromatography systems. Welch Two Sample t-test are included for each comparison with respective p-value. B Venn diagram and mean LFQ intensity distribution of the protein groups relationships between “Narrow” and “Broad” methods. C Global ion map (left panel), ion mobility distribution of precursors from “Narrow” and “Broad” method and corresponding Venn Diagram of their respective precursors (right panel). D Ion mobility (left panel) and molecular weight (right panel) distribution of the peptides exclusively found in the “Broad” method and in common between “Broad” and “Narrow” methods
To corroborate this observation, we analyzed the distribution of ion mobility for the peptides attributed to the proteins identified with the “Broad” method (1,210 protein groups, 10,795 peptides in total respective matrices), with the “Narrow” method (966 protein groups, 8,334 modified sequences in total respective matrices) (Fig. 1C). We also compared the IM and MW distribution of the peptides identified in the “Broad” (3,891) to the distribution of the peptides found in common between the two methods (6,904) (Fig. 1D, Additional file for Fig. 1). We observe that peptides derived from the proteins (322) identified exclusively with the “Broad” method have a distribution of ion mobility and molecular weight shifted towards lower values. This proves that broadening of the ion mobility and mass range effectively contributes to increasing the number of PG IDs in neat plasma mixture by sampling additional peptides in the low mass range.
Based on these results, we decided to use the “Broad” acquisition method to continue the evaluations.
Impact of peptide RPLC separationWith the aim to reduce the overall run time, we compared different gradient lengths on the Evosep One 100 SPD (11 min gradient) and 60 SPD (21 min gradient) using an 8 cm Evosep column as well as on the nanoElute (12 and 30 min gradient) using a 25 cm emitter embedded IonOpticks column. Although a 25 cm column is not optimal for the 12 min gradient, we kept the same column for both methods, as it allowed us to evaluate the influence of the effective gradient length for plasma samples analysis on the nanoElute, independently of the analytical column. Given the overhead time due washing and equilibration, the effective throughput for these methods was 48 SPD and 24 SPD, respectively.
As shown in Fig. 2A, using the shorter gradients significantly reduces the number of proteins identified. The number of PG IDs using the 12 min gradient with the 25 cm column (average of 479 ± 44 PG IDs, 48 SPD) is comparable to the number of PG IDs obtained with the 60 SPD method (490 ± 35 PG IDs, 60 SPD) allowing a better throughput. Reducing the gradient even further to 11 min (100 SPD) led to 20% less in PG IDs for a 66% increase of throughput compared to 60 SPD. The set-up leading to a significant increase in PG IDs compared to all other settings tested, is the separation over 30 min gradient with the 25 cm column, allowing the identification of an average of 811 ± 78 PG IDs in 1 h global run time (24 SPD).
Fig. 2
Impact of peptide separation: column length and gradient influence. A Number of identified protein groups across 33 neat plasma samples (mean ± standard deviation) using “Broad” methods with different liquid chromatography setups (instruments, columns, gradients). B Venn diagram of the peptides relationship between: left panel: nE 24SPD (30 min gradient) and Evo 60 SPD (21 min gradient); right panel: nE 48SPD (12 min gradient) and nE 24SPD (30 min gradient). C Physico-chemical properties of peptides from the 3 Venn Diagram groups of B (left panel). D Physico-chemical properties of peptides from the 3 Venn Diagram groups of B (right panel)
In order to understand the nature of the additional peptides identified using a longer gradient on the nanoElute, we analyzed the physicochemical properties of the peptides exclusively identified by nanoElute 30 min gradient (10,206 peptides in total, of which 4,880 exclusive) compared to analysis of the same samples using shorter gradients 60 SPD (Evosep One, 6,328 peptides, 1,002 exclusive peptides) and 48 SPD (nanoElute, 5,861 peptides, of which 746 exclusive).
As reference, we used peptides identified in common for each comparison (5,326 and 5,115 peptides respectively for 60 SPD Evosep One and 48 SPD nanoElute) (Fig. 2B and C), (Additional file 3: Fig. S1 for all properties).
We observe that peptides exclusively identified using longer gradient, with a mild initial gradient, were higher in average number of polar and charged amino acids while 60 SPD and 48 SPD exclusive peptides have lower average number of basic AA (K, R, H), suggesting that this analysis favors the detection of shorter peptides. To corroborate this observation, we compared the average MW and hydrophobicity of the peptides and we found they were both higher in 60 SPD and 48 SPD specific peptides compared to peptides in common and even more compared to 24 SPD peptides (Fig. 2C and D, Additional file 4: for Fig.S2).
To understand if the loss of peptides is linked to the use of the precolumn on the Evosep, we performed off-line elution on the Evotip. Our data provides evidence that the use of Evotips exerts negligible impact on the number of peptides and proteins identified and is not the main source of the loss of hydrophilic peptides in the analysis (Additional file 3: Fig. S1).
These data suggest that both the standard Evosep One 60 SPD and the default 48 SPD analysis using 25 cm analytical columns do not favor the detection of hydrophilic peptides which are crucial to additional protein identifications. Separating the peptides on Evosep One using a 15 cm columns and a longer active gradient of 31 min still did not improve the results (standard Evosep 40 SPD whisper method), (Fig. 2A).
Impact of the data search strategyWe further evaluated the impact of Match Between Run (MBR) on the depth of the analysis. For this, we employed DIA-NN in library free mode, with or without Match Between Run (MBR). We observed an increase of PG IDs as more sample files are searched at the same time, in particular when MBR was allowed (Fig. 3A). This phenomenon is expected, but it is significantly accentuated in plasma samples compared to patients’ tissue samples: searching 33 plasma sample files together allowing MBR, led to an increase of PG IDs by 40%, whereas using 30 brain lysate sample files, lead to an increment of only 14% (Fig. 3B).
Fig. 3
Impact of data search strategy. A Number of identified protein groups across 1, 4, 10 and 33 neat plasma samples (mean ± standard deviation) analyzed with DIA-NN v1.8.1 library-free search strategy with and without Match Between Runs (MBR). B Number of identified protein groups across 30 brain biopsy compared with 33 neat plasma (DIA-NN v1.8.1 with MBR). C Number of identified protein groups across 10 injections of different neat plasma (biological variability) and 10 injections of same plasma (technical variability) (mean ± standard deviation) in DDA and DIA acquisition modes (Evo-TTP) and analyzed with DIA-NN v1.8.1 library-free search strategy (with MBR) and Maxquant v2.3.0.0 (with MBR). D Coefficient of variation distribution calculated from LFQ raw intensities (non log transformed) across 10 injections of different neat plasma (biological variability) and 10 injections of same plasma (technical variability) in DDA and DIA acquisition modes and analyzed with DIA-NN v1.8.1 library-free search strategy (with MBR) and Maxquant Maxquant v2.3.0.0 (with MBR)
The MBR concept is based on on-the-fly creation of a spectral library from the DIA experiment, with subsequent highly sensitive re-search of all the samples using this library. The main benefits of MBR manifest in experiments with samples heterogeneous in sample loading, with information obtained from acquisitions where a peptide is confidently identified being used to boost its detection in other acquisitions, improving proteomic depth and data completeness [22, 24, 25]. In order to quantify the interpersonal proteome variability in blood plasma, we measured 10 plasma samples from 10 individuals both in DIA and DDA mode, and compared it to 10 runs of the same plasma (technical replicates). In DIA mode, we observe a median CV of 37% across all proteins in biological replicates as opposed to 6% in technical replicates (10 runs of the same plasma). Results obtained using DDA acquisition showed very similar results with CVs of 46% and 6% respectively (Fig. 3C and D, Additional file 5: Fig. S3 for Fig. 3). These results are in line with observations previously made on different LC–MS systems as well [26]. This confirms that the interpersonal variability in plasma protein abundance is very high across different individuals and we suggest that it may be the main contributing factor to the positive effect of MBR using a library-free approach.
Plasma sample contamination from blood cells can lead to an increased number of proteins ID because of the identification of additional proteins derived from platelets. This will depend on the protocol of collection, and it could typically happen when platelet rich plasma (PRP) is used. We verified that the average number of proteins was the same whether we used PRP samples or platelet poor plasma (PPP), and that the level of known contaminants was similar. This contamination was measured according to http://plasmaproteomeprofiling.com/, which provides a ratio between typical contaminants and plasma proteins [15]. Only three samples contained a high contamination ratio (sample N3, N4, N9) and uniquely for sample N3 the contamination with red blood cells (RBC) correlated with a higher number of protein IDs (Additional file 4: Figure S2).
Plasmatic extracellular vesicles as a repertoire of plasma proteinsExtracellular vesicles (EV) are secreted by all cell types and are found in biofluids. In plasma, they are mainly derived from plasma cells. EV contain biological material from the generating cells, including intracellular proteins and plasma proteins on their surface [12, 27,28,29]. EVs are therefore a biological fraction of the neat plasma rich in information.
To compare the proteome of the EV fraction with the total plasma proteome, we prepared the EV fraction through multiple centrifugation steps, as previously described [20, 21]. We also processed neat plasma from the same samples. An average of 4,487 proteins could be identified in the EV fractions from plasma obtained from five different individuals, compared to an average of 744 proteins when the same samples were analyzed as neat (Fig. 4A, Additional file for Fig. 4).
Fig. 4
Plasmatic extracellular vesicles as a repertoire of plasma proteins; A Number of identified protein groups in 5 neat plasma samples and in 5 EVs purified from the same plasma samples. B Known EV markers uniquely identified in EV fractions or enriched in them. C Venn diagram of the protein groups relationship between protein groups identified in neat plasma and EV fractions. D Correlation plot between mean LFQ intensity of proteins exclusively found in plasma (light green) or in EV fraction (orange) or in common in both (gradient color from blue to red according to number of identified peptides)
Most of the known EV markers could be identified uniquely or were strongly enriched in the EV fractions (Fig. 4B). Interestingly, 90% of the proteins identified in the neat plasma analysis were also identified in the EV fractions (Fig. 4C). A correlation plot of the intensity of the proteins found in both fractions shows a good correlation of their abundance. In particular, there is a subset that is highly correlated and a subset of proteins that are enriched in the EV fraction (Fig. 4D).
These data imply that proteins identified in the plasmatic EV fraction include core EV proteins and soluble proteins associated with the EV, and that they may constitute a rich repertoire of plasmatic proteins.
Plasmatic extracellular vesicles as a reference in the neat plasma searchGiven the positive impact of Match Between Runs (MBR) in the direct neat plasma searches, we explored the feasibility of extending the MBR to EV files using DIA-NN. Instead of building a peptide library, we integrated raw files from EV samples alongside the files from neat plasma samples. We enabled MBR and conducted a library-free search. In this manner, MBR was allowed within the neat plasma samples, as shown above (refer to Fig. 3), and also between neat plasma files and EV files. We refer to this search approach as the ‘EV-boost search’.
Using MBR amongst sample of different nature, such as neat plasma and plasma EVs raises reasonable questions on the false discovery rate control. We assessed the EV-boost search using DIA-NN. We evaluated the number of identified proteins reported in the protein group output table and the number of proteins obtained applying various filters of global and run-specific precursor/protein q-values to the main peptide table (see Materials and method section).
Without EV-boost search, we observed a median PG IDs of 804 across all 33 neat plasma files using the protein group table (Fig. 5A, black edge, red background), very similarly to report matrix with an additional filter set at 5% on the run-specific q-value for the protein group (median PG IDs at 794) (Fig. 5A, black edge, dark blue background). We applied the same stringencies to EV-boost search in order to have confident IDs using MBR with very different sample types (plasma and EVs). With EV-boost search, we observe a median PG IDs of 1,095 across all 33 neat plasma files using the protein groups table(Fig. 5A, gray edge, red background) and a median PG IDs at 1,092 using the report matrix with run-specific q-value for the protein group set at 5%. These data indicate that the EV boost search allows an increase of 38% in terms of median PG IDs (794 to 1,092) (with run-specific protein q-values at FDR 5%).
Fig. 5
Plasmatic extracellular vesicles as a reference in the neat plasma search. A Distribution of identified protein groups across 33 neat plasma with and without EV boost search. For each analysis, different filters were applied in DIA-NN 1.8.2 beta27, particularly when EV boost search was applied in order to assess confidence in identification. B Density plots of plasma proteins identified in at least 1 neat plasma sample (3035 over 5030 PGs in total matrix) when EV boost search is applied and analyzed with DIA-NN 1.8.2 beta27. C In grey are represented the distribution of the plasma proteins found without EV boost and in red are represented the distribution of the newly identified proteins (1841) thanks to EV boost
We investigated the distribution of the proteins identified in the neat plasma files and highlighted the additional proteins ID distribution obtained using the EV-boost in red (Fig. 5C). Proteins identified uniquely by EV-Boost show a global distribution shifted toward lower abundances.
留言 (0)