
記住我


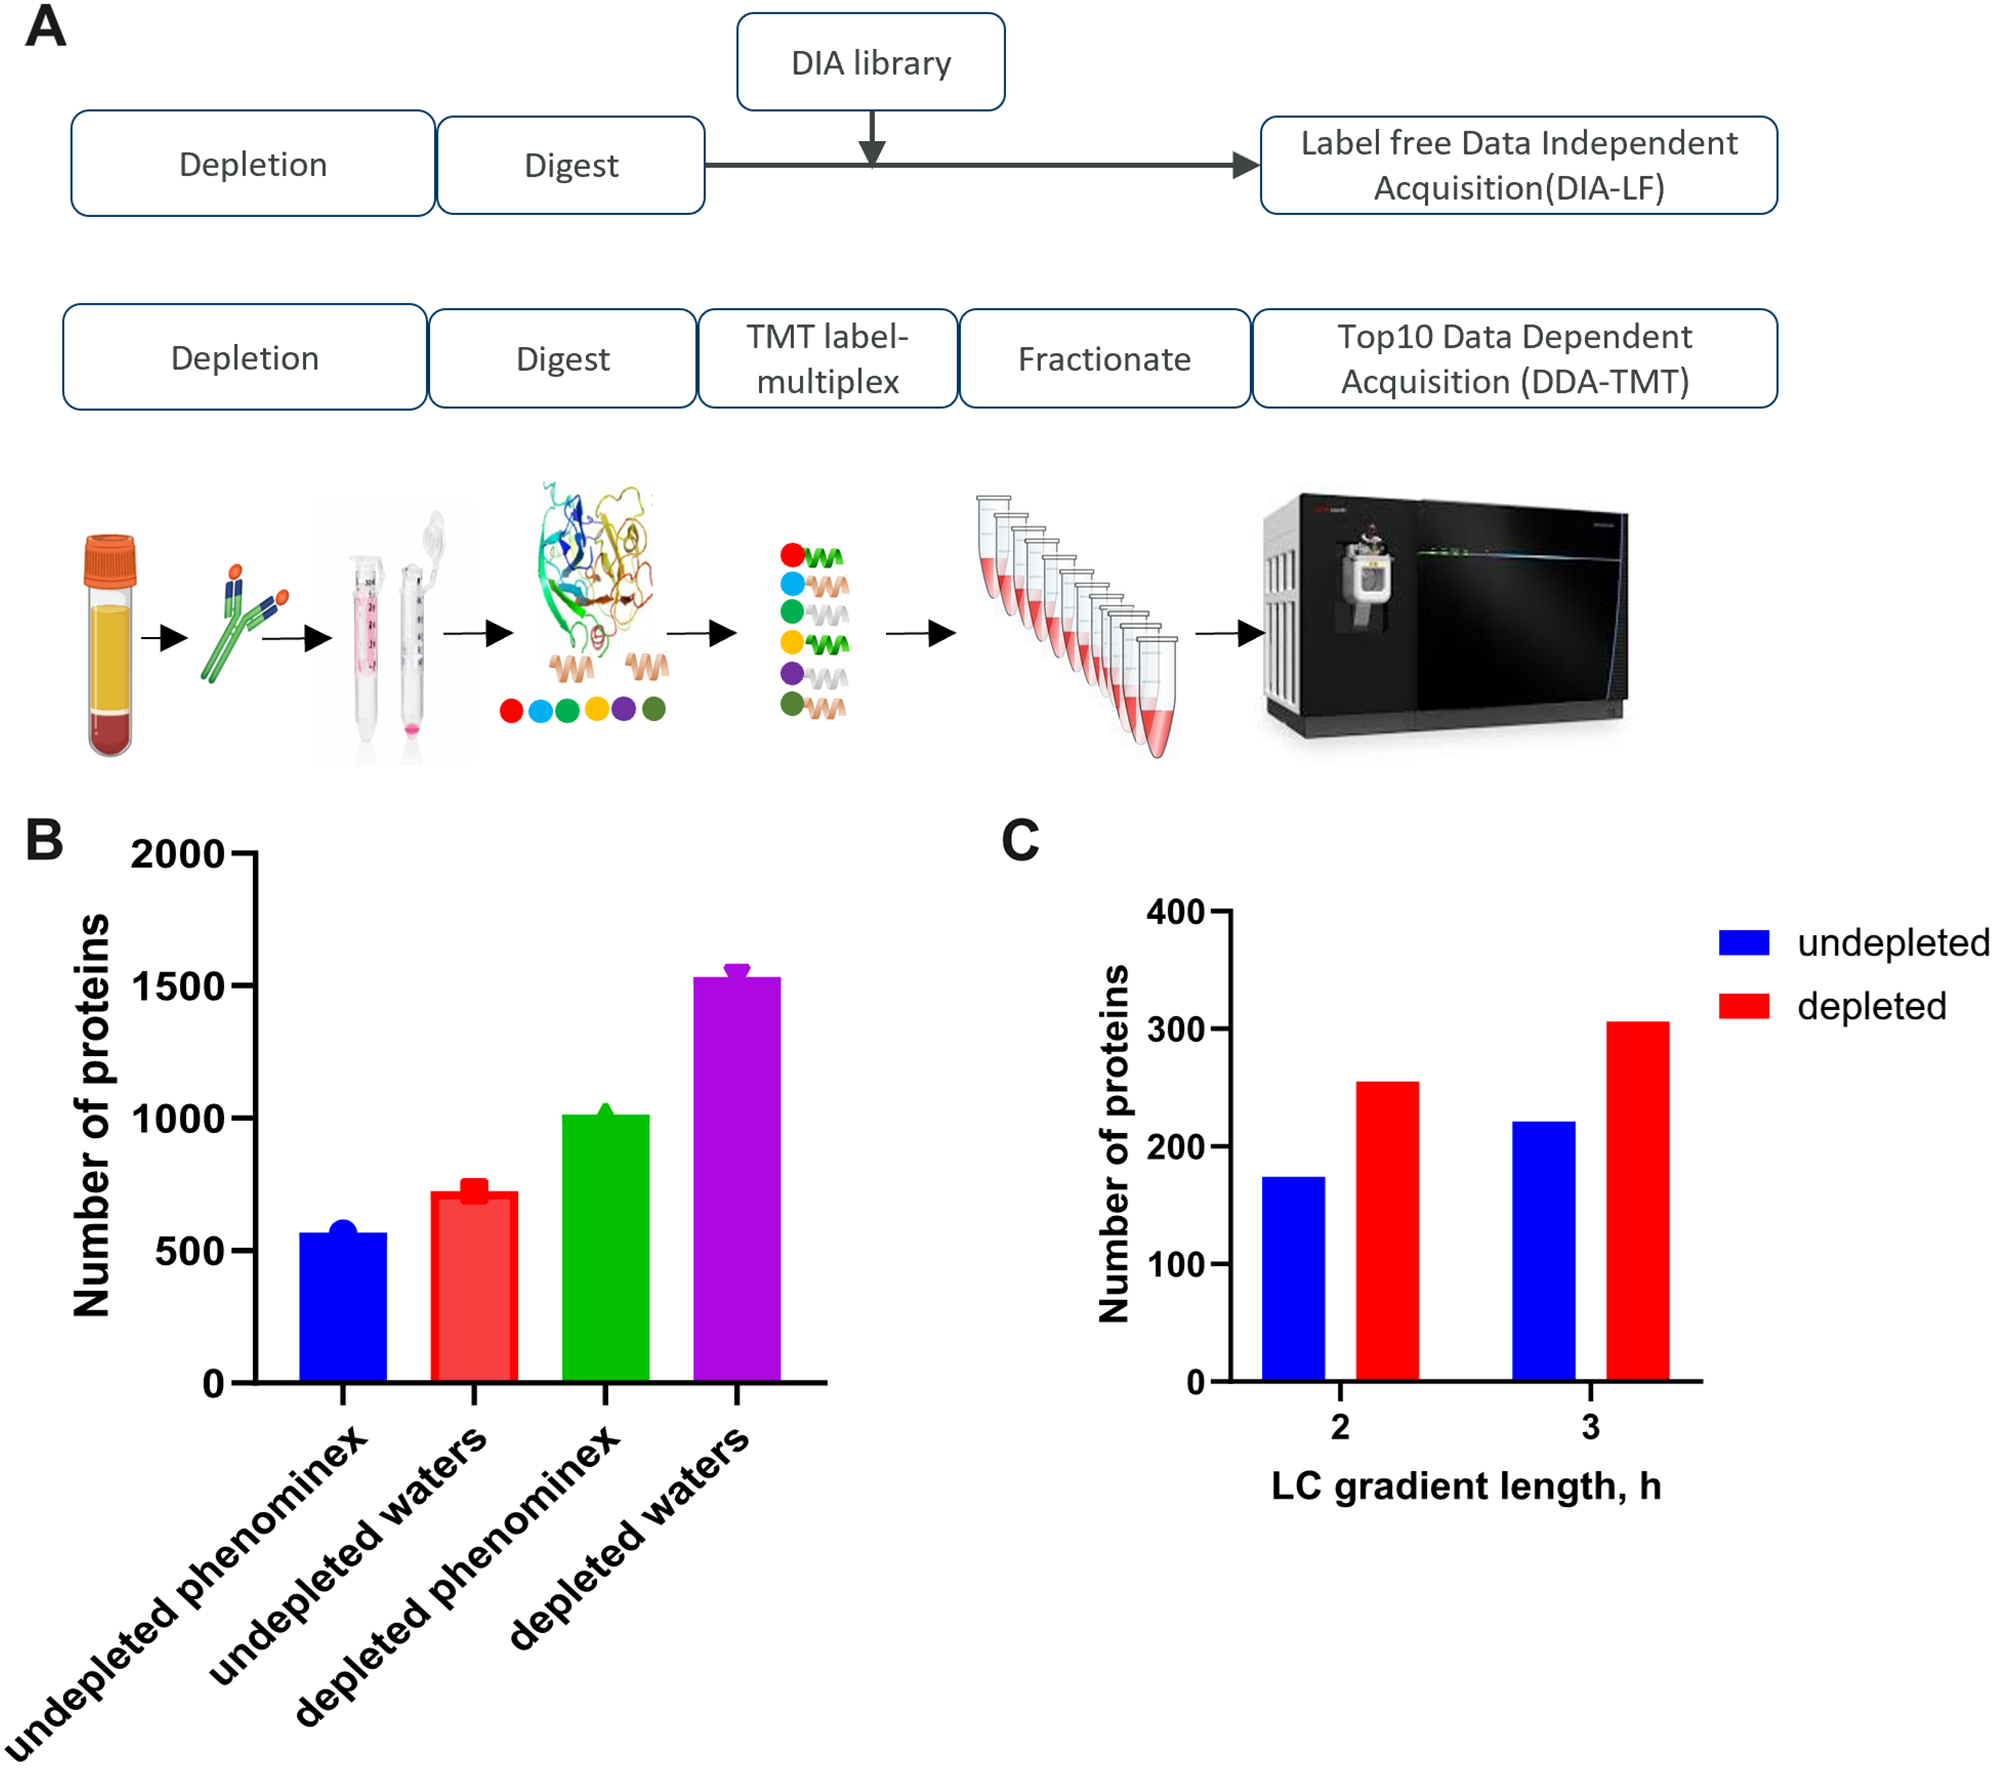

We established and characterized two proteomics workflows to quantify disease-relevant blood proteins. For this purpose, we used commercially acquired serum and plasma samples from subjects with PCa and healthy individuals. We chose to generate and compare proteomics data in two modes: low-throughput labelled (DDA-TMT) and higher-throughput label free (DIA-LF) (Fig. 1A). The low-throughput workflow involved sample labelling with tandem mass tags, offline fractionation and differential ion mobility (FAIMS) with real-time MS3 search on the Orbitrap Eclipse. The higher throughput workflow employed label free sample preparation with no fractionation and data independent BoxCar acquisition strategy on the Orbitrap Exploris 480. We applied the approach to discover proteins that are differentially expressed in subjects with PCa and could therefore represent blood-based disease biomarkers.
To process the biofluids, we tested PreOmics and EasyPep sample preparation kits in workflows including abundant protein depletion (antibody based top14 depletion) or without the depletion step. The depletion step reduced sample complexity and increased protein identification rates by \(\sim\) 80%. The two commercial kits tested showed similar performance as assessed by number of identified peptides and digestion efficiency (between 5-8% missed cleavage rate). We further tested performance of peptide separation using Waters versus Phenomenex columns of comparable length but varied particle size. We observed 28% increase in the number of proteins identified in undepleted plasma and a 51% increase in the number of proteins identified in depleted plasma using optimized gradient with the Waters column (Fig. 1B). Additionally, increasing the LC-gradient length, from 120 to 180 min, resulted in \(\sim\) 20% improvement in number of protein identifications (Fig. 1C).
Ultimately our best optimised method started with 70uL of biofluid that allowed extraction of 100 ug of protein. The DDA-TMT workflow allowed deep proteome coverage, albeit with a lower throughput. We estimate 16 samples could be processed per day with 60 h of acquisition time. The DIA-LF was significantly higher throughput (16 samples prep per day, 2 h acquisition per sample) but yielded roughly 50% lower coverage.
Fig. 1
Optimized workflow for global deep profiling of plasma and serum (A) Overview of blood-based proteomics workflows for biomarker discovery (B) and (C) Key method development metrics for the DDA-TMT workflow
Application of differential ion mobility (FAIMS) improves PSM identification ratesWe optimized the collision energies and fit-filter to select the optimal parameters for peptide fragmentation of TMT10 and TMTpro 16 Plexes as well as fit-filter for least Peptide-Spectrum Matche (PSM) interference for the Data Dependent Acquisition (DDA-TMT) workflow (Fig. 2). Fit filter is a method used to select precursor ions with a defined precursor specificity. It does so by comparing the observed isotopic envelope (the distribution of isotopes for a given ion) to a theoretical isotopic envelope. The normalized similarity between these envelopes must meet a user-defined fit threshold to trigger a new MS2 scan. In this experiment, four different thresholds were tested. As shown in Fig. 2A and B, we observed that collision energy (CE) of 36% was ideal with maximum PSMs for TMT10 labeled plasma while CE of 32% was ideal with maximum PSMs for TMTpro 16 Plex labeled plasma. At CE of 36%, we varied the fit-filter values as shown in Fig. 2C and observed a drop in PSM % interference from 15 to 8% for TMT10 at a fit-filter value of 80 and at CE 32% and fit-filter 80 observed a drop in % PSM interference from 16 to 8%, which was used as the optimal value in the downstream experiments.
Fig. 2
FAIMS parameters optimization. (A) and (B) effect of varying the collision energy (CE) on Peptide-Spectrum Matches (PSM). CE is adjusted to control the extent of fragmentation or dissociation of the ions. By increasing or decreasing the collision energy as a percentage of the maximum, one can influence the type and extent of fragmentation that occurs. (C) effect of varying the fit filter settings on PSM identification rates. Fit filter is a method used to select precursor ions with a defined precursor specificity. It does so by comparing the observed isotopic envelope (the distribution of isotopes for a given ion) to a theoretical isotopic envelope
Characterization of plasma and serum proteomeUsing our optimised workflows, we acquired data from 16 serum and 16 plasma PCa patient samples and matching number of healthy volunteers (32 samples total). Due to limitations of TMT tagging this portion of the study included only 15 biosamples. In total, 2939 proteins were identified at least once across all samples (Fig. 3A). On average, 817 and 987 proteins were detected per sample in plasma and serum with DIA-LF. Using DDA-TMT 1589 and 1527 were detected in plasma and serum respectively. A core proteome quantified across all samples consisted of 807 proteins. (Fig. 3A). We assessed the dynamic range of the quantified proteome by plotting the average MS intensity versus the estimated blood concentrations reported in Human Protein Atlas [23] (Fig. 3B). As expected, the measured MS intensity did not correlate well with absolute abundance, particularly for the lowest abundant proteins. The DDA-TMT workflow was able to quantify proteins with abundances below 10 ng/L. In this range some of the lowest abundance proteins were Utrophin estimated at 4.2 ng/L or Interleukin 16 at 7.3 ng/L. The core proteome, which was reproducibly detected across both workflows, however, had a much lower dynamic range and required the protein to have a minimum concentration in the 100s ng/L range. For example, EIF4B at 340 ng/L or GRB2 at 400 ng/L were the lowest detected.
Fig. 3
(A) Upset plot showing overlap of identified proteins in serum and plasma samples in both DIA-LF and DDA-TMT mode. 807 proteins were overlapping between all samples, while 441 were detected in only DDA-TMT workflow. (B) Plot showing the dynamic range of the detectable proteome. Average protein intensity (x-axis) versus estimated concentration in blood according to Human Protein Atlas [23]. Core proteome identified in all the samples is highlighted with “X”
Differential expression analysis between healthy and PCa samplesWe performed pairwise comparisons between healthy and PCa disease samples using limma package [24]. To control for confounders and ensure the protein expression changes we determine are specifically associated with PCa rather than age or weight-related factors, we included age and Body Mass Index (BMI) as covariates in the limma regression model. All other clinical features were closely matched between the PCa and healthy samples (see Supplementary File 1 containing all sample metadata). False discovery rate (FDR) was controlled using Benjamini-Hochberg correction and we required differentially expressed proteins (DEPs) to have an FDR p.value < 0.05. The full list of proteins and their differential expression values are available in Supplementary File 2 (Supplementary_File_2_all.data.xlsx).
In plasma DDA-TMT, 14 proteins were down-regulated and 20 up-regulated, while in plasma DIA-LF, 10 were down and 4 up-regulated. For the 5 DEPs called by both workflows, we saw a very good correlation between their fold changes (R = 0.97, p-value = 0.004) (Fig. 4A).
LTA4H (P09960) was downregulated in PCa patient’s plasma with the greatest statistical confidence using both workflows and with at least 2-fold change. Other proteins apparently downregulated in PCa plasma were IGHM, ITLN1 and LILRA3. Among the up-regulated proteins, COG4 was identified by both workflows.
Examining serum results, a much greater numbers of differentially expressed proteins, compared to plasma, was observed. Serum DDA-TMT workflow identified 105 down-regulated and 56 up-regulated proteins. While DIA-LF results showed 141 and 38 DEPs that were down and up-regulated, respectively. From gene set enrichment analysis, the most statistically confident gene ontology terms suggested downregulation of cytoskeletal protein binding. Comparing the effect size determined in serum DDA and DIA experiments, showed a correlation of R = 0.93, p-value < 2.2e-16 for the 58 DEPs overlapping in both workflows (Fig. 4B).
Prostate-specific antigen (PSA, UniProt id P07288, gene name KLK3) was the most significant “hit” with 7.5-fold increase in PCa serum (DDA-TMT data, FDR p.value = 5.4 e-05). PSA was however not detected as significantly changing in DIA-LF plasma samples and it was not possible to calculate p-value and fold change in the DIA-LF serum due to missing values.
Interestingly, pregnancy zone protein (PZP, FC \(\sim\) 11, FDR p.value = 2.3e-10) was also upregulated in PCa serum. PZP is predicted to be secreted to blood and is also known to be highly expressed in late-pregnancy serum. Many more proteins were reproducibly identified as downregulated in PCa serum. Notably, IGHM, COLT1 and TAGLN2.
Fig. 4
Correlation of the calculated PCa vs. healthy blood expression changes between DDA-TMT and DIA-LF workflows in (A) plasma and (B) serum. Triangles correspond to DEPs (FDR-adjusted p-values < 0.05) identified in only DDA-TMT workflow, squares to DEPs identified in only DIA-LF workflow and diamonds to DEPs identified by both workflows. Effect size is the log2 fold-change (FC) of PCa/healthy. Names of the most confidently called proteins by both workflows are highlighted
Comparison of serum vs. plasma profiles and their utility for biomarker discoveryPlasma and serum are both components of blood but differ in their composition due to the presence or absence of clotting factors. We queried the blood coagulation pathway from the PANTHER Pathways dataset (https://maayanlab.cloud/Harmonizome/gene_set/Blood+coagulation/PANTHER+Pathways) and were able to identify 33 out of the 39 participating proteins in both sample types. Interestingly, six of the blood coagulation components (PROC, APP, ITGB3, PROS1, GP1BA, ITGA2B) showed differential expression patterns in serum (control vs. PCa comparisons) while none were detected as changing in plasma. Since serum is formed by allowing blood to clot naturally, leaving behind a fibrin clot, and containing components released during clotting (e.g., clotting factors), it is possible some of the detected changes are due to those processes and could confound detection of biomarker signatures in serum samples.
To assess the feasibility of detecting differential signatures in either biofluid, we performed sample size and power calculations using an in-house omics signatures analysis application. This tool considers the number of features, groups, samples per group, log2 standard deviation of measurements, desired true log2-fold change, and expected number of detectable features at a specified false discovery rate. We achieved very similar power to detect differential expression in both matrices (Fig. 5A and B). This was also consistent for DIA and DDA datasets, albeit DDA data suffered much reduced power overall. For example, using the median standard deviation of all proteins in each matrix, we achieved 90% power (power = 0.9) to detect a fold change of 2 with n = 14 samples per group in plasma DDA-TMT data, and the same fold change required n = 15 in serum DDA-TMT data (Fig. 5A and B). While the differences are small, it appears lower sample sizes are needed to achieve desired statistical power in our plasma samples.
Fig. 5
Power curves for detecting a true log2 fold change with varying sample sizes in (A) plasma DDA-TMT data and (B) serum DDA-TMT data. Each curve represents the statistical power to detect a true difference as a function of log2 fold change for different sample sizes ranging from 11 to 16. The dashed horizontal line represents a 90% power threshold, which is the desired level of power to detect a difference if it truly exists
Prioritising potential markers due to secretion into bloodNumerous proteins are actively secreted by cells in response to diseases or external stimuli, making them valuable candidates for potential biomarkers. Changes in the abundance of such proteins that translocate to the bloodstream can provide real-time insights into the cell’s state and particularly disease progression. To effectively prioritize the numerous differentially expressed proteins we identified in patients with PCa, we set out to determine which of these proteins are actively secreted into the human bloodstream. These are proteins that are deliberately released or secreted into the bloodstream, rather than merely present due to cell death or other disease-related factors.
In pursuit of this, we cross-referenced our list of DEPs with the human secretome catalogue defined by the Human Protein Atlas (HPA) [25, 26].
The Human Protein Atlas is regularly updated, and at the time of our study, it featured predictions for 729 proteins actively translocating to peripheral blood. Notably, we discovered that 57 of the DEPs (quantified with FDR p-values < 0.05 in at least one of the four experiments) are actively secreted into the blood.
Intriguingly, four actively secreted proteins (APOA4, APOB, APOC4, PZP) exhibited significant changes in both serum and plasma of PCa patients and were identified in at least three proteomic datasets. In addition to PSA, FAM3B was the only other differentially regulated protein in our data (log2FC = -1.4, FDR p.value = 0.02 in Serum.DDA.TMT) that was both actively secreted and with RNA specific expression in prostate cancer (40.3 FPKM according to HPA).
留言 (0)