Study sample
Patients with ACP or RCC who underwent surgery at Sanbo Brain Hospital, Capital Medical University, Beijing, China and received pathological confirmation of ACP or RCC were enrolled in this study. None of the participants received radiotherapy, chemotherapy, or any other form of antitumour therapy before surgery. Informed consent was obtained from all participants or their parents or legal guardians. The study was approved by the Institutional Review Board of Sanbo Brain Hospital (approval nos. SBNK-YJ-2022-010-01, SBNK-YJ-2023-006-01). All methods were performed in accordance with the guidelines of the Institutional Review Board of Sanbo Brain Hospital and the Declaration of Helsinki. All patients’ information can be found in supplementary table S1.
Formalin-fixed and paraffin-embedded sample preparation
Add 20 µL of extraction solution (containing 10mM Tris, 0.8mM EDTA, and 0.2% Zwittergent 3–16) on the section, scrape off the paraffin-embedded tissue with a knife and collect it directly into a 1.5 mL centrifuge tube. The FFPE sample was deparaffinized at 100 °C for 20 min. Then, the sample was reduced with 20 mM dithiothreitol (DTT) for 2 h at 60 °C with sonication, alkylated with 55 mM iodoacetamide (IAM) for 45 min at room temperature (24–27 °C) in the dark, and loaded onto a 30 kD filter, and centrifuged at 14,000 g for 20 min. The protein samples on the filter were washed five times with 20 mM Tris solution. The protein samples on the filter were digested with trypsin (1:50) at 37 °C overnight, and the peptides were collected by centrifugation after enzymatic digestion.
Liquid chromatography with tandem mass spectrometry
Orbitrap Exploris 480 (Thermo Scientific, USA) coupled with the Ultimate 3000 (Thermo Scientific, USA) was used for analysis in the data-independent acquisition-mass spectrometry (DIA-MS) mode. The digested peptides were separated on an RP monolithic capillary LC column (75 μm×500 mm; Uritech, Beijing, China). The eluted gradient was 5–30% buffer B2 (0.1% formic acid, 99.9% acetonitrile; flow rate: 1.5 µL/min), and peptides were eluted for 25 min.
For DIA analysis, a variable isolation window with 60 windows was employed for MS acquisition. According to the precursor m/z distribution of the pooled sample, the precursor ion number was equalized in each isolation window. The full scan range was set from 350 to 1200 m/z and screened at a resolution of 120,000, followed by DIA scans with a resolution of 30,000 (higher-energy C-trap dissociation [HCD] collision energy: 30%; AGC target: 200%; maximum injection time: 50 ms).
Data processing
The raw DIA data were analyzed by Spectronaut Pulsar 17.1 (Biognosys, Zurich, Switzerland) with default settings. In brief, the retention time prediction type was set to dynamic iRT. Interference correction on the MS2 level was enabled. Peptide intensity was calculated by summing the peak areas of their respective fragment ions for MS2, and the protein intensity was calculated by summing the intensity of their respective peptides. Cross-run normalization was enabled to correct for systematic variance in the LC-MS/MS performance, and a local normalization strategy was used. The normalization was based on the assumption that on average, a similar number of peptides was up-regulated and down-regulated, and the majority of the peptides within the sample were not regulated across runs or during the retention time. Protein inference was performed with the ID picker algorithm implemented in Spectronaut. All results were filtered by a Q value cutoff of 0.01 (corresponding to an FDR of 1%).
Differentially expressed proteins
Differential protein expression levels among primary ACP, recurrent ACP, and RCC were estimated using a two-tailed t-test with Microsoft Office Excel 2019 (Microsoft Corp, Redmond, WA, USA). Proteins were considered differentially expressed if the P-value was < 0.05 and the fold change was > 2.
Bioinformatics analyses
Analyses of differentially expressed proteins (DEPs) in primary ACP, recurrent ACP, and RCC were performed using the Metascape bioinformatics tool (https://metascape.org/gp/index.html#/main/step1, v3.5.20230501) [14], wherein R/P represents recurrent versus primary ACP, P/RCC represents primary ACP versus RCC, and R/RCC represents recurrent ACP versus RCC. Pathway and process enrichment analyses have been carried out with default settings.
Hub node clustering
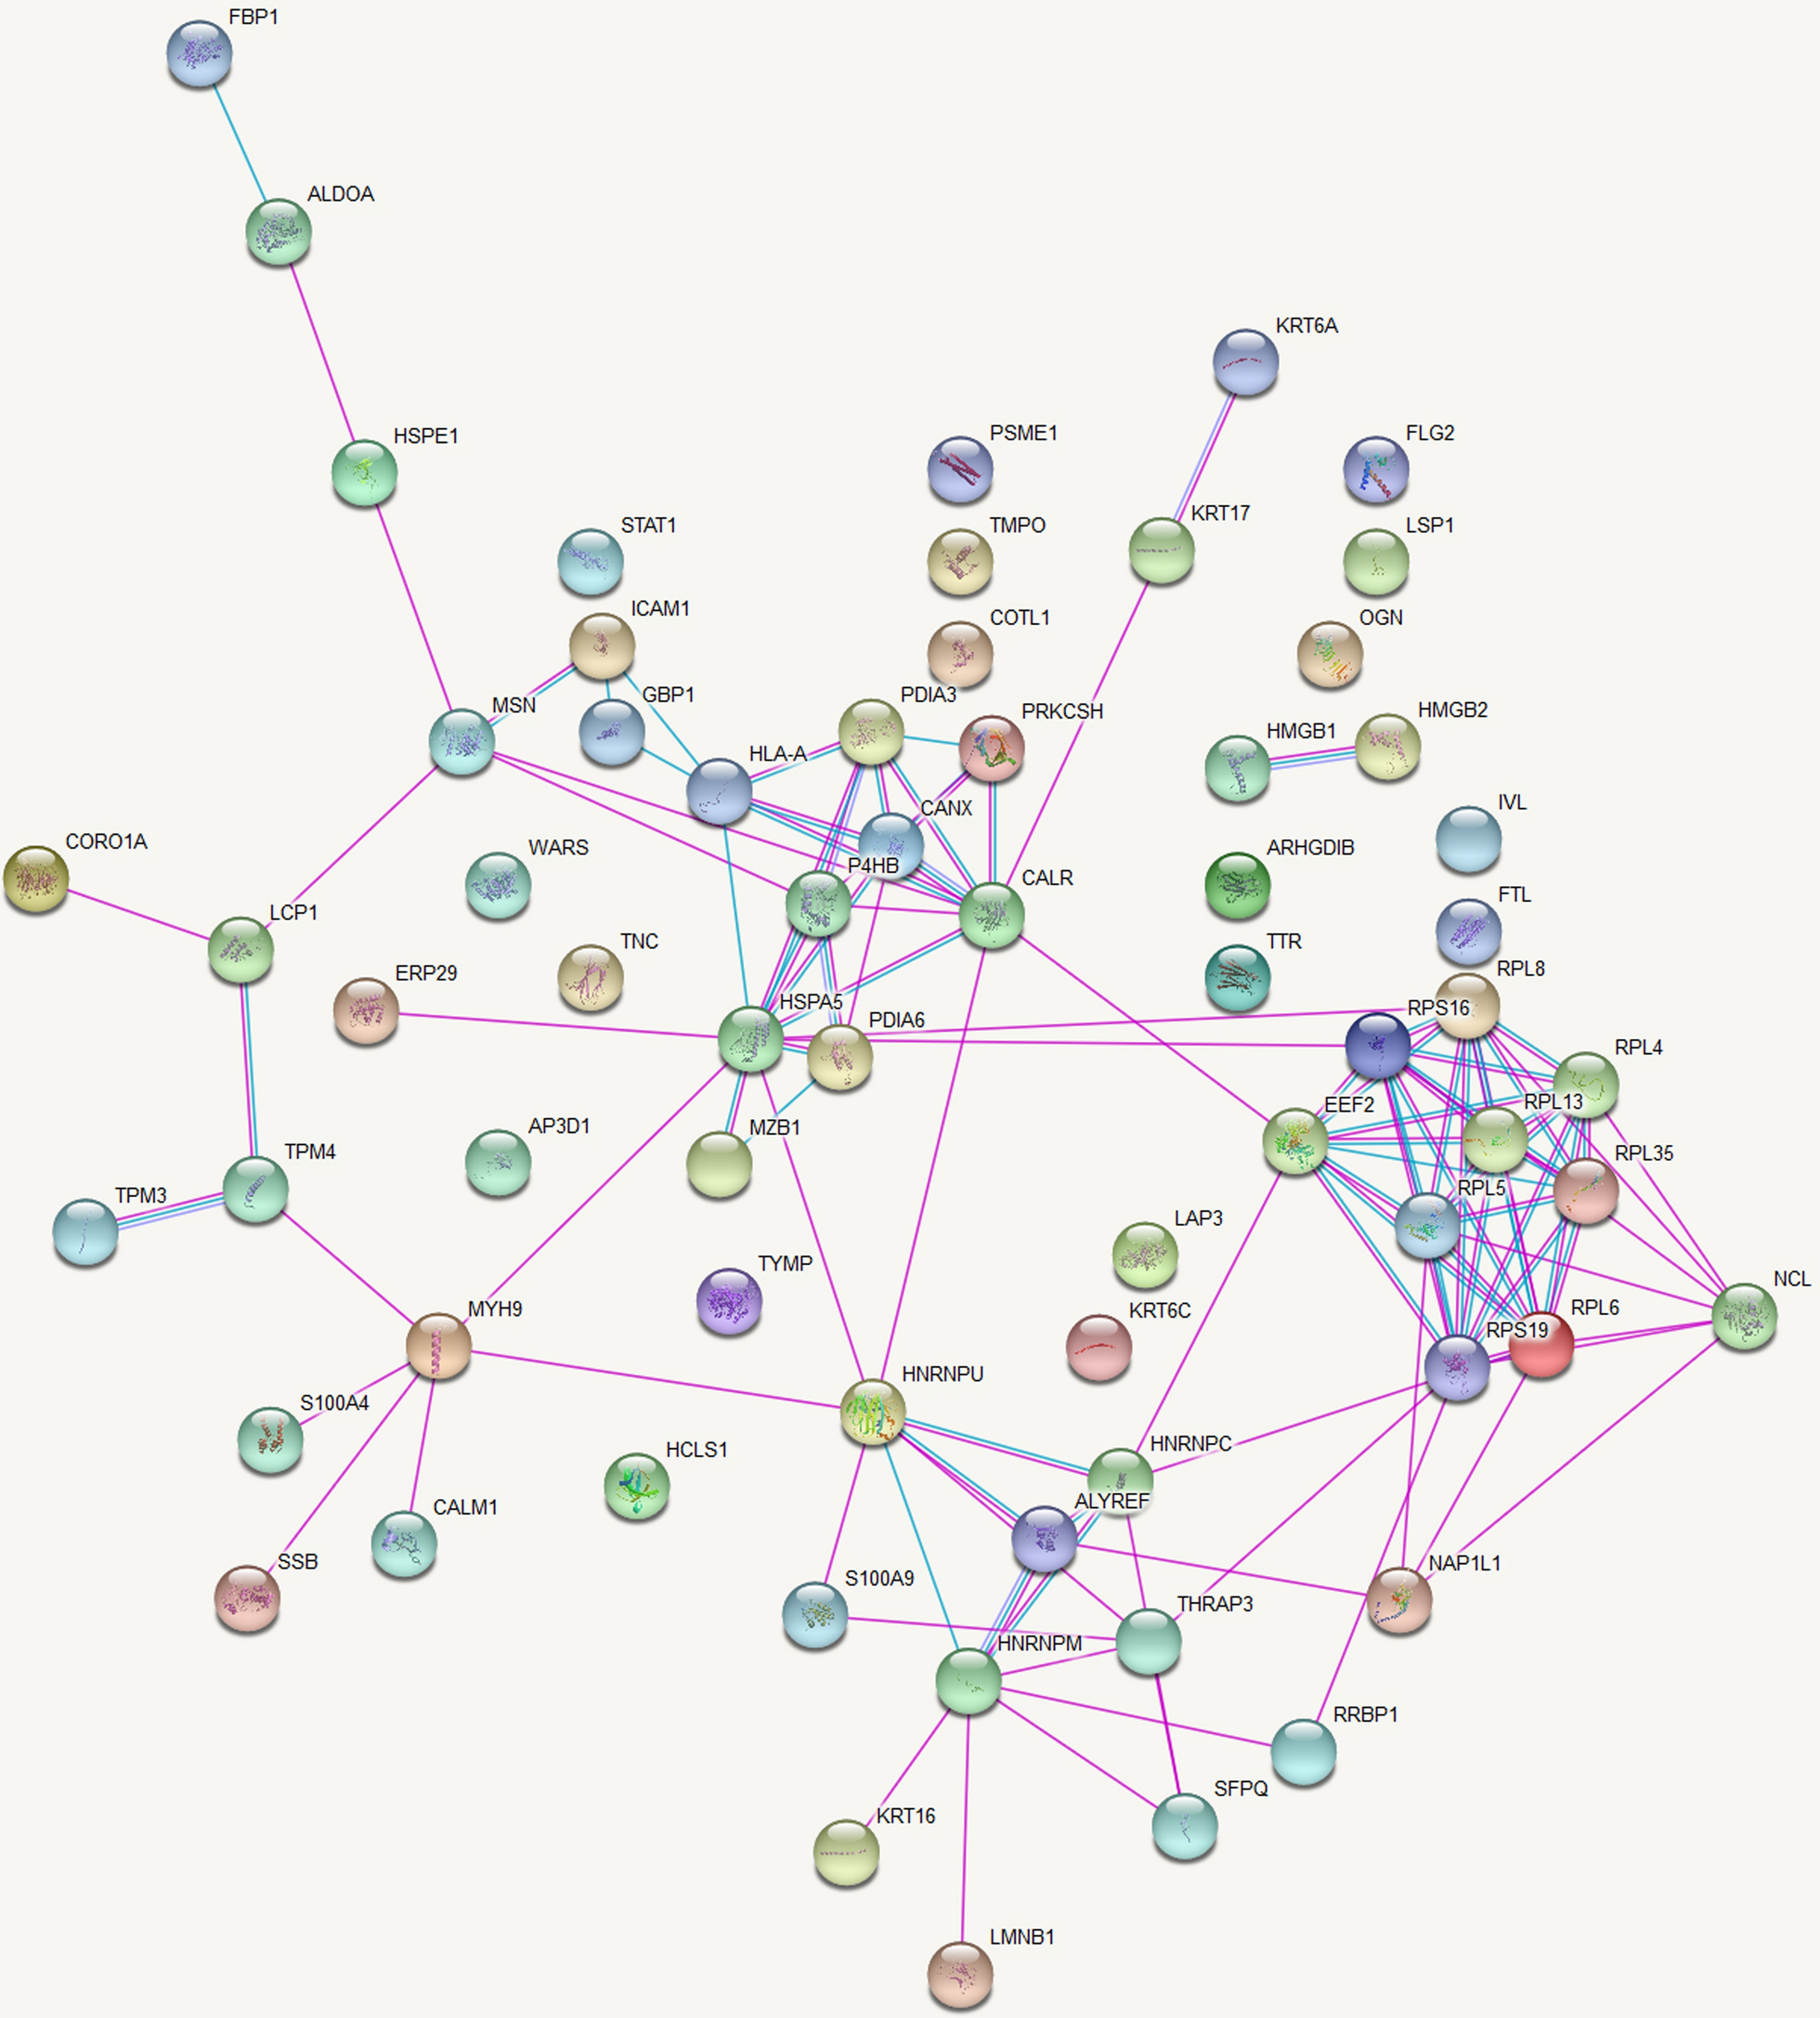
Protein–protein interaction (PPI) networks of R/P DEPs were predicted using STRING (Search Tool for the Retrieval of Interacting Genes/Proteins, https://cn.string-db.org/, version 11.5), a web resource from the ELIXIR infrastructure for PPI networks and functional enrichment analysis [15] that includes direct (physical) and indirect (functional) interactions. The minimum required interaction score was set as 0.400.
PPI clustering was conducted using the cytoHubba application (version 0.1), which uses 12 different algorithms to predict hub nodes, installed in Cytoscape (version 3.9.1) [16], an open-source software platform utilized for visualising interaction networks and integrating them with various algorithms. Proteins were scored 1 point each time they appeared in the top 10% of any algorithm. Thereafter, proteins with > 4 points were selected and screened using the condition ‘R/P > 2.0 and P < 0.01’.
Ingenuity pathway analysis pathway and network analysis
The list of DEPs identified in the formalin-fixed, paraffin-embedded samples was uploaded to the Ingenuity Pathway Analysis (IPA) software (Ingenuity Systems, Mountain View, CA, USA). The biological processes and canonical pathway analysis functions included in the software were used to interpret the differentially expressed data. Bubble charts were created with Sangerbox 3.0 (http://www.sangerbox.com/tool) [17].
Flow cytometry
Freshly resected tumour tissues were washed with cold 1× phosphate-buffered saline (PBS), cut into small pieces, and digested using the Human Tumour Dissociation Kit (130-095-929; Miltenyi biotech, Auburn, CA, USA) according to the manufacturer’s instructions. Briefly, tumour tissues were digested using 2.2 mL of Roswell Park Memorial Institute 1640 medium (supplemented with 100 µL of enzyme H, 10 µL of enzyme R, and 12.5 µL of enzyme A) at 37 °C for 1 h. Subsequently, 10 mL of cold 1× PBS was added to stop enzymatic digestion, and the cell suspension was filtered through a 40 μm cell strainer and centrifuged at 300 g for 7 min. After complete aspiration of the supernatant, the cells were washed thrice with cold 1× PBS, centrifuged at 300 g for 5 min, and resuspended in cell-staining buffer (420,201; BioLegend, San Diego, CA, USA). The cells were stained using the following fluorophore-conjugated monoclonal antibody panel: APC-Cy7 anti-human CD45 (368,515; BioLegend, San Diego, CA, USA), BV421 anti-human CD3 (317,343; BioLegend, San Diego, CA, USA), PE-anti-human CD4 (300,507; BioLegend, San Diego, CA, USA), FITC anti-human CD8 (344,703; BioLegend, San Diego, CA, USA), and APC anti-human PD-1 (329,907; BioLegend, San Diego, CA, USA). Fluorescence-minus-one (FMO) controls and the experimental samples were stained for 20 min in the dark on ice. The samples were then centrifuged at 200 g for 5 min at 4 °C, and the cells were resuspended in 300 µL of cell-staining buffer. The cells were analysed using the CytoFLEX S flow cytometer (Beckman Coulter, Brea, CA, USA) and the CytExpert software (Beckman Coulter, Brea, CA, USA). For exhausted T cells, gates were drawn based on the FMO controls.
Western blotting
Tumour tissues were collected from patients with primary ACP and recurrent ACP. Proteins were extracted from the tissues using a tissue protein extraction kit (CW0891; Cwbio, Nanjing, China). Lysates containing 10 µg of protein were loaded onto a sodium dodecyl–sulphate polyacrylamide gel and subsequently blotted onto a polyvinylidene difluoride membrane. After blocking for 1 h using 5% skim milk (W/V, 1× TBST [0.2% Tween-20 in Tris-buffered saline]) at room temperature (24–27 °C), the membrane was incubated overnight at 4 °C with one of the following antibodies: anti-β-actin (8457; Cell Signaling Technology, Danvers, MA, USA), anti-GAPDH (A19056; Abclonal, Wuhan, China), anti-LUM (ab168348; Abcam, Cambridge, UK), anti-CTSK (ab187647; Abcam, Cambridge, UK), anti-MMP-9 (ab38898; Abcam, Cambridge, UK), anti-VEGF (ab69479; Abcam, Cambridge, UK), anti-CDH2 (13,117; Cell Signaling Technology, Danvers, MA, USA), anti-CDH1 (3195; Cell Signaling Technology, Danvers, MA, USA), anti-MMP-2 (87,809; Cell Signaling Technology, Danvers, MA, USA) and anti-IDO-1 (ab211017; Abcam, Cambridge, UK). Following three washes with TBST, the membrane was incubated with horseradish peroxidase (HRP)-conjugated anti-mouse (ZB-2305; ZSGB-BIO, Beijing, China) or anti-rabbit secondary antibody (ZB-2301; ZSGB-BIO, Beijing, China) for 1 h at room temperature (24–27 °C) and then washed three more times with TBST. Finally, the proteins on the membrane were measured using the Invitrogen iBright FL1000 Imaging System (Thermo Fisher, Waltham, MA, USA) with Super ECL Plus hypersensitive chemiluminescence solution (P1050; Applygen Technologies Inc., Beijing, China).
IHC
The tumour tissues were fixed in 10% neutral buffered formalin and embedded in paraffin. Thereafter, the tumour sections were deparaffinised and rehydrated. After antigen retrieval, the sections were stained with anti-PD-L1 (ab205921; Abcam, Cambridge, UK) or anti-CD3 (ZA-0503; ZSGB‑BIO, Beijing, China)) antibody overnight at 4 °C and HRP-conjugated anti-rabbit secondary antibody (ZB-2301; ZSGB-BIO, Beijing, China) at 37 °C for 1 h. CD3 and PD-L1 expression was visualised using diaminobenzidine staining.


留言 (0)