Bioinformatic analysis
mRNA expression profiles were extracted from The Cancer Genome Atlas (TCGA) and the Gene Expression Omnibus (GEO) database, specifically series number GSE56807. Data were processed using GeneBASE software. Using RMA to get the gene core signal from each probe. The expression value of SYT represents the normalized value of Affymetrix gene chip. The Genotype-Tissue Expression (GTEx) database was used to obtain the normal tissues for Receiver Operating Characteristic (ROC) analysis. Kaplan-Meier curves analyzed overall survival (OS), while Receiver Operating Characteristic (ROC) analysis assessed diagnostic performance. The surv_cutpoint function was utilized to identify the optimal cutoff of SYT4 for the dataset. The maximum statistic was set as the best cutpoint. Patients were stratified into high and low SYT4 expression groups based on the cutoff value, and differentially expressed genes (DEGs) were identified by DESeq2 package and visualized by the ggplot2 package. Gene Ontology (GO) biological process enrichment and Kyoto Encyclopedia of Genes and Genomes (KEGG) pathway analyses were conducted via DAVID (https://david.ncifcrf.gov/tools.jsp), presented in enrichment scatter plots. Gene Set Enrichment Analysis (GSEA) further elucidated related molecular signaling pathways.
Patients and specimens
A retrospective analysis was conducted on 374 primary gastric cancer (GC) cases presented between January 2014 and December 2020 at Zhongshan Hospital, Fudan University, Shanghai, China. Informed consent was comprehensively obtained from all patients involved in the study, which was approved by the Institutional Review Board (IRB) of Zhongshan Hospital, Fudan University.
Animals
The Animal Ethics Approval for our study was granted by the Institutional Animal Care and Use Committee (IACUC). Our study ensures that all procedures involving animals are performed to minimize suffering and distress. Additionally, our research team is committed to adhering to the principles of the 3Rs (Replacement, Reduction, and Refinement) to ensure ethical treatment and use of animals in research.
Immunohistochemical staining
The EnVision two-step method conducted immunohistochemical staining.The immunohistochemistry (IHC) analysis was carried out in the platform of Leica (Bond-III). GC tissue microarrays were incubated with primary antibodies overnight at 4 °C, followed by a secondary antibody at room temperature for 20 min. Diaminobenzidine (DAB) visualized the staining. The antibodies used in this IHC experiment were listed as follows: anti-SYT4 (1:600 dilution, Invitrogen PA5-87026), anti-phospho-ERK (1:500 dilution, Proteintech 28733-1-AP), anti-phospho-p38 (1:500 dilution, Proteintech 28796-1-AP), anti-caspase-3 (1:600 dilution, Proteintech 19677-1-AP), anti-Ki67 (1:500 dilution, Proteintech 27309-1-AP).
Slides were assessed for staining intensity (0 to 3) and the percentage of positively stained cells (0-100%). Staining intensity was categorized as: weak positive (light yellow staining, scored as 1), moderate positive (brown-yellow, scored 2), and strong positive (brown, scored 3). The immunohistochemistry result was calculated by H-score =∑ (percentage of positive cells × staining intensity) = (range of weak positive × 1) + (range of moderate positive × 2) + (range of strong positive × 3). Cutoff Values: To define high vs. low SYT4 expression groups, a cutoff value is determined based on the H-score of SYT4 with the three-classification method.
Cell culture and transfection
Immortalized GC and normal gastric epithelial cell lines, procured from the Cell Bank of the Chinese Academy of Sciences, Shanghai, were cultured in Dulbecco’s Modified Eagle Medium (DMEM) supplemented with 10% fetal bovine serum and antibiotics in a humidified 5% CO2 incubator at 37 °C. Lentiviral vectors harboring SYT4 or control sequences (GeneChem, Shanghai, China) facilitated transfections, following manufacturer instructions. Puromycin was used to select stable transfectants, with shRNA sequences was shRNA1-SYT4: 5-GCTCGACATCTGCCTAAATCT-3, shRNA2-SYT4: 5- GTGAACAAGCTGAGAAATTAT-3.
Quantitative real-time transcription PCR (qRT-PCR)
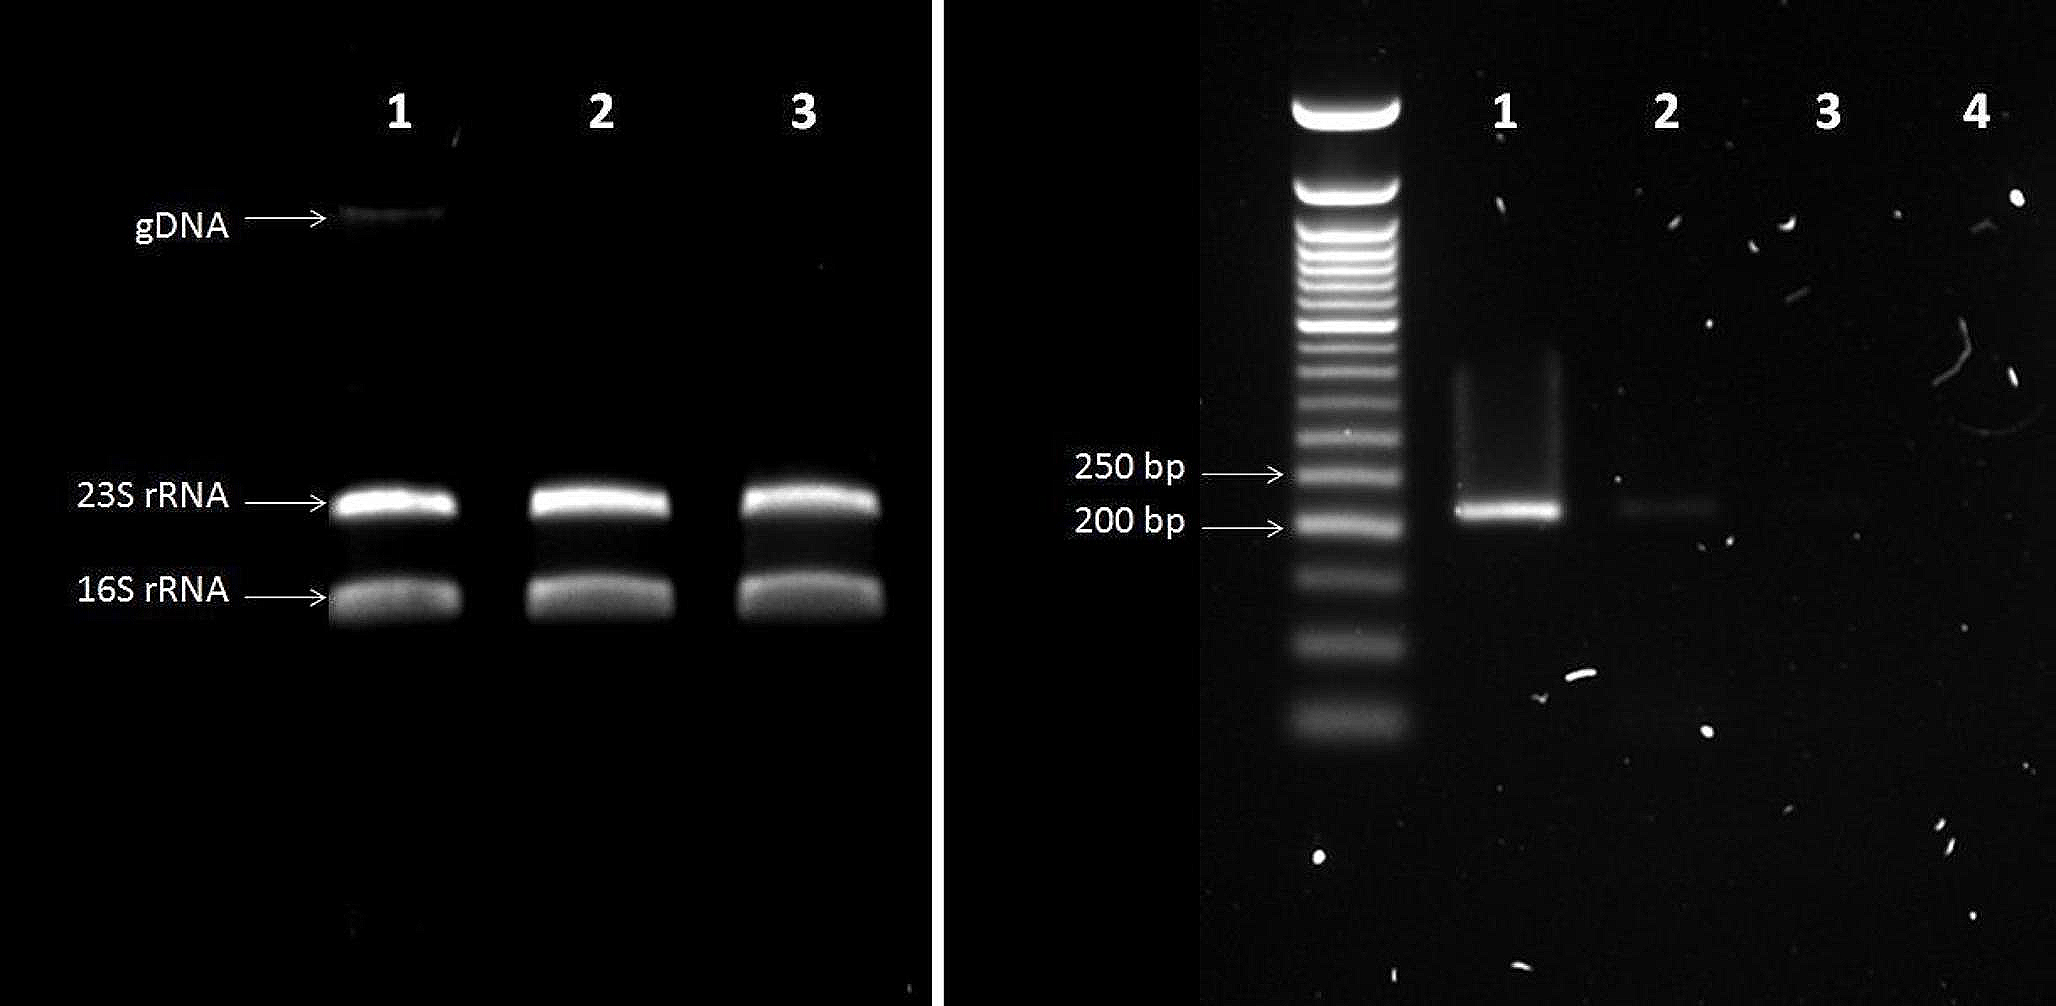
Total RNA, isolated using Trizol (Invitrogen, CA, USA), was reverse transcribed using a kit from Takara, Dalian, China. qRT-PCR employed the SYBR Green system, with gene expression levels normalized to β-actin and quantified using the 2^−ΔΔCT method. Primer sequences for SYT4 and β-actin are listed below.
5’-TCAGGACGGGGTGAGTTACTG-3’, SYT4-reverse: 5’-GTCGAGCTTTTAAGACAACCACA-3’, β-actin-forward: 5’-GACCTGACTGACTACCTCATGAAGAT-3’, β-actin-reverse: 5’-GTCACACTTCATGATGGAGTTGAAGG-3’.
Western blotting (WB)
Protein extraction from cell lysates was performed using RIPA buffer supplemented with protease inhibitors (Beyotime, Shanghai, China). Protein concentrations were quantified utilizing the BCA Protein Assay Kit (Beyotime). Subsequent separation of proteins was carried out via SDS-PAGE and transferred onto PVDF membranes (Millipore, Billerica, MA, USA). Membranes were probed with primary antibodies against SYT4 (1:1000 dilution), ERK (1:2000 dilution), phospho-ERK (1:3000 dilution), p38 (1:2000 dilution), phospho-p38 (1:2000 dilution), JNK (1:1000 dilution, Proteintech 66210-1-lg), phospho-JNK (1:1000 dilution, Proteintech 80024-1-RR), and GAPDH (1:20000 dilution, Proteintech 12935-1-AP) as a loading control. Band intensity was quantified using NIH ImageJ software (version 1.8.0.112). Each assay was performed in triplicate to ensure reproducibility.
Cell proliferation assay
Cellular proliferation was assessed using the Cell Counting Kit-8 (CCK-8, Dojindo, Kumamoto, Japan). HGC27 and MGC803 cells were plated at a density of 5,000 cells per well in 96-well plates. Following a 24-hour incubation period, 10 µl of CCK-8 solution was dispensed into each well. After a suitable incubation time to allow for color development, absorbance was measured at 450 nm utilizing the Multiskan™ FC Microplate Photometer (Thermo Scientific).
Apoptosis assay
For apoptosis quantification, cells were seeded in 6-well plates and cultured overnight. Post incubation, they were trypsinized, washed, and resuspended in binding buffer. Staining was conducted with 5 µl of PE Annexin V and 5 µl of 7-amino-actinomycin (7-AAD, BD Biosciences, NY, USA). The cells were then incubated for 20 min in the dark, followed by analysis using the BD FACSAria™ III flow cytometer (BD Biosciences, Franklin Lakes, New Jersey).
Ca2+ measurement
Gastric cancer cells were cultured in 6-well plates 24 h prior to the assay. Cells were washed with Hank’s Balanced Salt Solution containing 20 mM HEPES (HHBS) and then incubated with CalbryteTM 520 AM (AAT Bioquest, USA) at 37 °C for 60 min to label intracellular Ca2+. Excess dye was removed by replacing the solution with fresh HHBS. Changes in Ca2+ levels were visualized using a laser scanning confocal microscope (FV1000, Olympus, Japan).To explore the change of intracellular Ca2+ concentration, Ca2+ influx upon stimulation with 1 µl ionomycin (StressMarq Biosciences, Beijing, China) was measured by flow cytometry.
Xenograft tumor model
NKG mice aged 4–6 weeks (Model Organisms, Shanghai, China) were injected subcutaneously with 1 × 10⁷ SYT4-knockdown (KD) MGC803 cell line or control cells in 200 µl phosphate buffer solution (PBS). Each experimental group comprised five mice. Tumors were measured weekly for four weeks, with volumes calculated using the formula: 0.5×width2×length. Upon study completion, mice were euthanized. The mice were placed in a sealed experimental animal chamber SMQ-1 (Tianhuan Technology Co. Ltd., Shanghai, China) containing carbon dioxide (CO2), and CO2 is slowly injected until the mice expire. The tumors were excised and weighed. The protocol was approved by the Institutional Animal Care and Use Committee of Fudan University, Zhongshan Hospital.
Experimental grouping and treatment with test drugs
To assess the impact of calcium inhibition on cellular viability, SYT4-overexpressing (OE) and corresponding negative control (OENC) cells were pre-incubated for 24 h. Subsequently, cells were exposed to graded concentrations of amlodipine (0, 5, 10, and 20 µM) for 24, 48, and 72 h. Cell proliferation rates were quantified using the CCK8, consistent with prior methodology. Apoptotic responses to calcium inhibition were analyzed in both cell lines using flow cytometry after a 24-hour incubation with 10 µM amlodipine, with dimethyl sulfoxide (DMSO) serving as the control.
Amlodipine treatment of subcutaneous tumors in mice
In vivo efficacy of amlodipine was tested on NKG mice (4–6 weeks old), which were subcutaneously inoculated with 1 × 10⁷ MGC803-SYT4-OENC or MGC803-SYT4-OE cells (5 mice in each group). Following a 10-day period, allowing tumors to reach approximately 100 mm3, mice were administered DMSO (controls) or amlodipine (10 mg/kg/day, orally). Treatment continued for 28 days, after which animals were euthanized, and tumor burdens were evaluated.
Statistical analysis
Data analysis was conducted using GraphPad Prism 9 and R programming language. Survival outcomes were analyzed via Cox regression, while log-rank tests compared clinicopathological characteristics across patient cohorts. All experiments were replicated three times to ensure reliability.


留言 (0)