
記住我

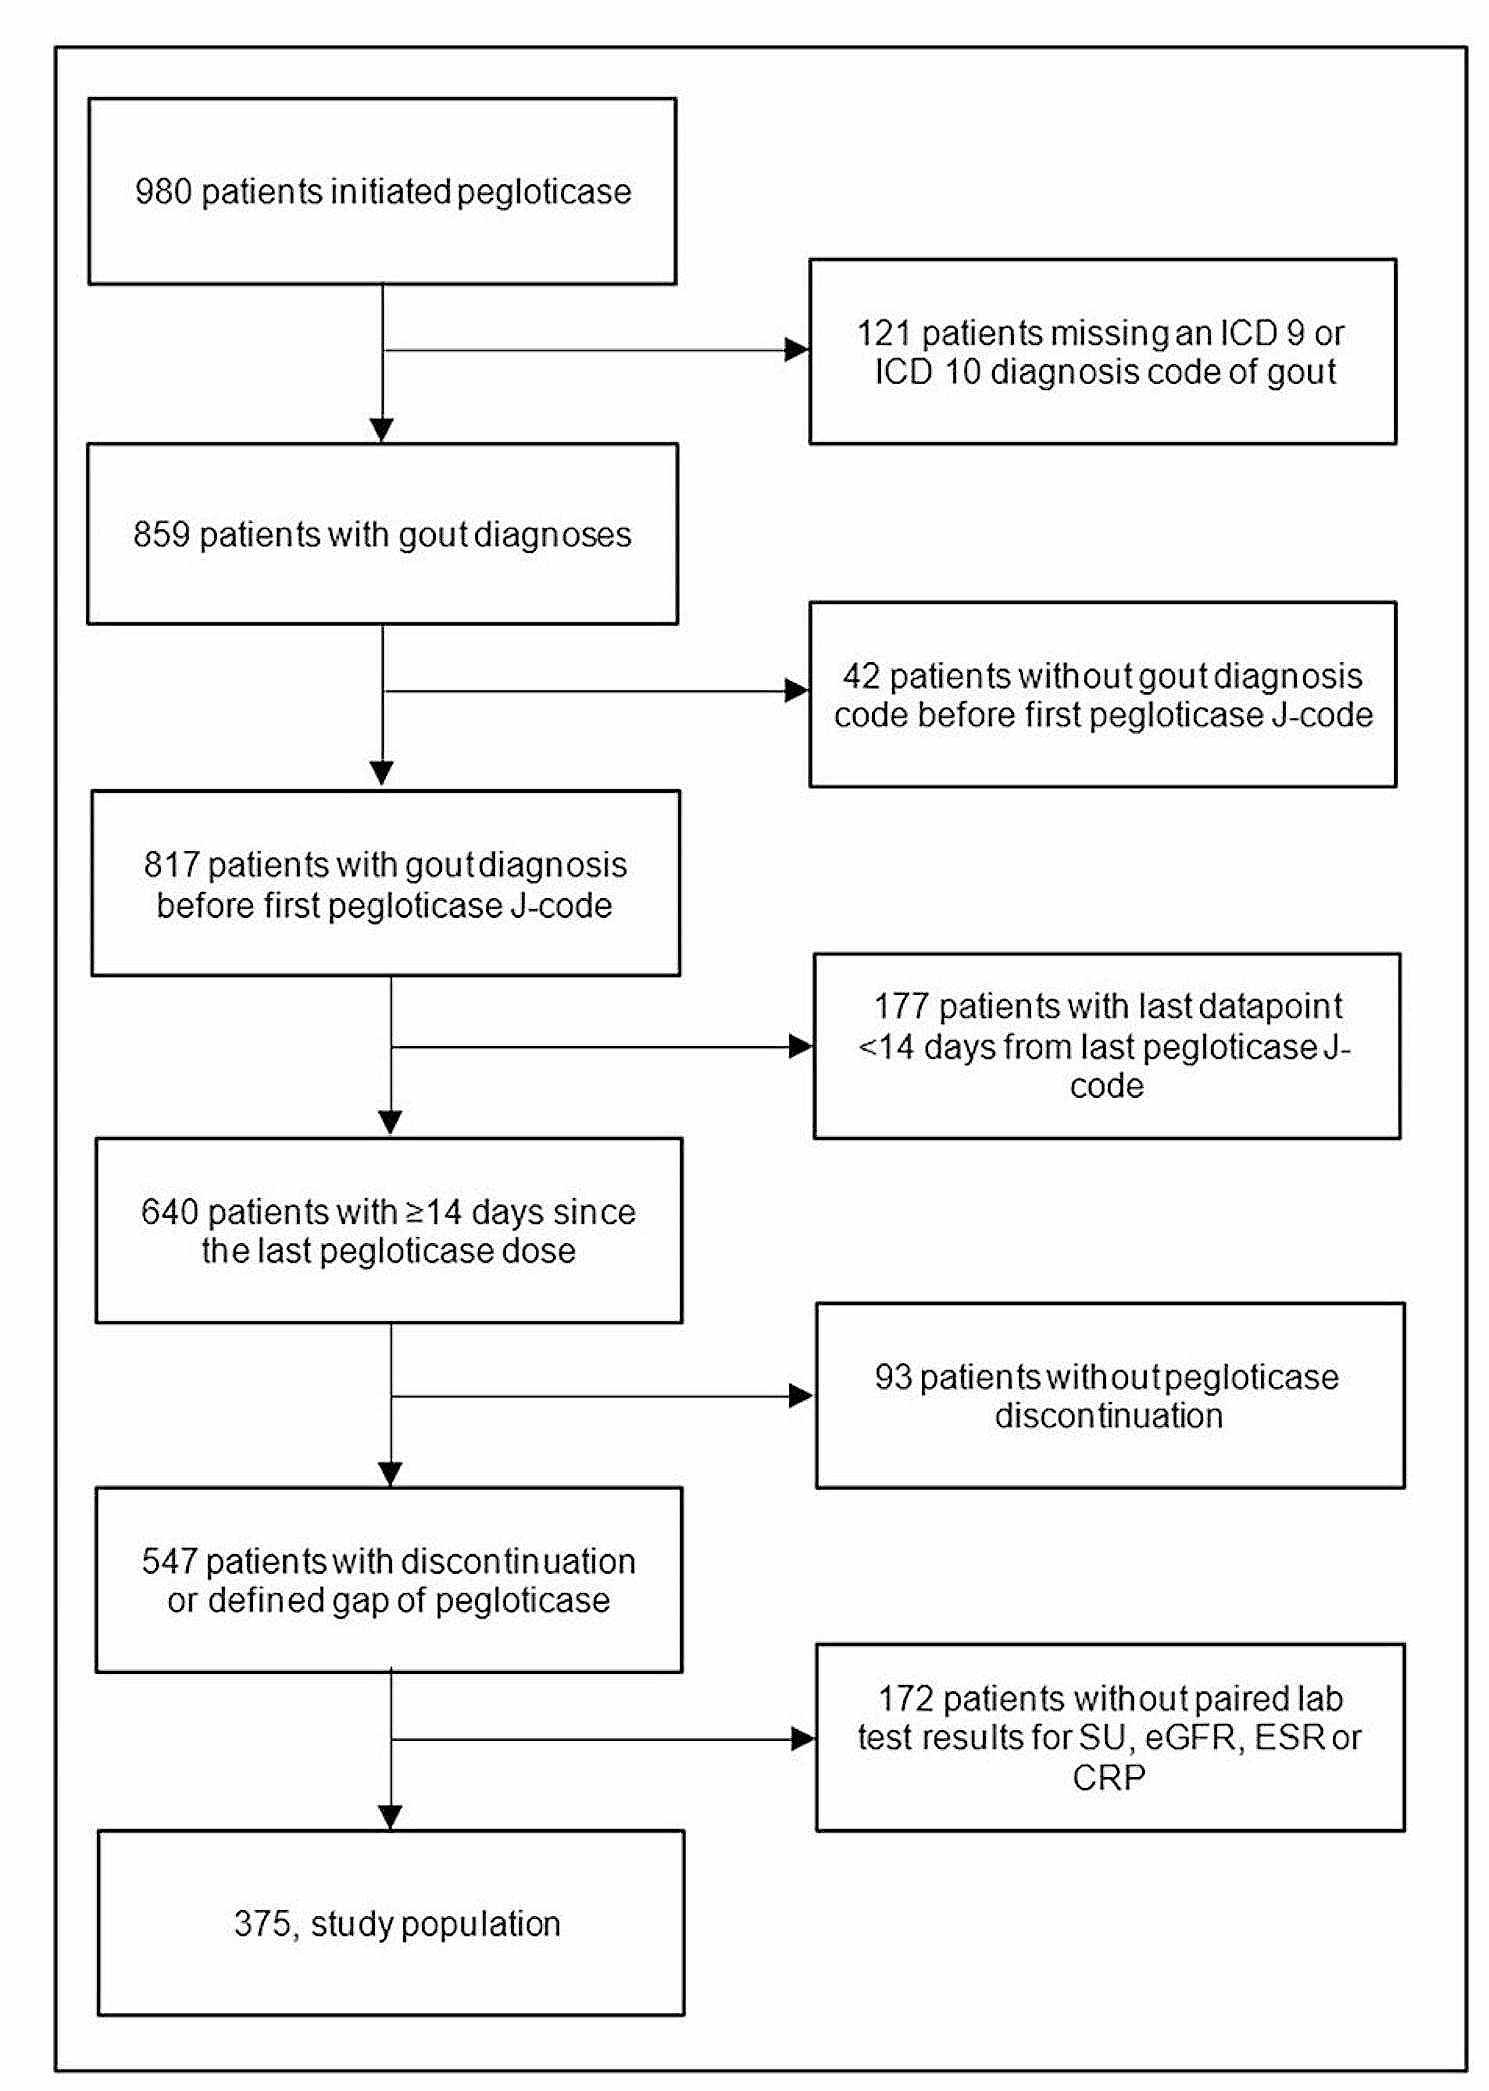
After applying inclusion and exclusion criteria, we identified 375 patients with gout who discontinued pegloticase and had paired laboratory test results available (Fig. 1). The overall sample consisted mostly of male (82.9%), white (62.7%), non-Hispanic (64.8%) patients with tophi (76.8%) (Table 1). The mean (SD) age of patients was 60.3 ± 14.7 years, with a mean (SD) RxRisk of 9.0 ± 4.1 (scale: 0–46), and a mean BMI of 32.4 ± 8.7 kg/m2. In the 12 months prior to starting pegloticase, patients had prescriptions for up to 3 ULTs. Allopurinol was the most frequently prescribed ULT followed by febuxostat, probenecid, and lesinurad. Among the 55 previous allopurinol and 28 previous febuxostat users with 2 consecutive prescriptions for the same ULT and SU labs, response to these medications was infrequent (32.7% and 28.6%, respectively). The sample also included a large proportion of patients with use of NSAIDs (59.2%), glucocorticoids (83.2%), and colchicine (77.1%) on or before the index date. Conventional immunomodulator (IMM) use was also common (30.7%), with use attributed to pegloticase co-therapy (to reduce immunogenicity) or the treatment of concomitant comorbidities (e.g., psoriasis or an alternative rheumatic disease).
Fig. 1
Attrition Table for the ACR-RISE Registry Pegloticase Discontinuation Cohort. ICD = international classification of disease code; SU = serum urate; eGFR = estimated glomerular filtration rate; ESR = erythrocyte sedimentation rate; CRP = C-reactive protein
Table 1 Baseline Demographics of Gout Patients Discontinuing PegloticaseOpioid use at or before the index date was found in 122 (32.5%) patients. The median (IQR) baseline (pre- pegloticase treatment) SU, eGFR, CRP, and ESR laboratory values were 8.4 mg/dL (6.1, 9.8), 74.5 mL/min/1.73m2 (54.9, 97.0), 5.0 mg/L (2.0, 13.0), and 17.5 mm/hr (8.0, 33.0), respectively. In contrast, the on-treatment SU levels were appreciably lower. The median (IQR) SU level was 0.9 (0.2, 6.6) after a median (IQR) of 27.0 (25.0, 28.0) days into pegloticase treatment, consistent with pegloticase treatment response in most patients. However, the upper SU quartile of 6.6 mg/dL indicated that as many as 25% of patients had suboptimal SU-control, or were losing SU-lowering response, even early in the course of treatment.
The median (IQR) number of pegloticase infusions received was 8.0 (3.0, 14.0) with a maximum of 66 infusions. The median (IQR) duration of therapy (time between first and last infusion) was 112.0 days (33.0, 204.5) with a maximum of 1,240 days (Table 2). Approximately 73.1% of patients had an SU < 6 mg/dL during pegloticase treatment. The median SU increased to 5.8 mg/dL (IQR: 3.5, 8.3) after pegloticase discontinuation, a median (IQR) SU change of + 2.4 mg/dL (0.0, 6.3) compared to on-treatment SU values. Median (IQR) pegloticase on-treatment laboratory values were 74.5 mL/min/1.73m2 (54.0, 95.0), 8.0 mg/L (2.4, 24.7), and 23.5 mm/hr (6.8, 46.8) for eGFR, CRP, and ESR, respectively, after approximately 4 weeks of pegloticase treatment (median [IQR]:27.0 days [26.0, 28.0], 28.0 days [27.3, 29.0], and 28.0 days [27.8, 28.3]). Following pegloticase discontinuation, eGFR, CPR, and ESR changed by a median (IQR) of -1.9 mL/min/1.73m2 (-8.7, 3.7), -0.8 mg/L (-12.8, 0.0), and − 4.0 mm/hr (-13.0, 0.0), respectively, compared to on-treatment levels. Median post-pegloticase discontinuation values for SU, CRP, and ESR values were lower than pre-pegloticase laboratory values (Tables 1 and 2). However, a meaningful proportion of patients were missing clinical laboratory data (ranging from 4.5% for SU to 58.9% for ESR).
Table 2 Pegloticase Treatment Parameters and Observed Laboratory ValuesFollowing pegloticase discontinuation, subsequent gout management included beginning an oral ULT (86.0% of patients), restarting pegloticase (4.5%), or not receiving any ULT (9.5%) in the reported time period. Of those who initially started oral ULTs (n = 317), 62.7% used allopurinol, 34.1% used febuxostat, 2.2% used probenecid, and 1.0% used lesinurad. Some patients switched ULTs following pegloticase discontinuation, with their second ULT medication change also shown in Fig. 2. Kaplan Meier analysis showed 76.5% of patients had started oral ULTs or restarted pegloticase within 6 months after discontinuing pegloticase (Fig. 3).
Fig. 2
ULT Initiated After Pegloticase Discontinuation (n = 358a). ULT = urate-lowering therapy. a Patients prescribed multiple ULT’s for medicine 1 or 2, after pegloticase discontinuation, were censored
Fig. 3
Probability of Starting a ULT Following Pegloticase Discontinuation. Pegloticase discontinuation is defined as 14 days following the last pegloticase infusion. The gray shaded region represents the 95% confidence interval. ULT = urate-lowering therapy
Post-ULT laboratory values were measured at least 30 days after the first oral ULT start or the restart of pegloticase. There was a median (IQR) interval of 92 days (55.0, 173.0) between discontinuing pegloticase and restarting any ULT (Table 2). Following at least 30 days after transitioning to a non-pegloticase ULT, the proportion of patients with a SU < 6 mg/dL was 51.0%. Of those who restarted allopurinol or febuxostat following pegloticase discontinuation, 64.9% and 39.3%, respectively, had urate-lowering response (SU < 6 mg/dL). The median (IQR) time of SU measurement following the second allopurinol and febuxostat prescription was 57.0 days (1.0, 190.0) and 64.5 days (1.0, 273.5), respectively. The proportion of patients who restarted pegloticase and had a SU < 6 mg/dL was 58.3% as measured at a median (IQR) of 45.5 days (39.8, 53.0) after initially stopping pegloticase. Patients who restarted pegloticase (n = 16) achieved a median on-therapy SU of 0.9 mg/dL (IQR: 0.2, 9.7; all measures at least 30 days after restarting pegloticase), with 60.0% of patients receiving immunomodulator co-therapy.
The eGFR, CRP, and ESR values did not meaningfully or significantly change between post-pegloticase discontinuation levels and post-pegloticase ULT treatment levels. Further, changes in post-pegloticase discontinuation and post-pegloticase ULT initiation laboratory measures were not significantly different between patients treated with oral ULTs or pegloticase (not shown).
There was a high degree of variability in changes in SU following pegloticase discontinuation although a general increase in SU over time was observed (Fig. 4). eGFR decreased after pegloticase discontinuation but decreases in eGFR were not associated with days since pegloticase discontinuation (not shown).
Fig. 4
Changes in Laboratory Values Following Pegloticase Discontinuation. SU = serum urate
Because almost all patients (77.3%) had an oral ULT prescribed within the preceding 12 months that presumably could have been refilled following pegloticase discontinuation, changes in SU were not able to be stratified by the subsequent oral ULT therapy nor by its dose. However, 10 patients had no record of receiving an oral ULT prior to pegloticase treatment or following pegloticase discontinuation. Of these 9 patients had laboratory measures with a lower median (IQR) post-pegloticase discontinuation SU compared to the overall cohort (2.3 mg/dL [1.5, 7.5] vs. 5.8 mg/dL [3.5, 8.3]). The restarting of ULTs after pegloticase discontinuation did appear to be restricted by renal function (eGFR < 30 ml/min/1.73 m2: 57.1% vs. eGFR ≥ 30 ml/min/1.73 m2: 86.1%). Further, median (IQR) eGFR was lower in those without ULT use before or after pegloticase therapy (54.8 [39.2, 72.9] vs. 77.5 [56.4, 96.2] ml/min/1.73 m2).
留言 (0)