
記住我


In order to increase understanding of how T3 induces hypertrophy and/or terminal maturation and how these processes mark OA pathophysiology, we performed cartilage RNA-seq analysis of control and T3 treated human osteochondral explants that were harvested from total knee replacement surgery material. The dataset consisted of 16 paired cartilage samples from 8 donors, 6 males and 2 females and with an average age of 69.9 years (range 59-76). Histological evaluation of cartilage samples after 2 weeks culture with or without T3, confirmed that relatively preserved cartilage areas were included, with an average Mankin score of 4.2 (SD = 0.8), and there was no significant difference in Mankin score between control and T3 treated cartilage.
Previously identified T3-induced genes related to hypertrophyPrior to genome wide expression analyses between controls and T3 exposed human articular cartilage, we extracted differential expression of MMP13, EPAS1, COL1A1, COL10A1 and ALPL genes, consistently associated with hypertrophy in the past, and compared them to previously published differential expression datasets of early [20] and ongoing [16] OA pathophysiology (Table 1).
Table 1 RNA-seq results for known hypertrophic genesNotable in Table 1 are COL1A1 and COL10A1 that were significantly downregulated upon T3 exposure (FC = -3.0, P = 2.9 x 10-03 and FC= -3.9, P = 9.22 x 10⁻⁴, respectively) yet highly upregulated between non-OA versus OA (FC 126 and 8.6, respectively) and not significantly changed with ongoing OA pathophysiology (preserved versus lesioned OA). Moreover, we showed that EPAS1 was significantly upregulated by T3 exposure (FC = 1.6 P = 9.6 x 10-03) yet significantly downregulated with ongoing OA pathophysiology. MMP13 was very lowly expressed in preserved cartilage explants and did not change upon T3 exposure. ALPL was upregulated but did not reach significance due to a wider range in expression levels. Together these data suggest that T3 exposure is not manifested by upregulation of CO10A1, known as an early hypertrophy marker, but rather, as marked by mineralizing marker EPAS1, triggers late hypertrophy towards early maturation and mineralization.
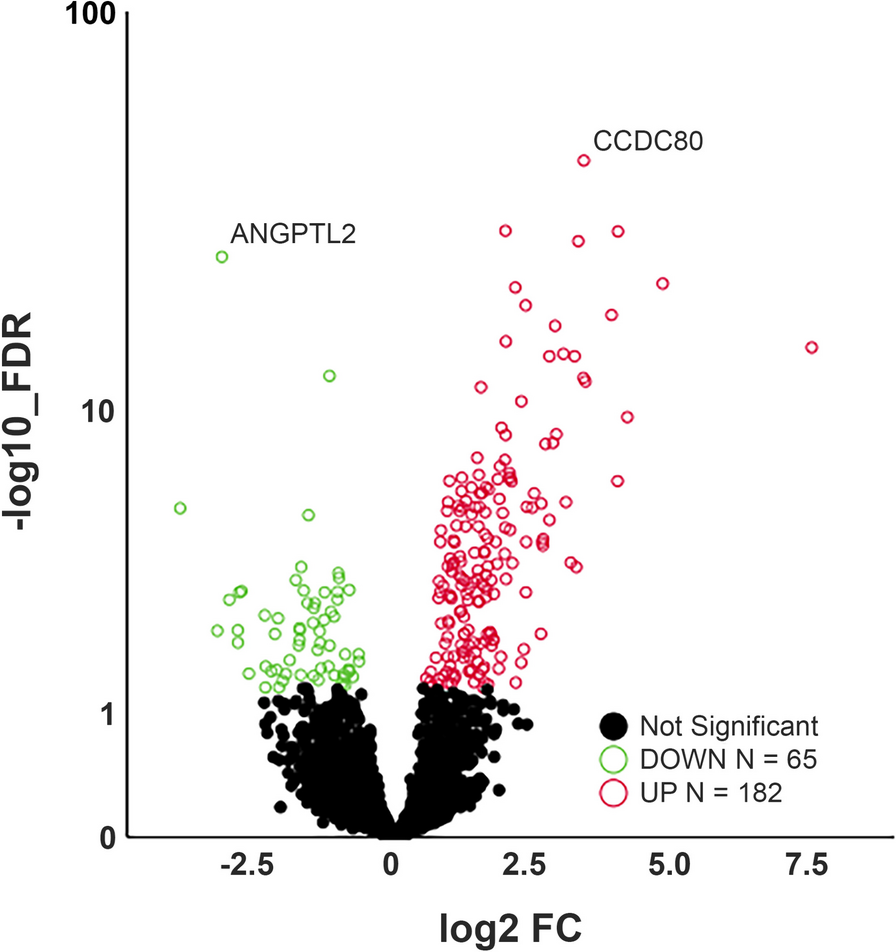
Differential expression analysisIn our RNA sequencing dataset, 10.060 genes exceeded the gene count threshold (VST > 4 counts) in at least 50% of the samples and could be included in the differentially expression (DE) analysis. Genome wide analysis with T3 exposure resulted in 247 FDR significant DET3 genes (Supplemental Table 2). Of these DET3 genes, 182 were upregulated and 65 were downregulated (Fig. 1).
Fig. 1
Volcano plot of differentially expressed genes after T3 stimulation. Circles represent all expressed genes in OA explant cartilage with genes significantly differentially expressed after T3-induced hypertrophy indicated in red (up) or green (down) with an FDR > 0.05. X-axis represents fold change (FC) of gene expression in T3-treated compared to control cartilage
The most significantly upregulated gene was CCDC80, coiled-coil domain containing 80, also known as URB (FC = 9.7, FDR = 1.3 x 10-43 ), predicted to bind to glycosaminoglycans and associated with cartilage extracellular matrix development and pre-hypertrophic chondrocytes [26]. The most significantly downregulated gene was ANGPTL7 (FC = -8.1, FDR = 2.4 x 10⁻²⁵), also known as CDT6, a member of the angiopoietin-like family. Notable among the differential 247 genes were COL2A1 and ACAN as important extracellular matrix (ECM) components that were significantly upregulated after T3 treatment (FC = 6.4, FDR = 8.2x10⁻⁸ and FC = 1.5, FDR = 1.2 x 10⁻³, respectively), likely reflecting increased metabolic activity. As shown in Supplemental Table 3 and Fig. 2, differential expression of a selection of genes was confirmed by RT-qPCR in an independent set of 22 cartilage samples from 8 donors consisting of 4 males and 4 females with an average age of 63.3 years (range 50-81).
Fig. 2
Gene expression in control and T3 stimulated explant cartilage, figure shows connected paired samples. VST data from RNA-seq analysis (paired samples from n = 8 donors). Statistical difference determined by DESeq analysis and with application of false discovery rate (FDR) correction. Validation data shown as -ΔCT values obtained by RT-qPCR analysis (paired samples from 8 donors). Statistical difference reflects linear generalized estimation equation (GEE). ** < 0.01;**** < 0.0001; n.s = not significant
To identify genes that are directly downstream of T3, the presence of thyroid hormone receptor response elements in the 247 differentially expressed genes was retrieved using TFLink [27] and is shown in Supplemental Table 4. The results indicate that a substantial number of the DET3 genes contain THRA, THRB and RXRA response elements, including the most upregulated genes CCDC80 and MLXIPL. Among the transcription factors in our dataset, KLF9 was identified as not containing these thyroid response elements indicating other signalling pathways may be involved in T3 signalling in cartilage. To identify potential upstream transcription factors (TF) regulating T3 induced gene expression, TF enrichment analysis was performed using DAVID [28, 29] (Supplemental Table 5). Although ZIC3 and HEN1 were most significant, notable was enrichment for NFKAPPAB65, critical in thyroid-specific gene regulation [30].
Pathway enrichment analysisTo explore the biological pathways in which the n = 247 FDR significant DET3 genes act, we performed ClusterProfiler analyses. As shown in Supplemental Table 6, there were 119 enriched GO pathways of which the majority (n = 70) was in the Biological Processes (BP) subontology. The top 25 most significant genes in the BP subontology and their most commonly associated genes are shown in Fig. 3. The two most significant pathways with the highest gene ratios in the BP subontology (both Padjusted = 7.7 x 10⁻¹⁶) were ECM organization (GO:0030198) and extracellular structure organization (GO:0043062) and these pathways contained the same 34 genes (Fig. 3, Supplemental Table 6).
Fig. 3
Genes present in the top 25 pathways enriched in the GO biological process subontology. Only genes present in at least 3 pathways are shown. Color reflects fold change T3 compared to control
Notably, in these ECM pathways were also CCDC80, as most significantly upregulated gene, and besides several collagens, other components of cartilage ECM that were upregulated were SPARC (FC = 3.7, FDR = 1.1 x 10⁻¹⁵) and BGN (FC = 1.6, FDR = 1.9 x 10⁻²). In contrast, the most significantly downregulated gene, ANGPTL7, is involved in the expression and assembly of several ECM components such as fibronectin (FN1) myocilin (MYOC), COL1A1 and versican (VCAN) and VCAN expression was also downregulated by T3 (FC = -4.8, FDR = 0.049), suggesting impairment of proper matrix assembly.
Additionally, Fig. 3 showed that ossification (GO:0001503) had, with 22 genes, the next highest gene ratio in the BP subontology (Padjusted = 8 x 10⁻⁶), highlighting pathways related to organophosphorus (GO:0046683) and endochondral bone morphogenesis (GO:0060350) (see also Supplemental Table 6). Highest differential expression after stimulation with T3 for genes within these pathways was seen for CLEC3A (FC = 14.6, FDR = 2.9 x 10⁻²⁹) and SPARC, genes that are known to be expressed in hypertrophic growth-plate cartilage. Other upregulated genes in this pathway known to be related to cartilage calcification were ANKH (FC = 1.9, FDR = 2.9 x 10⁻⁴), PHOSPHO1 (FC = 6.4, FDR = 2.0 x 10⁻¹⁴), AKT1 (FC = 2.1, FDR = 2.0 x 10⁻⁵) and RARG (FC = 1.7, FDR = 5.0 x 10⁻³). Downregulation within the ossification pathway was observed for TNFRSF11B (FC = -3.3, FDR = 6.2 x 10⁻⁴), encoding osteoprotegerin (OPG), the decoy receptor for TNFSF11/RANKL and TRAIL, involved in osteoclast activation. Of final note is RSPO2, R-spondin 2 (FC = -1.8, FDR = 1.7 x 10⁻²), a key regulator of Wnt signalling, facilitating the differentiation of proliferating chondrocytes into hypertrophic chondrocytes by enhancing Wnt/β-catenin signalling in endochondral ossification.
Together, pathway analyses suggested that chondrocyte proliferation and calcification are present in our T3 treated explants, indicating the transition to late-stage hypertrophy is accelerated by T3.
T3 induced genes relevant for OA pathophysiologyTo identify which DET3 genes we identified show overlap with OA pathophysiology, we first performed a comparison with the DE gene dataset in knee joints by Karlsson et al. who compared early OA cartilage to cartilage from healthy individuals (DEOAH) [20]. We identified 40 genes with the same direction of effect in DET3 and DEOAH (Fig. 4, Supplemental Table 7). Notable are the upregulated CLEC3A and CCDC80 as well as risk genes COL2A1 and SPARC, suggesting the same activation of extracellular matrix remodelling is induced in early OA. Next we looked at the RAAK data set of paired preserved (P) and lesioned (OA) cartilage samples of OA patients (DEOAP) [16]. We identified 39 genes with same direction of effect in DET3 and DEOAP, with most notable upregulated genes being again CCDC80, as well as KLF2 (FC = 2.6, FDR = 1.6 x 10⁻²) and LOXL3 (FC = 2.0, FDR = 3.8 x 10⁻⁴) that play a role in cartilage development. Among the genes upregulated in both DET3 and DEOAP were also transcription factors Hairless (HR) and Krueppel-like factor (KLF)9 (FC = 9.0 and FC = 3.8, respectively) which are known to be downstream of T3. Suggesting thyroid hormone signalling plays a significant role in OA pathophysiology.
Fig. 4
Illustrating the number of overlapping genes between T3 cartilage RNA-seq dataset, Karlsson OAH dataset [20], and RAAK OAP dataset [16]
When comparing all three transcriptome wide datasets, there were 10 genes in total with the same direction of effect in DET3, DEOAH and DEOAP, as such marking consistent expression changes with ongoing OA pathophysiology. As already observed, CCDC80 is one of these robustly upregulated genes, suggesting CCDC80 is a strong quantitative marker of ongoing chondrocyte hypertrophy with OA pathophysiology. Furthermore, ANKH and CDON (FCT3 = 2.7, FDR = 3.6 x 10⁻⁴) were also found to be robustly upregulated during early, ongoing and terminally matured OA. Additionally, transcription factor ATOH8 (FCT3 = -1.8, FDR = 2.8 x 10⁻²) was downregulated all three datasets and was also previously shown to be downregulated after mechanical loading [31], indicating it could be a robust marker for cartilage stress. We also identified the risk gene PAPPA, which is upregulated in OAP, and by T3 (FC = 3.4 and 2.7, respectively), but conversely, is significantly downregulated in OA compared to healthy cartilage (FC = -2.1).
OA risk genes responding to T3 treatmentTo investigate which OA risk genes are among the DET3 genes, we compiled the genes reported as OA risk genes in genome wide association studies (GWAS) [3, 18, 19], while incorporating allelic expression imbalances of genes, to infer OA risk effects [5]. We identified 37 DET3 genes as potential OA risk genes (see Supplemental Table 7), among which were many collagens as well as other cartilage matrix associated genes such as SPARC, COMP, CHST3 and CILP. For most of these OA risk genes no AEI effect has been shown, some of the few exceptions being COL11A1 (increased risk linked to an upregulation of type XI collagen; upregulated by T3 FC = 2.2 FDR = 7.7 x 10⁻³), COL12A1 (increased risk linked to a downregulation of type XII collagen; downregulated by T3 FC = 0.35 FDR = 2.0 x 10⁻³) and TNC (increased risk linked to a downregulation of tenascin-C; downregulated by T3 FC = 0,31 FDR = 6.0 x 10⁻³) [4]. Other OA risk genes that fit pathological events in OA are SMO, encoding the protein smoothened, upregulated by T3 (FC = 1.9, FDR = 1.9 x 10⁻²), known to mediate cartilage degeneration and PAPPA (FC = 2.7, FDR = 5.9 x 10⁻⁴), an important regulator of the IGF pathway. A selection of risk genes were included in the validation (Fig. 2, Supplemental Table 3). Fig. 2 shows results for risk genes SPARC, PAPPA, TNC and PLA2G2A. Upregulation of COL27A1, and SPARC was confirmed as well as downregulation of COMP, PLA2G2A and TNC. However, upregulation of PAPPA (P-value 0.14) and COMP (P-value 0.10) was not significant in the independent validation dataset.
留言 (0)