
記住我
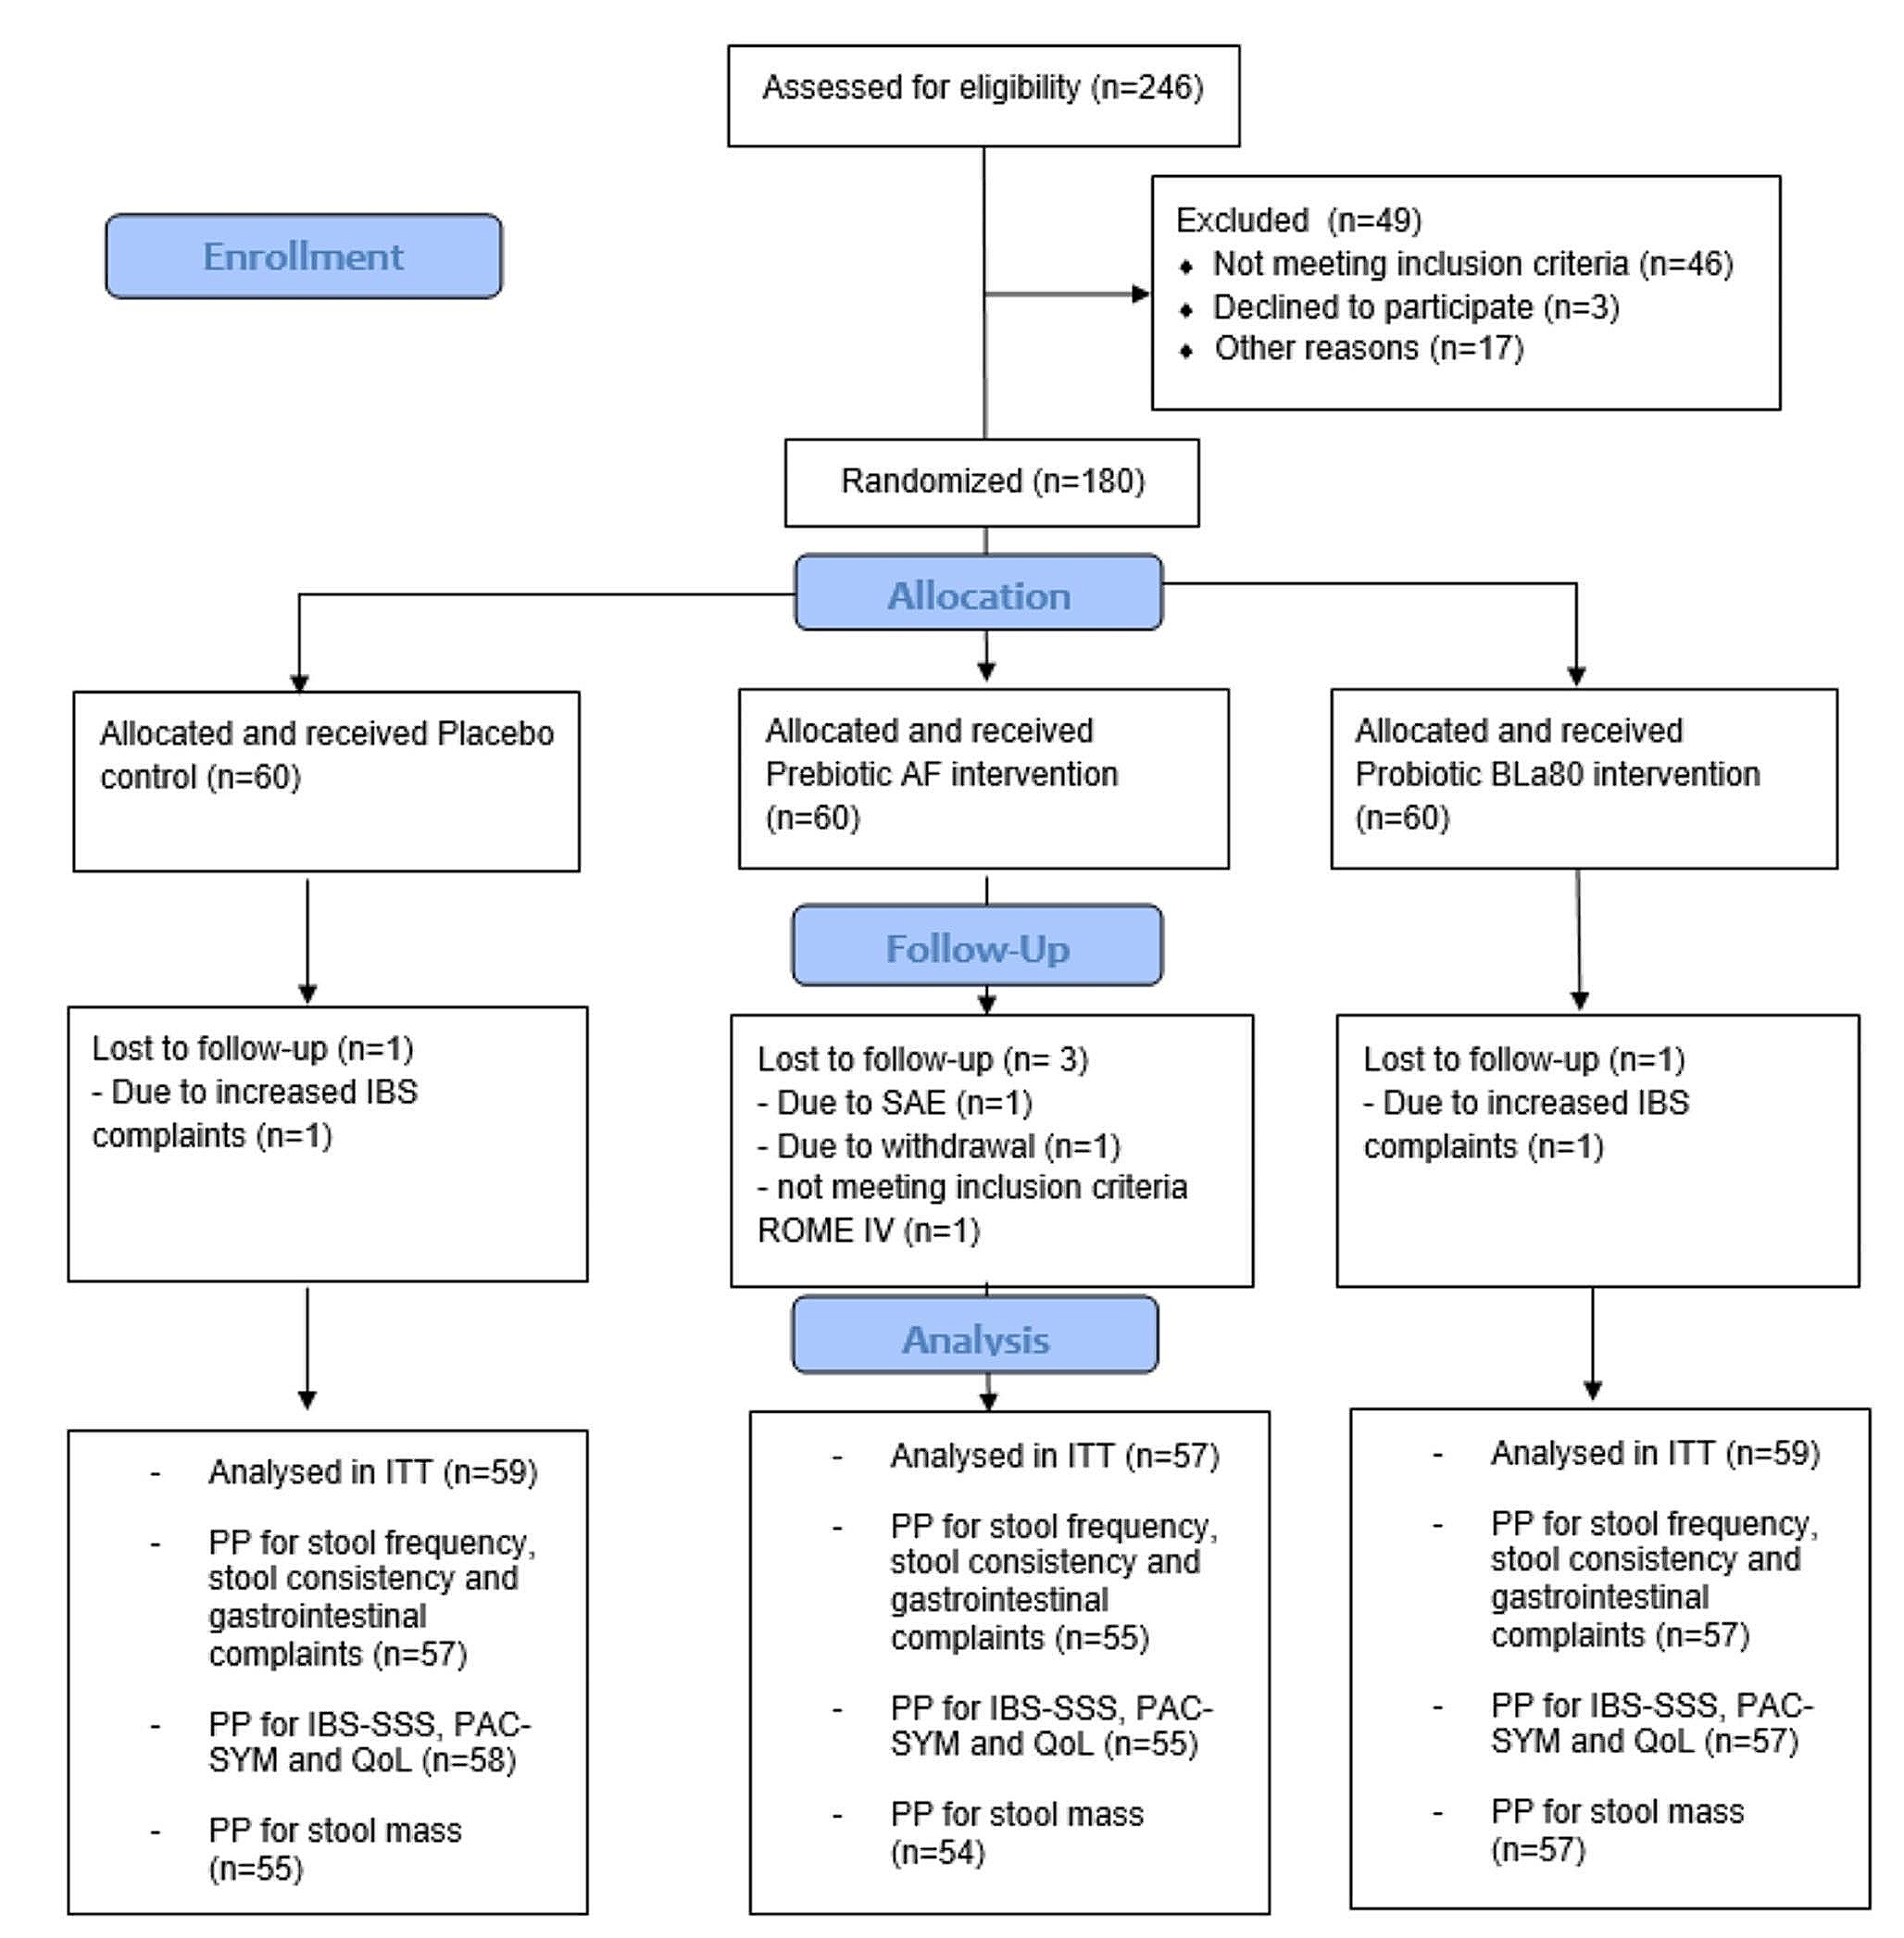
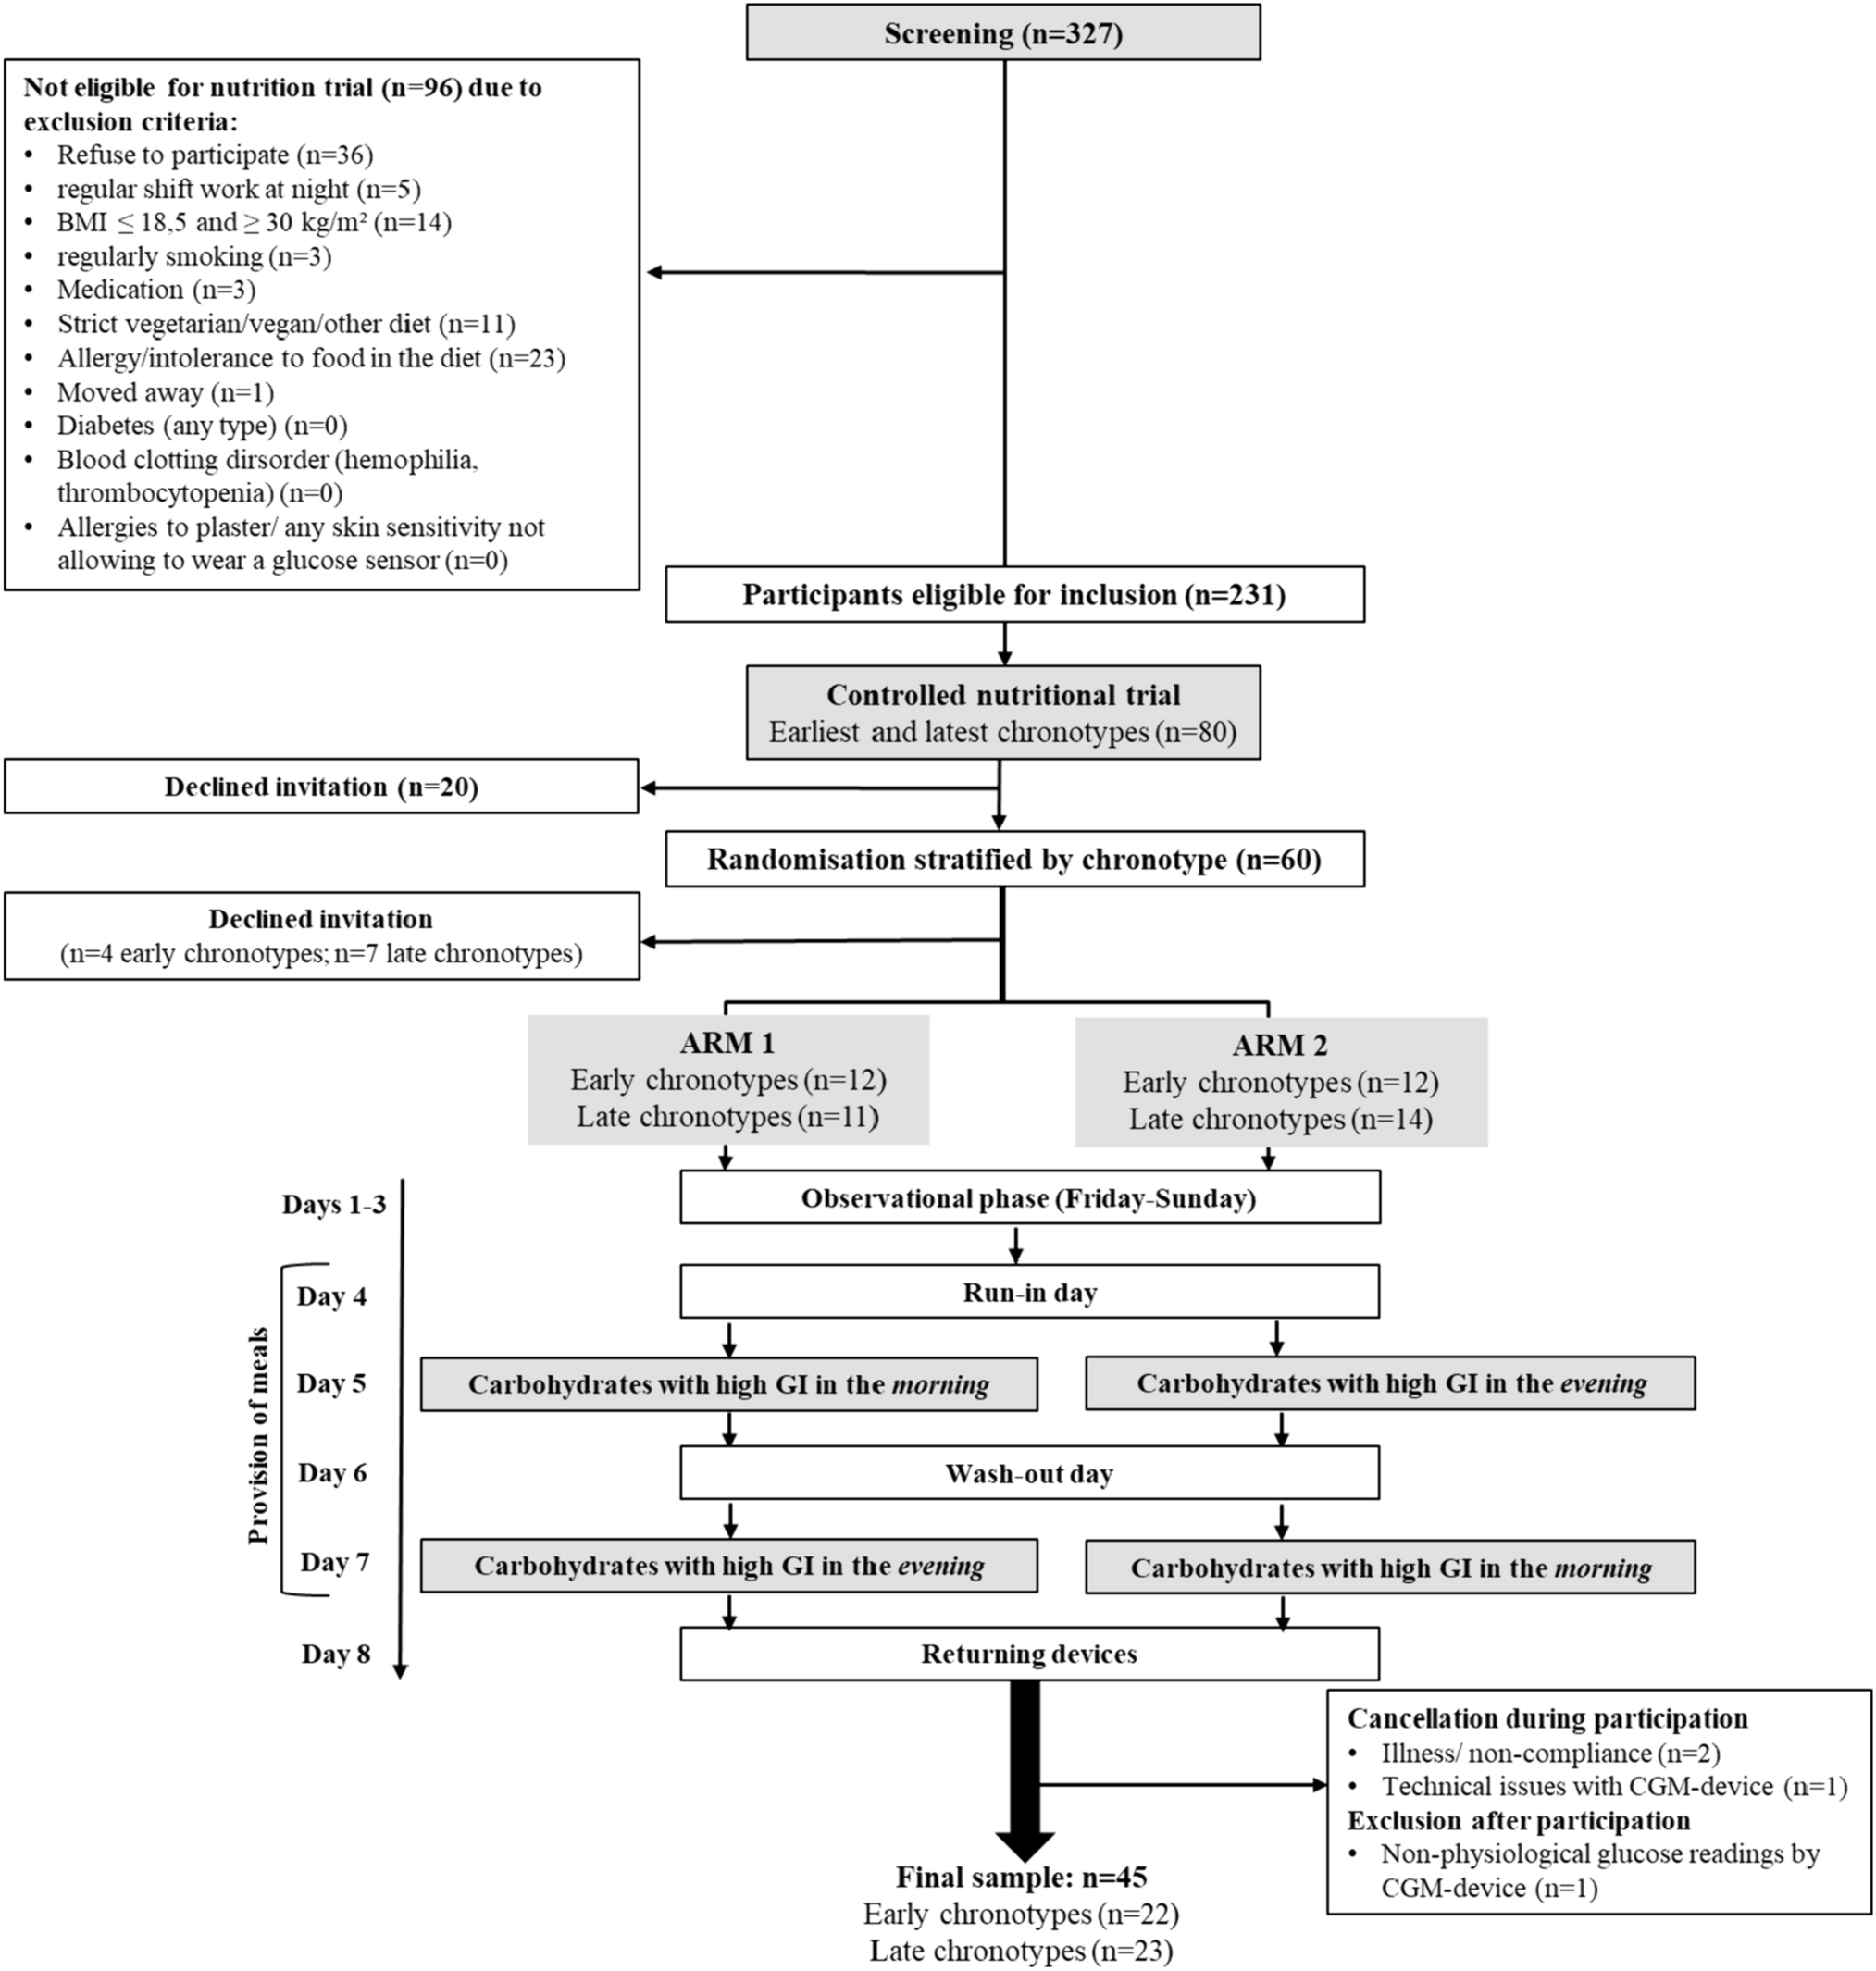
For the Chronotype and Nutrition (ChroNu) study a screening of 327 students was conducted during September 2019 to January 2020, as described previously [11]. In brief, students aged 18–25 years at Paderborn University answered questionnaires on their chronotype and the timing of daily routines; body composition was measured. Exclusion criteria are listed in Fig. 1. Among the 231 students eligible for inclusion in the controlled nutritional trial (Fig. 1), those with the earliest (n = 40) and the latest (n = 40) chronotype were invited. Of these, 20 persons declined the invitation before and 11 individuals after randomization, i.e. they did not participate in the trial. During the trial, 3 further persons were excluded due to illness/non-compliance and technical issues with the continuous glucose monitoring device. Hence, 46 students completed the nutrition trial. Data from one participant were excluded for the analysis due to non-physiological glucose readings, resulting in a final sample of n = 45 for analysis. The trial was conducted at Paderborn University during September 2020 to December 2020. Informed consent was obtained from all participants prior to the trial. The study protocol was approved by the Ethics Committee of Paderborn University (16.05.2019) and was performed in accordance with the ethical standards laid down in the 1964 Declaration of Helsinki and its later amendments [13]. The trial was registered at clinicaltrials.gov (NCT04298645).
Fig. 1
Flow chart of study participants and the procedure of the controlled nutrition trial. Of n = 327 screened students, n = 80 were invited to participate of which n = 46 completed the intervention while one participant was excluded due to non-physiological glucose recordings
Chronotype assessmentChronotype was assessed both at screening and prior to the nutrition trial using the Munich ChronoType Questionnaire, which enquires about sleep time separately for work- and work-free days [14]. The individual chronotype was the midpoint of sleep between sleep-onset and sleep-offset and corrected for accumulated sleep debt (temporal difference in sleep duration between work and work-free day) during workdays (MSFsc).
Design of the nutrition trialOn day 1, participants were asked to fill in online questionnaires via REDCap [15]. On day 4, i.e. after a 3-day observational phase, participants were randomized to the order of high GI (GI ≥ 70) meal consumption in the morning/evening (arm 1) or evening/morning (arm 2) on the intervention days (days 5 and 7), preceded by a run-in/wash-out day (days 4 and 6), respectively (Fig. 1). Participants were instructed to avoid consumption of legumes on day 3 to prevent any potential influences on the fasting glycemia values obtained in the morning of the run-in day [16]. In the morning of the run-in day, fasting blood sample was taken, and participants consumed breakfast and received their morning snack. Participants returned for a freshly prepared warm lunch and received consecutive study afternoon snack, dinner, breakfast, morning snack in labelled boxes for consumption at home until lunch on the next day, which was again provided at the study center. This schedule was maintained until day 7, when only afternoon snack and dinner were handed out after lunch. Participants were instructed to consume meals/snacks without a break at predefined times (Supplemental Tables 1, 2). On run-in/wash-out days, participants were instructed to consume their dinner before 9 p.m. to ensure a 10 h fasting period before the intervention day. Participants were asked to record the timing of meal/snack consumption, their activities, and sleep timing in a diary to corroborate compliance.
InterventionAn identical high GI meal was provided in the morning (7 a.m.) or evening (8 p.m.), i.e. at times commonly imposed by social schedules, yet potentially causing circadian misalignment for late/early chronotypes [14]. The meal consisted of a Mars® bar, Cornflakes (Kellog´s®), low-fat milk (1,5%), and a soft pretzel (Ditsch®) resulting in an estimated meal GI of 72 (Supplemental Table 1). On the intervention days, this high-GI meal provided 35% of the daily amount of available carbohydrates (grams). All other meals/snacks on the intervention and run-in/wash-out days were designed to have an estimated medium GI between 46 and 59 (Supplemental Tables 1, 2), to avoid second meal effects [16]. On the run-in/wash-out days, lunch provided the largest proportion of available carbohydrates. Meal GI estimation was conducted according to a previously published procedure [17]. Food items with a published GI [18] were given preference to allow for a valid estimation of the meal GI particularly of the intervention meal. Hence, pretzels were used, i.e. the only tested German bread with a value GI > 70 [19]. If more than one published GI value was available, the mean of these values was assigned. The dietary GI of each meal/snack was calculated as the sum of glycemic load (GL) values of each food divided by the sum of their available carbohydrates (g)*100 [17].
Participants followed an isocaloric diet to maintain body weight. To this end, total energy expenditure was estimated individually based on resting energy expenditure using the formula by Harris & Benedict [20] multiplied by a physical activity level of 1.4 since participants were instructed to avoid (vigorous) physical activity. Participants were grouped into categories based on the total energy expenditure distribution of the study population: 1900 kcal, 2100 kcal, 2300 kcal, 2500 kcal, 2700 kcal, 2900 kcal. During the trial, participants were allowed to switch the TEE category once. The energy content of the provided meals was calculated using the nutrition programme DGExpert designed by the German Nutrition Society, which is based on the German food table (Bundeslebensmittelschlüssel) [21]. The diets of the intervention and the run-in/wash-out days were designed to comply with the recommendations of the German Nutrition Society to consume a diet rich in carbohydrates [22] and contained 14En% from protein, 30En% from fat, 53En% from available carbohydrates, and 3En% from dietary fiber. Noteworthy, the macronutrient distribution (En%) was similar on all study days. During the trial, participants were asked to consume the provided foods only and to abstain from consuming alcohol/alcohol-free drinks, caffeinated/decaffeinated beverages, and carbohydrate containing beverages. Participants were provided with a selection of teas containing < 0.3g carbohydrates/serving (200 mL).
OutcomesThe primary outcome, on which the power calculation was based, was the 2-h difference in the incremental area under the curve (iAUC) while the further outcomes were the difference of iAUC and mean amplitude of glucose excursions (MAGE) over a time span of 24 h following the consumption of the high GI meal between morning and evening. Additionally, parameters describing glycemic variability (mean, standard deviation, highest, and lowest glucose value) were analyzed. During the study, glycemic responses were recorded using continuous glucose monitoring (G6, Dexcom, San Diego, CA, USA), which measures subcutaneous interstitial glucose concentrations resulting in mean glucose value every 5 min. The device was blinded during the trial (days 4–8).
Corroboration of chronotypeDuring the trial, participants were asked to wear an accelerometer (E4 wristband, Empatica SRI, Italy) day and night to objectively monitor their activity and resting phases. Sleep and awake times during the trial were estimated based on movement recordings of the accelerometer and bedtimes entered in the diary, which the participants used to record their daily routines/activities during the study. Time of sleep onset and wake-up during the nutrition trial was averaged for days 4 to 7.
Anthropometric and laboratory measurementsTo monitor changes in anthropometry, body composition, i.e. visceral fat mass and skeletal muscle mass, was measured by using Bioimpedance Analysis (mBCA 515, SECA, Hamburg, Germany) on day 1 (in the afternoon) and day 8 (in the morning) (Supplementary Table 3). Waist circumference (cm) was measured midway between the lowest rib and the iliac crest. Body size was measured using an ultrasonic measuring station (seca 287 dp, Hamburg, Germany) from SECA. BMI was calculated by weight (kg)/height (m)2.
On day 4, venous blood samples were collected at 7 a.m. after ≥ 10 h overnight fast for measurement of glucose, insulin, lipids, and high-sensitivity C-reactive protein (hsCRP). Blood samples were centrifuged after 10 and 30 min. EDTA-plasma and serum samples were stored at -20 °C and shipped to the German Diabetes Center in Düsseldorf for analyses. Fasting plasma insulin was measured with a chemiluminescence immunoassay (Immulite 2000 xPi; Siemens, Erlangen, Germany). A clinical chemistry autoanalyzer (Cobas c-311; Roche, Mannheim, Germany) was used to measure fasting blood glucose (hexokinase reference method), triglycerides (TGs), i.e. lipoproteins, low-density cholesterol (LDLc), high-density cholesterol (HDLc), as well as plasma nonesterified fatty acids using enzymatic colorimetric assay, and hsCRP with the use of an immunoturbidimetric assay [23, 24]. Melatonin was subsequently measured by ELISA (sunrise, TECAN IBL International, Hamburg, Germany) for the 44 participants with sufficient serum material at Medizinische Laboratorien, Düsseldorf. HOMA-IR was calculated as (fasting blood insulin in µU/mL*fasting blood glucose in mmol/L)/22.5 [25].
Characteristics on eating patternHabitual consumption (yes/no) and timing of meals/snacks were inquired separately for work- and work-free days. Non-consumption of breakfast/lunch/dinner was defined as skipping the corresponding meal.
Sample sizeSample size estimation of expected difference in the 2-h pp difference in morning vs. evening iAUC (primary outcome) following the consumption of the high-GI intervention meal was based on data from Morris et al. [5]. They observed that the 2-h pp iAUC to a carbohydrate-rich meal was 913 ± 26 (SEM) (mmol/L) × min in the morning and 1,096 ± 17 (mmol/L) × min in the evening (values conservatively estimated from Fig. 4 [5]), i.e. differed by approx. 180 (mmol/L) × min. Hence, including a total of n = 8 participants would accordingly allow to detect a difference of < 180 (mmol/L) × min between the morning and evening meal with a power of 80% (PROC POWER, SAS University Edition) – using a standard deviation of 98 (mmol/L) × min (i.e. estimated from the more conservative SEM reported for morning consumption [5]). Based on previous experiences [26] we assumed a 15% drop-out rate, hence the estimated sample size per arm was n = 10 (n = 20 in total). Since we planned to perform this study in two separate samples with early and late chronotypes we aimed to include 40 persons in total. With an expected participation rate of 66%, our aim was to recruit 60 eligible participants. We estimated that a total of 300 students needed to be screened to identify the participants with the latest and earliest chronotype (10% each) identified as 20% of the participants with each the earliest and latest MSFsc among the cohort.
Randomization and maskingDue to the COVID19 pandemic fewer students were willing to participate. Hence n = 80 persons had to be invited in total. Of these, 60 participants initially accepted the invitation and were randomly assigned to arm 1 or arm 2 stratified by sex and chronotype with a block size = 4 considering 20 participants per strata [27] by JD (University of Bergen), Fig. 1. While the participants and researchers were not blinded to the study arm due to the nature of the study involving provision of meals, researchers were blinded to the participants´ chronotype.
CalculationsFor analysis of 2-h pp and 24-h iAUC trapezoidal rule ignoring areas below baseline was applied [28]. Baseline was calculated as the mean of glucose readings 5 min. before and (i) at time point of meal consumption (2-h-pp iAUC) and (ii) at 7 a.m. (24-h-pp iAUC) in accordance with GI testing guidelines [28]. MAGE was calculated by use of the validated EasyGV program [29]. 24-h glycemic response and variability covers a timespan from the intervention day (7 a.m.) until 7 a.m. of the following day.
Statistical analysesDescriptive data are reported as mean ± SD if normally distributed, otherwise as median (Q1, Q3). Categorical variables are shown as percentages. As this study aimed to compare effects on 2-h pp and 24-h glycemic response following high-GI meal consumption in the morning vs. evening within both a group of early and a group of late chronotypes, multilevel linear regression was applied including chronotype and time of consumption (morning or evening) as fixed effects and participant as a random effect. By nature, these models consider the dependence between repeated measures within a person (PROC MIXED in SAS). Beta-coefficients (and 95% confidence limits) for the time variable are presented as estimates of the mean differences between morning and evening consumption. To facilitate interpretation differences are presented as evening minus morning consumption. The variable 24-h standard deviation was log-transformed to achieve normal distribution of the model residuals. The beta-coefficient for this variable was retransformed and differences represent percent differences between evening and morning consumption [30].
Only few participants exhibited > 1 standard deviation during 2-h pp interval (n = 6 early; n = 8 late chronotypes) allowing for a calculation of 2-h MAGE, hence, only 24-h MAGE was analysed.
To examine whether melatonin concentrations (available from routinely measured fasting levels only) may be related to glucose tolerance in this study correlation and linear regression were performed relating melatonin concentrations to the primary outcome 2-h pp glucose iAUC following the high-GI intervention meal. Since melatonin measurements were only available from fasting (i.e. morning) blood samples this analysis was confined to 2-h pp glucose iAUC after morning high-GI meal consumption. Statistical analyses were performed using SAS procedures (SAS version 9.4; SAS Institute, Cary, NC, USA) considering p-values < 0.05 as statistically significant except for analyses of interactions where p-values < 0.1 were considered significant [31].
留言 (0)