
記住我
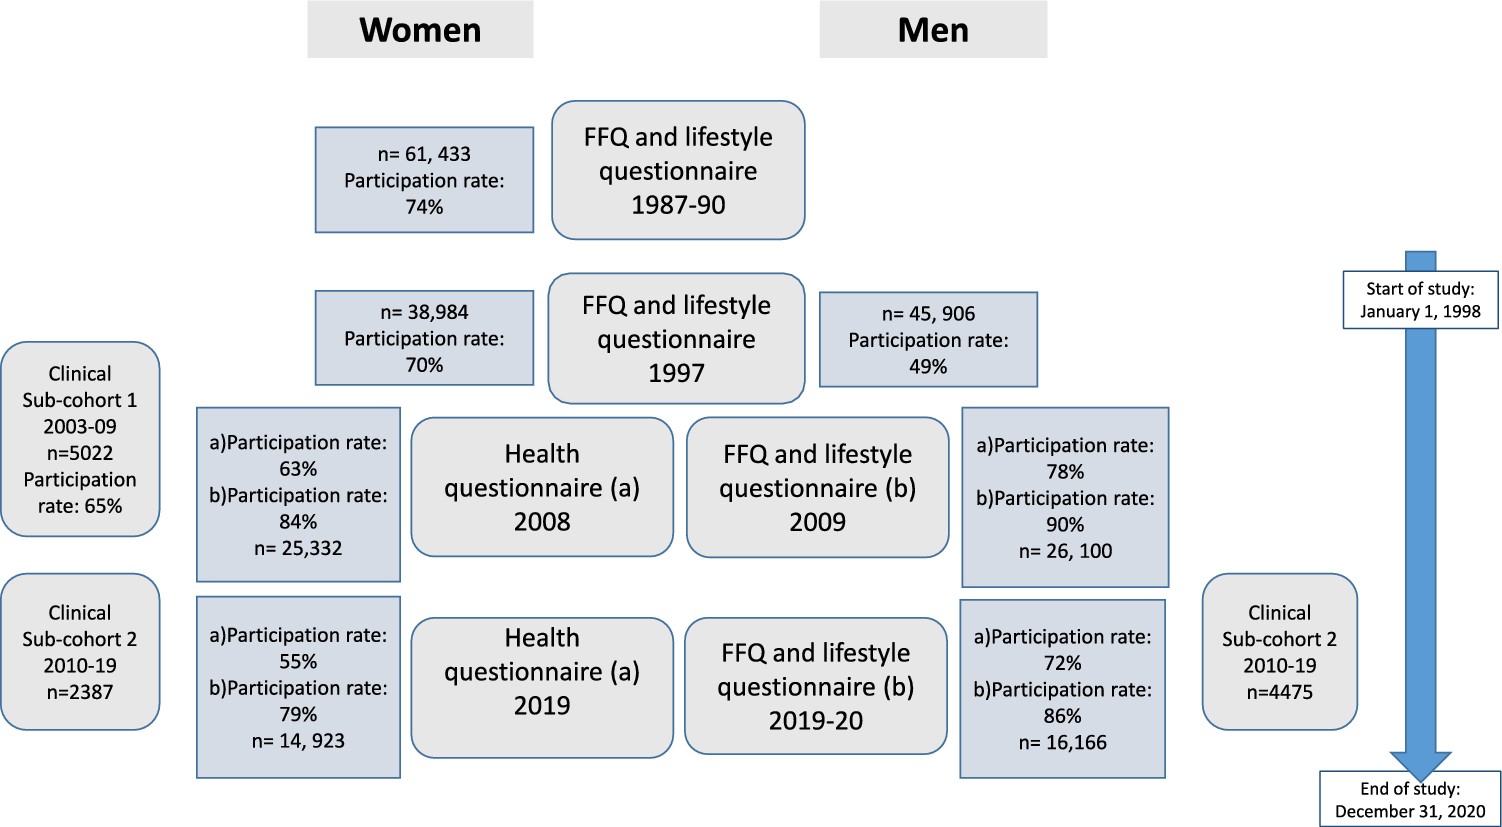
The present study population comprised of participants from two population-based cohort studies: The Swedish Mammography Cohort (SMC) and the Cohort of Swedish Men (COSM) and their respective sub-cohorts. The cohorts are part of the research infrastructure SIMPLER (http://www.simpler4health.se/). A flowchart with the number of participants and participation rate in each of the investigations is shown in Fig. 1.
Fig. 1
The flowchart depicts the number of participants and the participation rate in the different investigations in the Swedish mammography Cohort (women), the Cohort of Swedish men (men), and their respective sub-cohort
The participating women and men live in three adjacent counties in central Sweden. SMC was established in 1987–1990 and COSM in late 1997. All women born between 1914 and 1948, residing in two counties (Uppsala and Västmanland), who were invited to a mammography screening (n = 90,303) also received an invitation to complete a questionnaire covering diet and lifestyle (n = 61,433). In the fall of 1997, a second, extended questionnaire was sent to all SMC participants (n = 56,030) still residing in the study area. All male residents (n = 100,303) of two counties (Örebro and Västmanland) born between 1918 and 1952 were invited to participate in COSM by completing a questionnaire similar to that for SMC. The 1997 questionnaire included almost 350 items on diet (food frequency questionnaire, FFQ) and other lifestyle factors (e.g., socio-demographic data, weight, height, total physical activity, self-perceived health status, smoking status, alcohol consumption, and use of dietary supplements). The investigations were repeated in 2008 and 2019 in both cohorts (Fig. 1). Both times a two-phase investigational approach was used; first, an invitation to complete the health questionnaire was sent out ((a) in Fig. 1), then only those who completed this questionnaire were invited to complete the FFQ and lifestyle questionnaire ((b) in Fig. 1). More information about the cohorts has been described by Harris et al. [20]. Participants were excluded from the analytical sample if the national registration number was missing, the questionnaire had not been dated, or energy intakes were deemed implausible (± 3 SD from the mean value of the log-transformed energy intake) at each follow-up. After these exclusions, the final analytical sample comprised 83,603 participants.
We also used data from the two clinical sub-cohorts formed by participants in the SMC and COSM. The sub-cohort participants underwent health examinations and completed additional questionnaires. The first sub-cohort (sub-cohort 1) included women from Uppsala taking part in SMC, and the second comprised participants from the neighbouring county of Västmanland; men participating in COSM and their spouses belonging to SMC (sub-cohort 2) (Fig. 1). In sub-cohort 1, the women were recruited between 2003 and 2009 as a random sample of SMC participants under the age of 85 years (born 1920–1948) living in Uppsala. Participants completed the questionnaire and took part in the health examination that included weight, height, waist, hip, blood pressure measurements, various blood samples, and a dual-energy X-ray absorptiometry (DXA, Lunar Prodigy, Lunar corp., Madison, WI, USA) scan (n = 5022). The health examination occurred 1–3 months after the questionnaire was completed. In sub-cohort 2, data were collected between 2010 through 2019 from participants of the COSM cohort, born 1920–1952 and living in Västerås. The investigation included a telephone-based cognitive test, completion of a questionnaire, and a health examination similar to that for the females, except for the DXA scan. Spouses from the SMC cohort were invited simultaneously to participate in the study. Althogether, 4475 COSM men and 2387 spouses, 85% of those invited, participated in sub-cohort 2. The regional ethics committees at Uppsala University, Uppsala, and Karolinska Institutet, Stockholm, Sweden, approved the investigations and our study (dnr 2018/261 och 2018/263). Informed consent was provided if the participant returned the questionnaires.
Dietary assessmentThe dietary assessment has been described previously [21]. The FFQs included 67, 96, 132, and 132 food items in 1987, 1997, 2009, and 2019, respectively. Participants indicated in the FFQs how often, on average, they had consumed each food item during the past year and chose from eight predefined frequency categories ranging from “never/seldom” to “3 or more times per day” (1997 FFQ). Frequently consumed foods (e.g., dairy products and bread) were also reported as daily servings. Further, information on the fat type used in cooking and salad dressing was reported. The total amount of alcohol consumed daily was derived from the FFQ by multiplying the reported frequency with the declared amount on a single occasion. Energy and nutrient intakes were estimated by multiplying the consumption frequency of each food item by the nutrient content of age-specific portion sizes. Nutrient values were obtained from the Swedish food composition database established by the Swedish Food Agency. The residual method adjusted nutrient intakes for total energy intake. Dietary data for the female sub-cohort was managed as described previously [22]. The reproduceability and validity of the estimated intake of nutrients, foods, and dietary patterns from the study FFQs have been assessed by comparison with multiple 24-h recall interviews, diet records and/or biomarkers [23,24,25,26]. For the intakes of processed meat, meat, and poultry compared with dietary records and in repeated FFQ, the correlations varied between 0.37 and 0.70 [23]. The correlations of total meat intake between the different investigations varied between 0.26 and 0.37.
Examinations in the clinical sub-cohortsProteomics profiling and measurement of clinical biomarkersBlood samples were drawn after overnight fasting, cool-centrifuged, light-protected, and frozen at − 80 °C until analysis. Analysis of plasma proteomics was performed using three high-throughput, multiplex immunoassays, the Olink Proseek® Multiplex CVD 2, CVD 3, and Metabolism (Olink Bioscience, Uppsala, Sweden), as previously described [22]. The method has acceptable reproducibility and repeatability with a mean intra-assay coefficient of variation of approximately 8% and inter-assay variation of 12% [27]. Protein values below the limit of detection (LOD) were imputed as LOD/2 in sub-cohort 1 [22]; the machine output values were used in sub-cohort 2. Protein values were standardized to a distribution with a mean of 0 and SD of 1. The proteomics proteins used in the present analysis are 12 clinical biomarkers of inflammation and markers related to bone turnover. These include sclerostin (SOST), osteopontin (OPN), osteoprotegerin (OPG), insulin-like growth factor-binding proteins 1 and 2 (IGFBP-1 and -2), bone morphogenetic protein-6 (BMP-6), interleukin-6 (IL-6), fibroblast growth factor-21 (FGF-21), decorin (DCN), osteoclast-associated immunoglobulin-like receptor (hOSCAR), leptin (LEP), and growth/differentiation factor 15 (GDF-15).
In addition, total serum 25 hydroxyvitamin D, including 25-OHD2 and 25-OHD3, was assayed by high-performance liquid chromatography tandem mass spectrometry at Vitas, Oslo, Norway (www.vitas.no) [28]. Serum cross-laps and osteocalcin, as well as plasma C-reactive protein (CRP), parathyroid hormone (PTH), calcium, cystatin C, and alanine aminotransferase (ALAT), were analyzed using routine methods as described earlier [28]. Ferritin and transferrin were analyzed using standard methods. All clinical biomarkers were measured in sub-cohort 1, and CRP and calcium were measured in both.
Bone mineral density and body composition in sub-cohort 1We measured BMD at the total dual hip (g/cm2), total body fat mass (FM, g), and lean mass (LM, g) by DXA (Lunar Prodigy, Lunar Corp, Madison, WI, USA) in women (n = 5022). The precision error of triple DXA scans on 15 individuals, including repositioning, was 0.8–1.5%, depending on the type of measurement (BMD, LM, or FM). The fat mass index (FMI) was calculated as the ratio of fat mass in kg divided by height in m squared (kg/m2). As previously described, osteoporosis was defined as a T-score at either the total hip, femoral neck, or spine ≤ 2.5 standard deviations (SD) below the mean value of young women [29].
Exposure and covariatesThe food groups used in the analyses (meat, fruits/vegetables, fish, chicken, milk, fermented milk, and cheese) were formed as summary variables of the food items belonging to the respective food groups using consumption frequency per day. Meat refers to total meat and reflects the consumption of red meat, processed meat, and chicken and other poultry. Meat intake was treated as servings per day and divided into quintiles (quintile models) and tertiles (in stratified analyses by intake of fruit and vegetables). The intake of fruits/vegetables was divided into tertiles. Tertiles of meat and fruits/vegetables were combined into nine joint strata. Information on relevant covariates was obtained from the questionnaires. BMI was calculated as weight (kg) divided by height squared (m2). Comorbidity, expressed as Charlson’s weighted comorbidity index [30, 31], was defined by International Classification of Diseases (ICD) codes (versions 8, 9, and 10) from the Swedish National Patient Register (NPR).
Hip fracturesOur primary analysis considered outcomes between 1 January 1998 (study baseline) and 31 December 2020. In the SMC cohort, we also examined outcomes between the baseline in 1987–90 and 31 December 2020 in additional analyses. Hip fracture cases were defined by the ICD-10 codes (S720, S721, S722) and were obtained through individual linkage to the NPR [32]. The Swedish National Board of Health and Welfare has maintained the register that has covered all inpatient care in Sweden since 1987. Information from the registry enables complete follow-up of hip fractures [33,34,35].
Statistical analysisCox regression models to investigate meat intake and risk for hip fractureFor each participant, we accrued follow-up time from baseline (1987–90 or 1 January 1998) until the first hip fracture, date of death, or the end of the study period (31 December 2020), whichever occurred first. The associations between quintiles of meat intake and per serving and hip fracture were investigated as age- and multivariable-adjusted hazard ratios (HRs) with 95% confidence intervals (CIs) using Cox proportional hazards regression models. Calendar date was used as the time scale. All variables, except educational level and age, were time-varying variables updated at the time of the 1997 (baseline for COSM), 2009, and 2019 investigations. Quintile 2 was used as the reference level for the quintile models to facilitate valid comparability with higher intake levels, as low and non-meat eaters may differ from meat eaters in several aspects of lifestyle behaviours [36]. In sensitivity analysis, the quintile models were also run with fixed data from 1997. To study potential nonlinear continuous associations, restricted cubic splines were used with three knots placed at the continuous exposure’s 10th, 50th, and 90th percentile [37]. The reference level for these models was set to the meat consumption frequency of once per day, roughly equal to the population median intake and the upper intake range of quintile 2.
The multivariable models included covariates that were chosen based on previous knowledge and directed acyclic graphs and included age, height (continuous), BMI (continuous), smoking habits (current, former, never), living alone (binary), educational level (≤ 9, 10–12, > 12 years, other), use of calcium and vitamin D supplements (binary), cortisone use (binary), walking/cycling (never/seldom, < 20 min/d, 20–40 min/d, 40–60 min/d, 1–1.5 h/d, > 1.5 h/d), leisure time physical exercise during the past year (< 1 h/w, 1 h/w, 2–3 h/w, 4–5 h/w, > 5 h/w), Charlson’s weighted comorbidity index, energy intake, intake of fruits/vegetables, and alcohol (all continuous). We re-ran these analyses to test for the multiplicative interaction to test the effect modification by fish intake (lower or higher than 1.75 times per week) or taking a supplement with vitamin D and/or calcium. In sensitivity analysis, the multivariable models included dairy products (milk, fermented milk, and cheese) or chicken or other poultry (continuous) as separate confounders. Thus, the model adjusting for chicken or other poultry reflects red and processed meat consumption. We further performed a sensitivity analysis, adding milk intake, fermented milk, cheese, chicken/poultry, and fish to the adjusted multivariable model. Using the cross-classified variable of meat and fruit/vegetable intake creating nine strata, a multivariable Cox proportional hazard analysis with a joint reference category (low meat/high fruits/vegetables) was run. We further tested whether there was an interaction effect of sex on the association between meat intake and hip fracture.
Linear regression models in the clinical sub-cohortsMeat intake and protein and clinical biomarkersMultivariable linear regression analyses were performed to examine associations between meat intake and biomarkers of inflammation, oxidative stress, and bone turnover in both sub-cohorts. The covariates in the multivariable model were age, physical activity level, metabolic equivalents of tasks (METS), educational attainment, energy intake, living alone, and cystatin C. The associations between meat intake and cross-laps (a reliable marker of bone resorption) and glomerular filtration rate (a marker of kidney function) were tested in a sensitivity analysis.
Meat intake, bone mineral density, and body compositionIn sub-cohort 1, multivariable linear regression analysis was performed to identify associations between meat intake and BMD, and with LM, FM, and FMI, adjusted for age. The association with BMD was further adjusted for LM, FM, and height. We further tested for differences in meat intake according to the presence/absence of osteoporosis.
Missing data were multiple imputed using 20 imputations, taking into account model variables [38]. Most data of the main cohorts were missing for less than 1% of the participants for most variables. The variable with the most missing data was exercise (11%), followed by physical activity (9%), chicken intake (9%), living alone (6.5%), and BMI (4%). All analyses were performed with Stata, version 15.1 (StataCorp, College Station, TX, USA). Analyses were performed on resources provided by the Swedish National Infrastructure for Computing’s (https://www.snic.se/) support for sensitive data (SNIC-SENS) through the Uppsala Multidisciplinary Center for Advanced Computational Science (UPPMAX) under Project SIMP2021014.
留言 (0)