
記住我
By the end of 2021, 38.4 million people globally were living with HIV and 28.7 million people (73%) were accessing antiretroviral therapy (ART); despite the progress in scale-up of ART, 650,000 people died of AIDS-related illness in 2021.1 Advanced HIV disease (AHD) remains common in many countries, defined as having a CD4 cell count of <200 cells per cubic millimeter or World Health Organization (WHO) clinical stage 3 or 4 disease for adults, adolescents, and children older than 5 years, which increases the risk of morbidity and mortality.2
WHO recommends a package of interventions for people living with HIV (PLHIV) who present with AHD, including screening for, prophylaxis, and/or management of common opportunistic infections, including tuberculosis and cryptococcal disease.2–4 Since the implementation of Universal Test and Treat (UTT), spearheaded by the US President's Emergency Plan for AIDS Relief (PEPFAR),5 there has been a shift in country investments from CD4 testing to viral load (VL) testing for monitoring response to ART.6 Because PLHIV are being initiated on ART sooner, rather than based on CD4 criteria, there has been an expectation that earlier ART may decrease the prevalence of AHD.
Longitudinal cohorts spanning both the before and during the “test and treat” periods have noted a decline in AHD prevalence among countries in Southern Africa, but this response has been modest.7,8 Understanding of temporal changes and other drivers of AHD prevalence in other regions in sub-Saharan Africa is limited. To understand the impact of ART scale-up on AHD, we focused on a cohort where consistent cross-sectional data collections occurred upon enrollment over several years, assessed trends in AHD and ART uptake and described factors associated with AHD among adult PLHIV across 4 countries in sub-Saharan Africa before and during the “test and treat” era. Because noninfectious comorbid diseases (NCDs) contribute to morbidity and mortality among PLHIV in resource-rich countries with higher ART uptake, we also assessed the impact of NCDs on AHD.9,10
METHODS Study Design and ParticipantsThese longitudinal analyses used data from the African Cohort Study (AFRICOS), a prospective cohort established in 2013 that enrolls persons with and without HIV at 12 PEPFAR-supported facilities in Uganda, Kenya, Tanzania, and Nigeria. Initially, individuals were eligible if they were aged ≥18 years and consented to data and specimen collection. Beginning in January 2020, individuals aged 15–17 years were also eligible for enrollment. Most of the participants living with HIV were invited to the study based on random selection from existing clinic patient lists (stratified by gender and ART status) or new enrollees to the clinic, whereas a minority (<5%) were recruited from other HIV studies performed by the AFRICOS group locally.11 As a result, some participants were already on ART at the point of enrollment into AFRICOS. For our analyses, we excluded persons without HIV and included PLHIV with available CD4 at AFRICOS enrollment.
Data Collection/MeasuresAFRICOS participants were administered a medical history and physical examination and completed a demographic and sociobehavioral questionnaire, and underwent phlebotomy upon enrollment, as previously described.11 In addition, every 6 months, follow-up study visits occurred, and participants provided medical history, completed a physical examination, and underwent laboratory assessments. If a participant misses a study visit but later returns, they continue to be included in the cohort, and the missed visit is documented. Participants stop contributing information to follow-up visits if they die or are lost to follow-up, as defined as no contact for 360 days since missed visit.
All participants had an assessment of serum creatinine, glucose, and cholesterol performed annually. Enrollment year was stratified according to timing of implementation of UTT policy: 2013–2014 for pre-UTT, 2015–2016 for early UTT, and 2017–2021 for broader implementation of UTT. Participants with recorded dates of HIV diagnosis were categorized by WHO guideline era (<2006, 2006–2009, 2010–2012, 2013–2015, ≥2016) to account for the changes in recommendations for ART initiation over time as previously described.12 Demographic and sociobehavioral variables included sex, age, education level, clinical care site, and food security (defined as having enough food to eat). Body mass index (BMI) was calculated using participants' height and weight, then categorized as underweight (<18.5 kg/m2), normal weight (18.5–24.9 kg/m2), or overweight (≥25 kg/m2). NCDs were defined as previously described.11 Anemia was defined as hemoglobin <13 g/dL for men or <12 g/dL for women. Elevated blood pressure was defined as a systolic blood pressure measurement of >139 mm Hg, a diastolic blood pressure measurement of >89 mm Hg, or receipt of antihypertensive medications. Any abnormal blood pressures were repeated for confirmation during the study visit, and the second blood pressure was recorded. Hypercholesterolemia was defined as a total fasting cholesterol of >199 mg/dL or receipt of lipid-lowering medications. Dysglycemia was defined as a fasting glucose of >99 mg/dL, nonfasting glucose of >199 mg/dL, or receipt of hypoglycemic medications. Renal insufficiency was defined as an estimated glomerular filtration rate <60 mL/min/1.73 m2, calculated using the Modification of Diet in Renal Disease equation based on serum creatinine captured at entry.13 Historical ART start dates and laboratory results were obtained from medical record review. ART medication use (also known as ART uptake) was defined as not on ART or on ART at each visit, and VL suppression (VLS) was defined as <1000 copies per milliliter. PLHIV had CD4 T-lymphocyte count (CD4) in cells per cubic millimeter and HIV RNA (“viral load” or VL) testing performed at enrollment and at 6-month follow-up visits. CD4 count was assessed using BD FACSCount, BD FACSCalibur, BD FACSCanto II, or BD FACSPresto; HIV RNA was assessed using several different platforms over the course of the study, as previously described.14 Serum cryptococcal antigen (CrAg) was measured at enrollment for PLHIV with CD4 of <200 cells per cubic millimeter using IMMY Lateral Flow Assay method. TB epidemiology and diagnostic testing results for AFRICOS have previously been described.15
Statistical AnalysesAll data were recorded on paper case report forms and double-entered into the ClinPlus platform (DZS Software Solutions, Bound Brock, NJ). Analyses were performed in SAS 9.3 (SAS, Cary, NC) and Stata 14.0 (StataCorp, College Station, TX). For the longitudinal descriptive analysis, we included all participants ≥15 years of age enrolled from January 21, 2013, to September 1, 2021, with available CD4 data at enrollment; participants were categorized by year of study enrollment, and we compared the percentage of participants with CD4 <200 cells per cubic millimeter and percentage on ART (ART uptake) during the study visits; in addition, we compared the trends in percentage of CD4 count <200 cells per cubic millimeter by UTT eras at study visits. We assessed the frequency of NCDs and CrAg prevalence at enrollment. Generalized estimating equation (GEE) regression modeling was performed for participants with available data to estimate unadjusted and adjusted odds ratio with 95% confidence intervals (CI) for factors potentially associated with CD4 count of <200 cells per cubic millimeter at each study visit. Epidemiologically plausible variables were considered a priori for the initial variable list. Backward selection was used to select the variables included in the final adjusted GEE model.
Ethical ConsiderationsThe study was approved by Institutional Review Boards of the Walter Reed Army Institute of Research, Makerere University School of Public Health, Kenya Medical Research Institute, Tanzania National Institute of Medical Research, and Nigerian Ministry of Defense. All participants provided written informed consent before enrollment. The secondary analysis assessing factors associated with CD4 count of <200 cells per cubic millimeter was approved by the US Centers for Disease Control and Prevention (CDC) and was conducted consistent with applicable federal law and CDC policy. A waiver of consent was obtained as the procedures only involved analyzing previously collected deidentified data, and the project was considered only minimal risk to the participants.
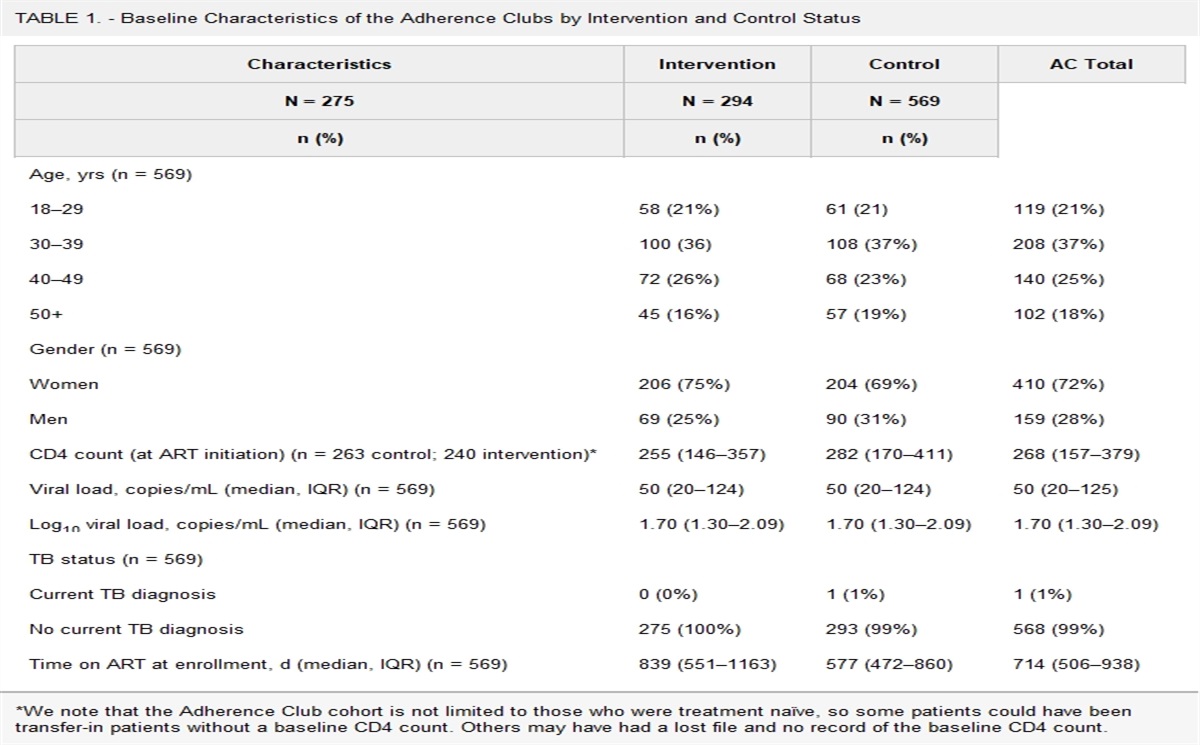
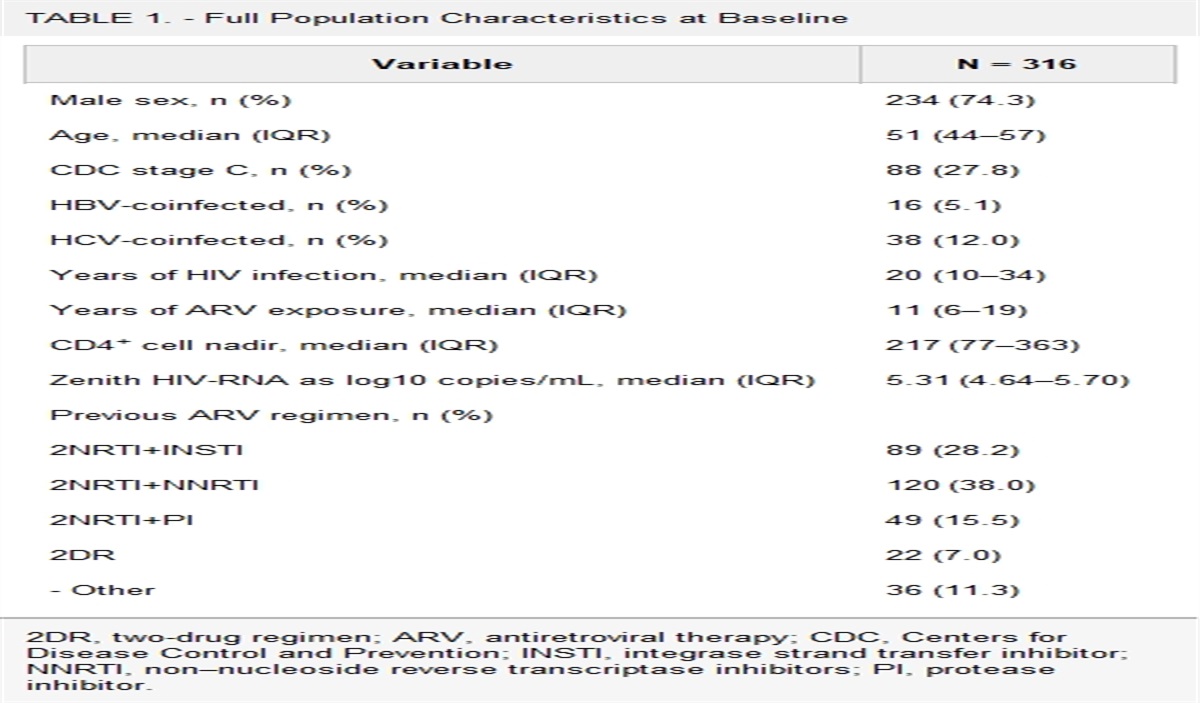
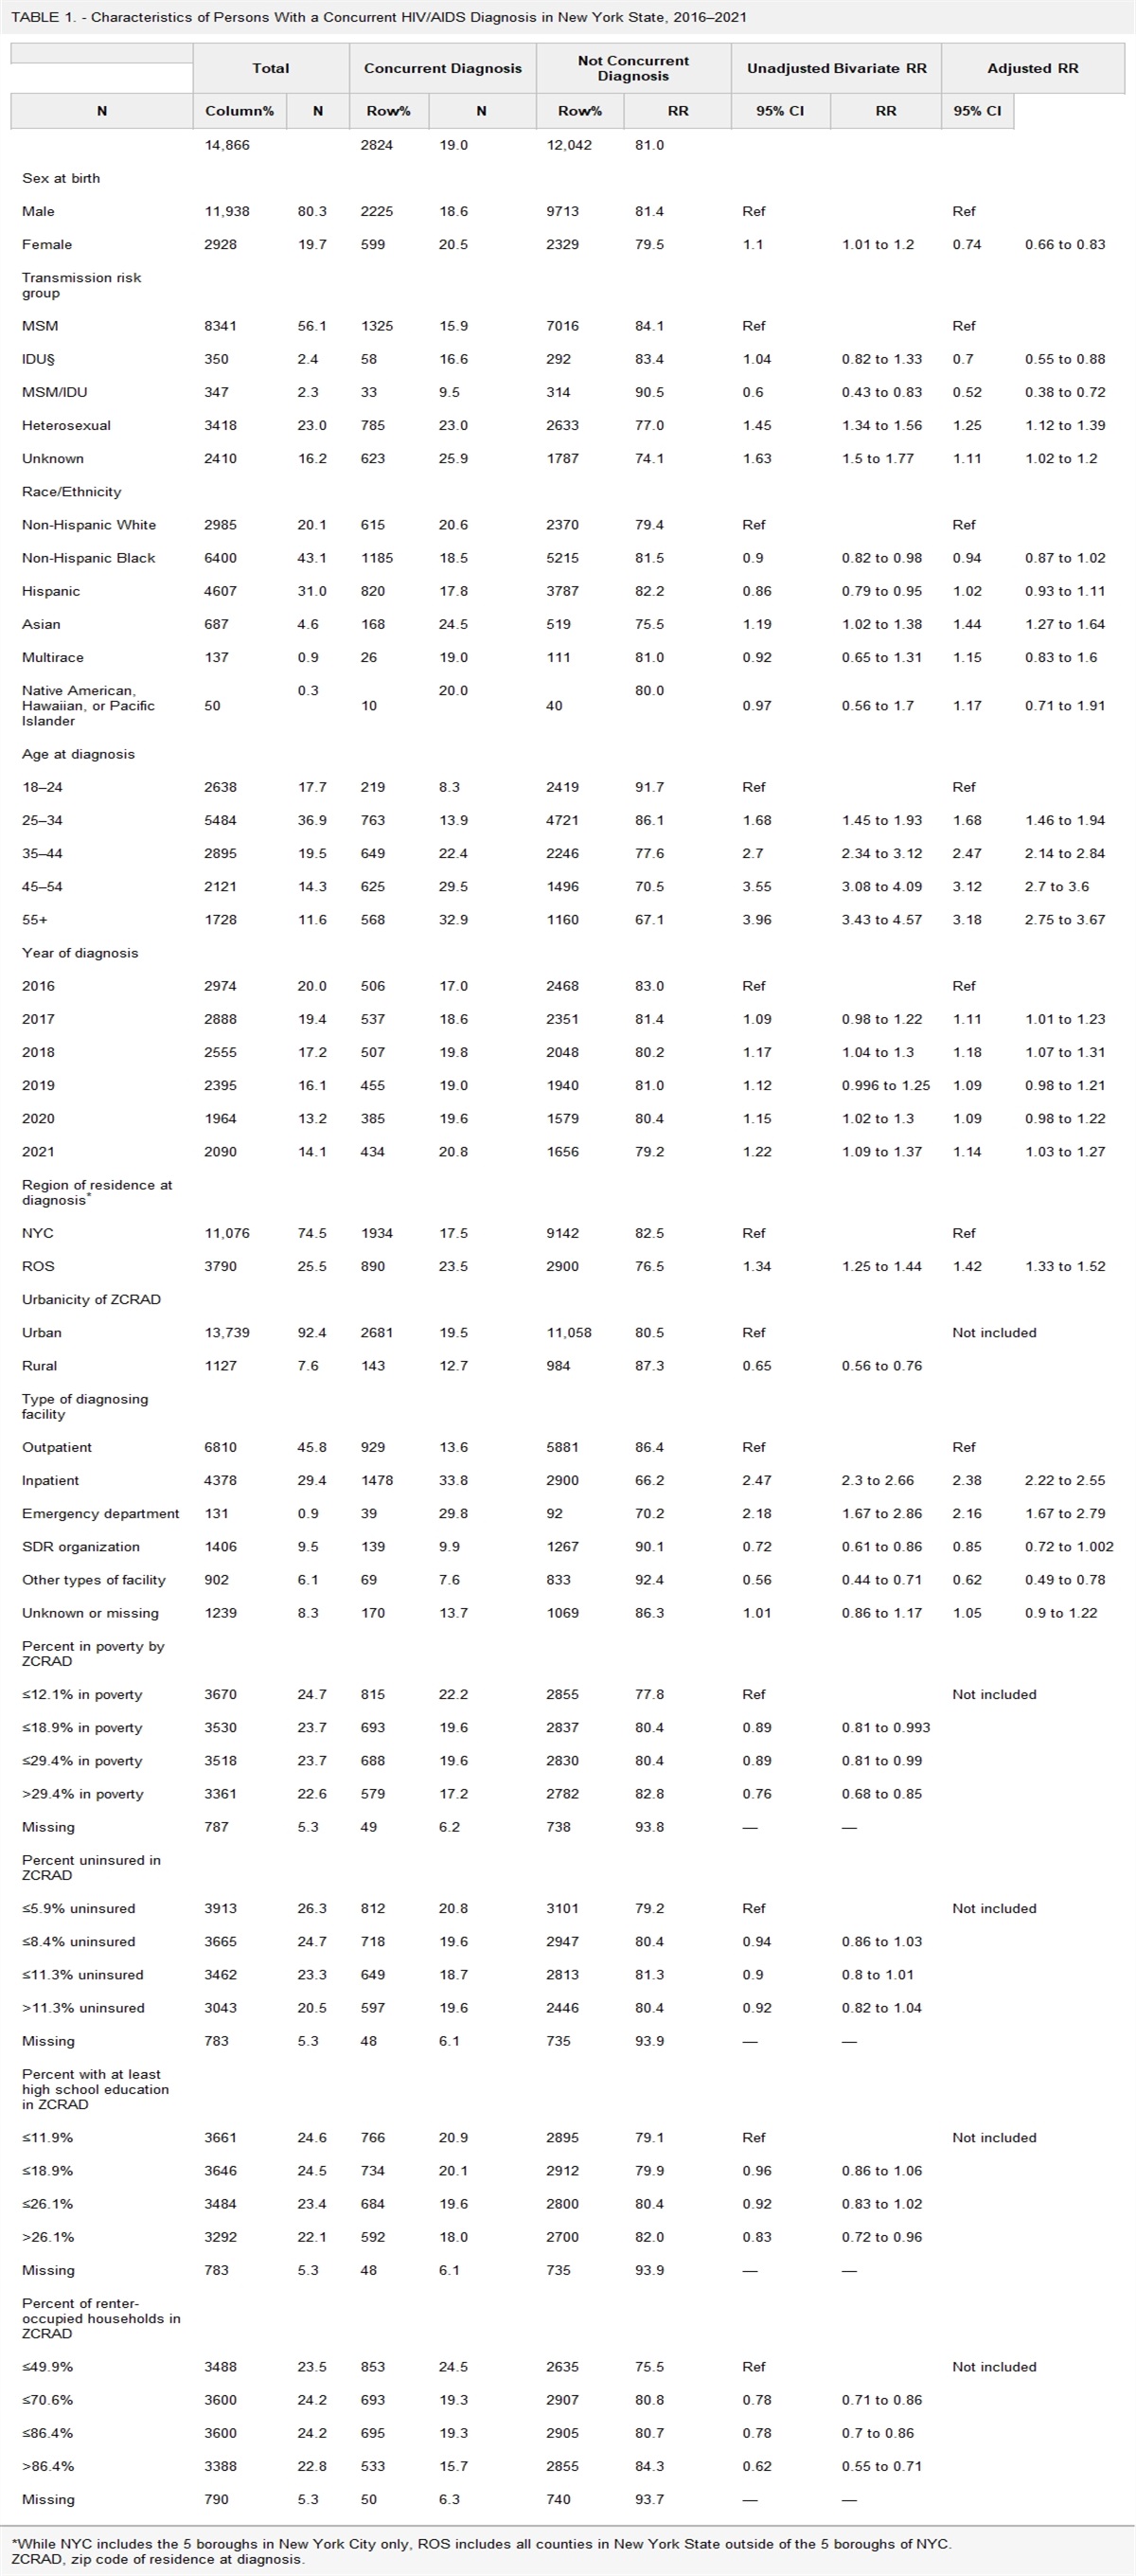
RESULTSParticipant characteristics at enrollment are presented in Table 1. A total of 3097 PLHIV aged ≥15 years were enrolled from 2013 to 2021, and 3059 with available CD4 data (98.8%) at enrollment were included in these analyses. Among those included, the median age was 38 years [interquartile range, 31–46 years], 1262 (41.3%) were men, 575 (18.8%) had a CD4 count of <200 cells per cubic millimeter, 1215 (39.7%) had WHO clinical stage 3 or 4 disease, and 2203 (72.0%) were on ART at enrollment. At the most recent visit, 8.0% of participants had a CD4 count of <200 cells per cubic millimeter; including all visits, 8.7% had a CD4 count of <200 cells per cubic millimeter.
TABLE 1. - Participant Characteristics by Country at AFRICOS Enrollment* Uganda Kenya Tanzania Nigeria Total P N 550 1586 574 349 3059 Enrollment year <0.001 2013–2014 222 (40.4%) 630 (39.7%) 157 (27.4%) 91 (26.1%) 1100 (35.9%) 2015–2016 247 (44.9%) 807 (50.9%) 218 (38.0%) 158 (45.3%) 1430 (46.7%) 2017–2021 81 (14.7%) 150 (9.5%) 199 (34.7%) 100 (28.7%) 530 (17.3%) Sex 0.48 Female 330 (60.0%) 911 (57.4%) 343 (59.8%) 213 (61.0%) 1797 (58.7%) Male 220 (40.0%) 675 (42.6%) 231 (40.2%) 136 (39.0%) 1262 (41.3%) Age, yr <0.001 15–29 150 (27.3%) 294 (18.5%) 149 (26.0%) 89 (25.5%) 682 (22.3%) 30–39 172 (31.3%) 535 (33.7%) 162 (28.2%) 133 (38.1%) 1002 (32.7%) 40–49 148 (26.9%) 454 (28.6%) 146 (25.4%) 95 (27.2%) 843(27.6%) 50+ 80 (14.5%) 303 (19.1%) 117 (20.4%) 32 (9.2%) 532 (17.4%) Education <0.001 None or some primary 339 (61.6%) 551 (34.7%) 88 (15.3%) 18 (5.2%) 996 (32.5%) Primary or some secondary 185 (33.6%) 609 (38.4%) 359 (62.5%) 74 (21.2%) 1227 (40.1%) Secondary and above 26 (4.7%) 425 (26.8%) 126 (22.0%) 257 (73.6%) 834 (27.3%) Missing 0 (0.0%) 1 (0.1%) 1 (0.2%) 0 (0.0%) 2 (0.1%) Had enough food to eat <0.001 No 122 (22.2%) 748 (47.1%) 91 (15.9%) 88 (25.2%) 1049 (34.3%) Yes 428 (77.8%) 837 (52.8%) 482 (84.0%) 261 (74.8%) 2008 (65.6%) Missing 0 (0.0%) 1 (0.1%) 1 (0.2%) 0 (0.0%) 2 (0.1%) Currently employed <0.001 No 64 (11.6%) 1248 (78.7%) 487 (84.8%) 82 (23.5%) 1881 (61.5%) Yes 486 (88.4%) 337 (21.2%) 86 (15.0%) 267 (76.5%) 1176 (38.4%) Missing 0 (0.0%) 1 (0.1%) 1 (0.2%) 0 (0.0%) 2 (0.1%) CD4 (cells/mm3), median (IQR) 421 (259–613) 416 (262–595) 327 (193–497) 448 (234–664) 401 (242–588) <0.001 CD4, cells/mm3 <0.001 <100 56 (10.2%) 111 (7.0%) 60 (10.5%) 24 (6.9%) 251 (8.2%) 100–199 46 (8.4%) 150 (9.5%) 89 (15.5%) 39 (11.2%) 324 (10.6%) 200–499 234 (42.5%) 729 (45.9%) 285 (49.7%) 139 (39.8%) 1387 (45.3%) 500+ 214 (38.9%) 596 (37.6%) 140 (24.4%) 147 (42.1%) 1097 (35.8%) WHO clinical stage <0.001 1 161 (29.3%) 367 (23.1%) 176 (30.7%) 191 (54.7%) 895 (29.2%) 2 177 (32.2%) 541 (34.1%) 140 (24.4%) 83 (23.8%) 941 (30.8%) 3 182 (33.1%) 591 (37.3%) 194 (33.8%) 60 (17.2%) 1027 (33.6%) 4 25 (4.5%) 86 (5.4%) 63 (11.0%) 14 (4.0%) 188 (6.1%) Missing 5 (0.9%) 1 (0.1%) 1 (0.2%) 1 (0.3%) 8 (0.3%) HIV diagnosis year <0.001 <2006 47 (8.5%) 123 (7.8%) 56 (9.8%) 25 (7.2%) 251 (8.2%) 2006–2009 136 (24.7%) 431 (27.2%) 130 (22.6%) 79 (22.6%) 776 (25.4%) 2010–2012 63 (11.5%) 364 (23.0%) 56 (9.8%) 67 (19.2%) 550 (18.0%) 2013–2015 198 (36.0%) 475 (29.9%) 161 (28.0%) 145 (41.5%) 979 (32.0%) 2016+ 102 (18.5%) 166 (10.5%) 167 (29.1%) 29 (8.3%) 464 (15.2%) Missing 4 (0.7%) 27 (1.7%) 4 (0.7%) 4 (1.1%) 39 (1.3%) On ART <0.001 ART naive 302 (54.9%) 297 (18.7%) 155 (27.0%) 100 (28.7%) 854 (27.9%) On ART 248 (45.1%) 1289 (81.3%) 418 (72.8%) 248 (71.1%) 2203 (72.0%) Missing 0 (0.0%) 0 (0.0%) 1 (0.2%) 1 (0.3%) 2 (0.1%) ART duration†, viral suppression status‡ <0.001 ART naive, not suppressed 287 (52.2%) 236 (14.9%) 140 (24.4%) 90 (25.8%) 753 (24.6%) <6 months, not suppressed 14 (2.5%) 51 (3.2%) 52 (9.1%) 16 (4.6%) 133 (4.3%) 6 months–<2 yrs, not suppressed 3 (0.5%) 21 (1.3%) 7 (1.2%) 2 (0.6%) 33 (1.1%) 2+ yrs, not suppressed 9 (1.6%) 95 (6.0%) 42 (7.3%) 22 (6.3%) 168 (5.5%) ART naive, suppressed 15 (2.7%) 59 (3.7%) 12 (2.1%) 9 (2.6%) 95 (3.1%) <6 months, suppressed 21 (3.8%) 179 (11.3%) 72 (12.5%) 31 (8.9%) 303 (9.9%) 6 months–<2 yrs, suppressed 56 (10.2%) 241 (15.2%) 56 (9.8%) 32 (9.2%) 385 (12.6%) 2+ yrs, suppressed 138 (25.1%) 654 (41.2%) 170 (29.6%) 140 (40.1%) 1102 (36.0%) Missing 7 (1.3%) 50 (3.2%) 23 (4.0%) 7 (2.0%) 87 (2.8%) Dysglycemia‖ <0.001 No 521 (94.7%) 1390 (87.6%) 537 (93.6%) 282 (80.8%) 2730 (89.2%) Yes 17 (3.1%) 172 (10.8%) 34 (5.9%) 65 (18.6%) 288 (9.4%) Missing 12 (2.2%) 24 (1.5%) 3 (0.5%) 2 (0.6%) 41 (1.3%) Elevated blood pressure¶ <0.001 No 519 (94.4%) 1399 (88.2%) 471 (82.1%) 295 (84.5%) 2684 (87.7%) Yes 31 (5.6%) 186 (11.7%) 100 (17.4%) 54 (15.5%) 371 (12.1%) Missing 0 (0.0%) 1 (0.1%) 3 (0.5%) 0 (0.0%) 4 (0.1%) Hypercholesterolemia# <0.001 No 488 (88.7%) 1272 (80.2%) 451 (78.6%) 261 (74.8%) 2472 (80.8%) Yes 54 (9.8%) 289 (18.2%) 119 (20.7%) 86 (24.6%) 548 (17.9%) Missing 8 (1.5%) 25 (1.6%) 4 (0.7%) 2 (0.6%) 39 (1.3%) Renal insufficiency** 0.13 No 534 (97.1%) 1561 (98.4%) 565 (98.4%) 337 (96.6%) 2997 (98.0%) Yes 7 (1.3%) 16 (1.0%) 7 (1.2%) 9 (2.6%) 39 (1.3%) Missing 9 (1.6%) 9 (0.6%) 2 (0.3%) 3 (0.9%) 23 (0.8%) Anemia†† <0.001 No 349 (63.5%) 1155 (72.8%) 440 (76.7%) 169 (48.4%) 2113 (69.1%) Yes 201 (36.5%) 431 (27.2%) 134 (23.3%) 180 (51.6%) 946 (30.9%) BMI‡‡, kg/m2 <0.001 Underweight (<18.5 kg/m2) 82 (14.9%) 203 (12.8%) 43 (7.5%) 25 (7.2%) 353 (11.5%) Normal (18.5–24.99 kg/m2) 373 (67.8%) 1039 (65.5%) 348 (60.6%) 186 (53.3%) 1946 (63.6%) Overweight (25+ kg/m2) 95 (17.3%) 344 (21.7%) 183 (31.9%) 138 (39.5%) 760 (24.8%)*This analysis includes data for 3059 participants with available CD4 data at enrollment.
†ART duration was ascertained before CD4 measurement at enrollment. Participants enrolled were either ART naive or already on ART.
‡VL suppression defined as VL <1000 copies per milliliter.
§ART naive and VL suppressed included ARV-naive participants with VL <50 copies per milliliter or VL load ≥50 and <1000 copies per milliliter, for 2 consecutive visits.
‖Dysglycemia was defined as a fasting glucose >99 mg/dL, nonfasting glucose >199 mg/dL, or receipt of hypoglycemic medications.
¶Elevated blood pressure was defined as a systolic blood pressure measurement of >139 mm Hg, a diastolic blood pressure measurement of >89 mm Hg, or receipt of antihypertensive medications, with abnormal blood pressures repeated for confirmation during the study visit.
#Hypercholesterolemia was defined as a total fasting cholesterol of >199 mg/dL or receipt of lipid-lowering medications.
**Renal insufficiency was defined as an estimated glomerular filtration rate <60 mL/min/1.73 m2.
††Anemia was defined as hemoglobin of <13 g/dL for men or <12 g/dL for women.
‡‡BMI was categorized as underweight (<18.5), normal (18.5–24.9), or overweight (≥25).
Bold entries correspond to factors significantly associated witth CD4 <200.
Across all countries at study visits, the prevalence of CD4 count of <200 cells per cubic millimeter declined from 2013 (10.5%) to 2021 (3.1%) (P < 0.001) and peaked in 2014 (19.1%) (Fig. 1, Table 1, Supplemental Digital Content, https://links.lww.com/QAI/C233). Overall, by UTT era, the prevalence of CD4 count of <200 cells per cubic millimeter declined from a peak in 2013–2014 (14.1%) to 2015–2016 (12.5%) and nadired in 2017–2021 (6.5%). Across all 4 countries, the overall AHD prevalence for the 2017–2021 era differed significantly from the earlier 2 eras (P < 0.001) (Fig. 2). Across all countries, the prevalence of CD4 count of <200 cells per cubic millimeter declined across all 3 eras (P = 0.001); country-specific differences are shown in Figure 3. The prevalence was lowest in Uganda across all eras (Fig. 3). Across all countries at study visits, ART use increased from its lowest in 2013 (80.2%) to 2021 (100%) (P < 0.001, Fig. 1); however, few new participants were enrolled in 2020 (n = 21) because of the COVID-19 pandemic.
 FIGURE 1.:
 Trends in percentage of visits in participants with CD4 <200 cells per cubic millimeter and ART use by country and year at each study visit.
 FIGURE 2.:
 Prevalence of AHD at AFRICOS Study visits by test and treat era, all countries.
 FIGURE 3.:
 Prevalence of AHD at AFRICOS Study visits by test and treat era, by country.
ComorbiditiesAmong all participants at enrollment (n = 3059), 946 (30.9%) had anemia, 548 (17.9%) had hypercholesteremia, and 371 (12.1%) had elevated blood pressure. Elevated blood pressure, hypercholesterolemia, anemia, and being underweight or normal weight were significantly more common among those with a CD4 count of <200 cells per cubic millimeter compared with those with a CD4 ≥200 cells per cubic millimeter (P < 0.01). Among the 575 participants with CD4 count of <200 cells per cubic millimeter at enrollment, 551 (95.8%) received serum CrAg testing at enrollment and 16 (2.9%) were CrAg positive—12 (75%) with a CD4count of ≤100 cells per cubic millimeter and 4 (25%) with a CD4 count of 100–199 cells per cubic millimeter.
Factors Associated With CD4 count of <200 cells per cubic millimeterFactors associated with CD4 count of <200 cells per cubic millimeter at study visits are presented in Table 2. In the adjusted model, factors associated with higher odds of CD4 count <200 cells per cubic millimeter at study visits were male sex, enrollment in Kenya, Tanzania, and Nigeria (compared with Uganda), having at least a primary education or higher (compared with none or some primary education), HIV diagnosis eras 2013–2015 or after 2016 (compared with before 2006), dysglycemia, anemia, and WHO stage 2 disease or higher (compared with stage 1). As compared with participants aged <30 years, odds of CD4 <200 cells per cubic millimeter were higher for those aged 30–39, 40–49, and 50+ years. As compared with being ART naive and not VLS, odds of CD4 count of <200 cells per cubic millimeter were lower for those on ART for 2+ years and not VLS and those on ART (regardless of the duration) and VLS; among ART duration/suppression combinations, the lowest odds of CD4 count of <200 cells per cubic millimeter was associated with being on ART for 2+ years and VLS. Being normal weight or overweight (compared with being underweight) also reduced the odds of CD4 count of <200 cells per cubic millimeter.
TABLE 2. - Factors Associated With CD4 Unadjusted OR 95% CI Adjusted OR* 95% CI Sex Female Ref — — — Male 2.08 1.75–2.47 1.56 1.29–1.89 Age, yr
留言 (0)