
記住我

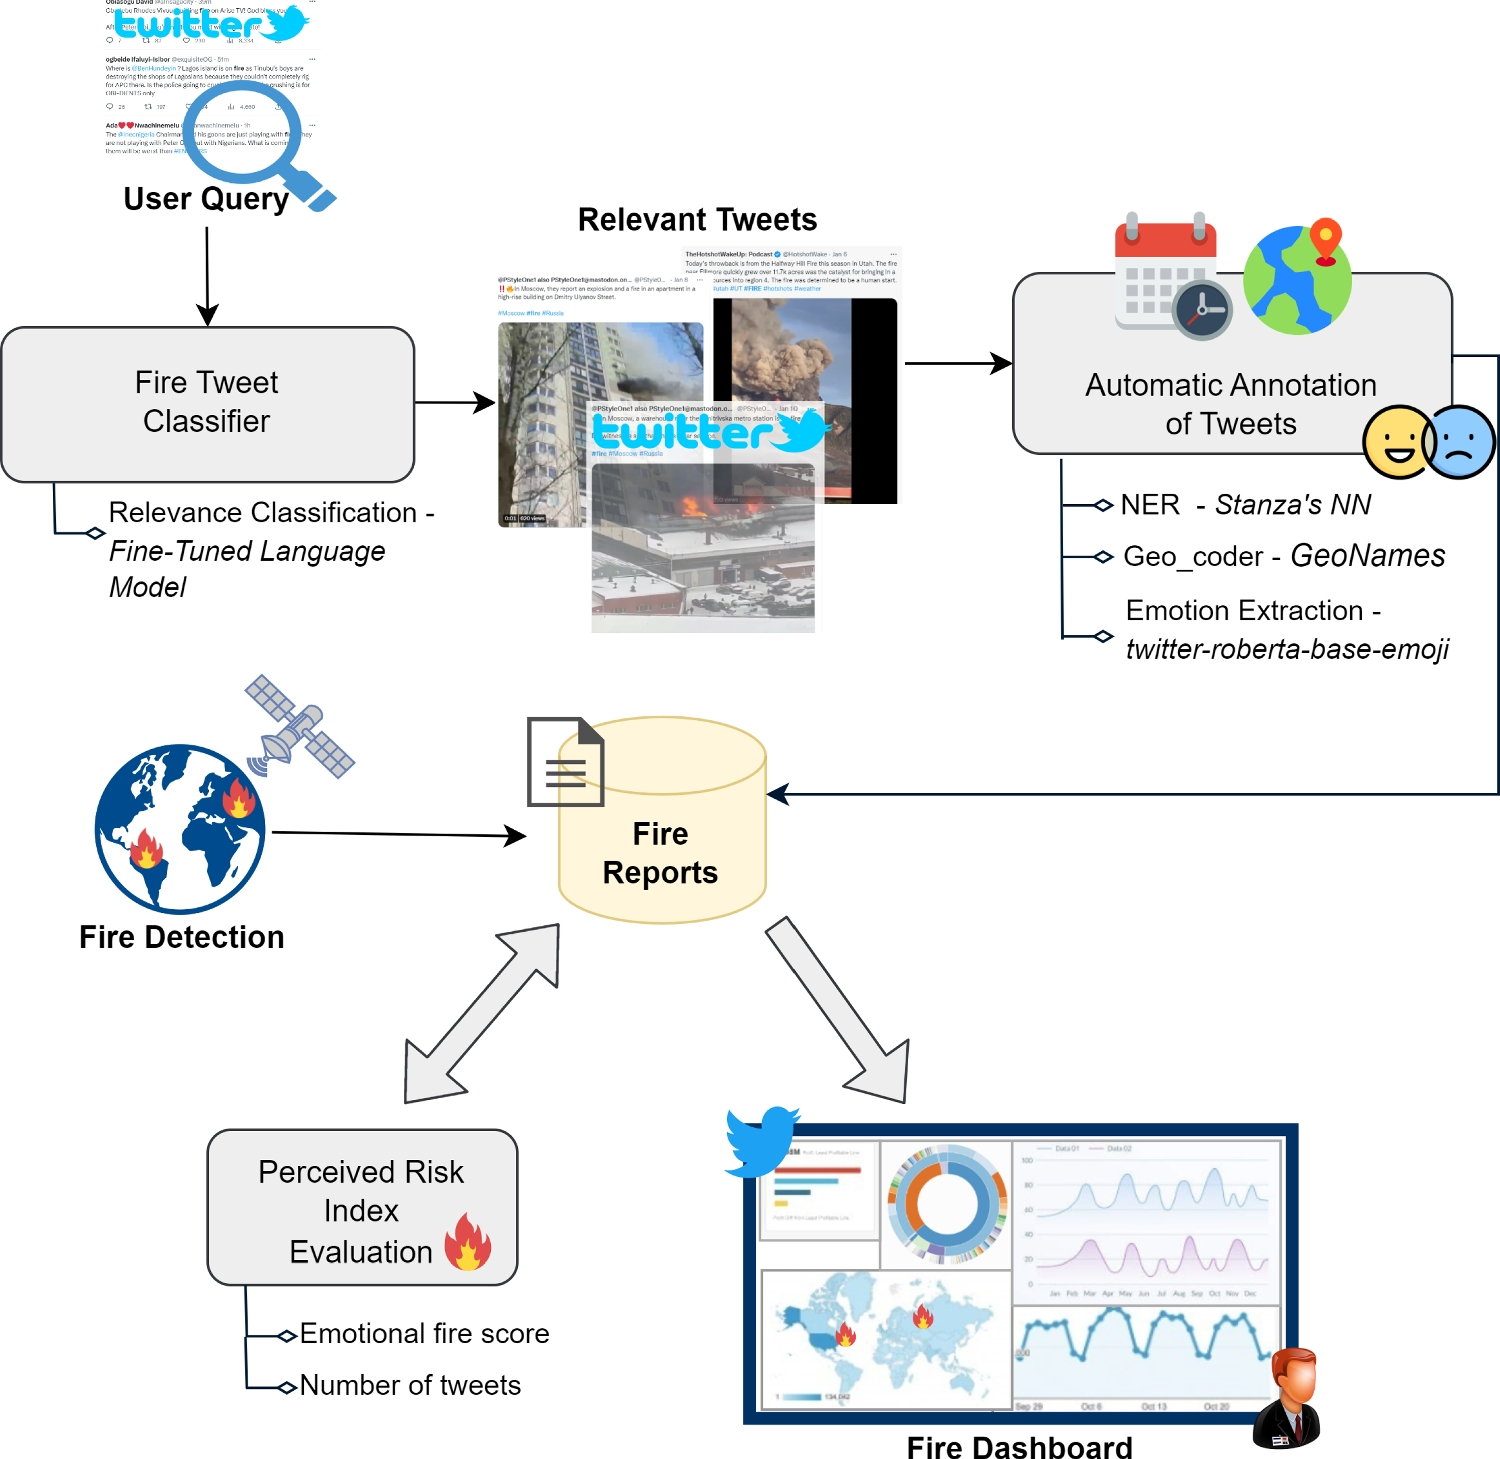


The proposed solution constructs a monitoring framework that gives experts awareness of ongoing fires by cross-relating open-source information coming from satellite and social media. The system acquires and extracts information and processes data to provide experts, through an interactive dashboard, with a summary of potentially dangerous situations regarding fire events. Finally, an assessment of a Perceived Risk Index, derived from the posted tweets, offers experts an indicator of event severity.
The process, outlined in Fig. 1, consists of the following steps:
1.Twitter Crawler: Employing the Twitter API, a crawler retrieves tweets based on a user-specified search query (e.g., “fire”);
2.Fire Tweet Classifier: In this phase, incoming tweets are classified to filter relevant ones (i.e., tweets actually reporting a fire) through an ad-hoc model fine-tuned during the experimentation of the proposal;
3.Tweet Annotation: During this phase, relevant tweets are automatically processed to extract additional information regarding the place and date of the fire and the emotions expressed in the text. In particular, Neural Networks at the state-of-the-art are exploited for Named Entity Recognition, a fine-tuned roBERTa model extracts emoji and their score from tweet content, and GeoNames is adopted for the geolocalize the warning in the tweet.
4.Fire Detection: The system constantly retrieves additional information from distributors of active fire data, exploiting satellite sensors.
5.Fire Reports Database: All collected tweets and their metadata are stored within the Fire Reports database.
6.Perceived Risk Index: This stage, involving geographic data and specific time intervals, exploits matching tweets to evaluate a Perceived Risk Index. It measures people’s perceptions about active fires, giving experts an idea of the seriousness of fire from the users’ point of view.
7.Interactive Fire Dashboard: This component allows experts to monitor specific areas or at-risk situations in a user-friendly, interactive interface.
Fig. 1
Overall Process. Tweets collected by the crawler are classified and, if relevant, automatically annotated. Then, they are cross-related with data from satellites. Finally, a Perceived Risk Index is evaluated, and all information is provided on an interactive dashboard
Twitter CrawlerTo realize the crawler, Twitter API,Footnote 2 which enables programmatic access to Twitter, is accessed through the Python library Tweepy.Footnote 3 It is adopted to request tweets in real time. API also catches additional data such as retweets, replies, likes, and special contents (e.g., images) of any tweet the query finds.
Fire Tweet ClassifierFor the Fire Tweet Classifier construction, a language model is fine-tuned through a fire dataset. The objective is to construct a classifier to distinguish between generic tweets and tweets reporting fires. A bert-base-uncased modelFootnote 4 [36] is trained and tested through three wildfire datasets from the “Disaster Tweet Corpus 2020Footnote 5”. In particular, training and test sets were constructed (with a percentage of 70 and 30, respectively) by randomly selecting tweets contained in the following datasets:
Wildfire-australia-2013
Wildfire-california-2014
Wildfire-colorado-2012
The Disaster Tweet Corpus 2020 dataset consists of tweets collected during 48 disasters over 10 disaster types, with human annotations denoting if a tweet is related to such disaster or not [37]. In particular, datasets contain 6440 tweets, of which one-half refers to fires and the other does not.
Training has been done through the following hyperparameters: batch size of 16; learning rate of \(5e^\); AdamW optimizer; 2 epochs.
Tweet AnnotationTweet Annotation aims to extract useful information from collected tweets, such as geo-localization, time, emotions, and so on. Actually, the date is associated with the creation timestamp of the tweet; for the location, there are two ways to obtain it: (i) via the geo-tag (attached coordinates or place identifier) when available and (ii) by searching places mentioned in the text, through a NER (Named Entity Recognition) process. The locations mentioned in the text undergo geocoding to obtain the relative coordinates. If no place is found in a tweet, it is discarded.
As mentioned, the Tweet Annotation subphase passes through a Natural Language Processing pipeline that extracts the location mentioned within the tweet content and the associated expressed emotions. For the first goal, the adopted Python library is StanzaFootnote 6: a collection of tools for the linguistic analysis of many human languages [38]. Named entities of interest for the proposed system are locations (e.g., addresses, cities, counties) and GeoPolitical Entities (GPE) such as States. Whenever the NER extracts more than one geographical entity, the corresponding tweet is discarded. Moreover, a call to the GeoNames WebserviceFootnote 7 (through the GeoPy libraryFootnote 8) allows us to detect its coordinates for each extracted entity. Given a location name, GeoNames searches for it and returns a detailed data structure containing geographical information (e.g., latitude and longitude). In case multiple locations are found via this process, only the first result (the most likely) will be considered for the given query.
The extraction of emotions from tweets exploits the emoji extraction implemented by the twitter-roberta-base-emojiFootnote 9 transformer model. The model predicts 20 emojis and their scores (in the range \([0-1]\)) [39]. Predicted emojis and their score, particularly the fire one, are added to stored reports. The framework exploits the fire emotional score to measure the perceived user’s emotion associated with the fire event.
Fire DetectionThe Fire Information for Resource Management System (FIRMS)Footnote 10 collects active fire data. FIRMS distributes Near Real-Time (NRT) active fire data from the Moderate Resolution Imaging Spectroradiometer (MODIS) aboard the Aqua and Terra satellites and the Visible Infrared Imaging Radiometer Suite (VIIRS) aboard S-NPP and NOAA 20 (formally known as JPSS-1). Globally, these data are available within 3 h of satellite observation, but active fire detection is available in real-time for the US and Canada. Data collected by FIRMS, available to download in a structured format, contains information such as latitude, longitude, brightness, satellite, instrument, and acquiring date.
Requests to FIRMS are made through the official API.Footnote 11 Uncoupled from the tweet retrieval, the system restarts the satellite collection every 30 min. Then, new satellite observations are matched with stored fire reports (not yet validated) through places and times. The geographical match exploits Eq. 1, while the time matching considers a match between days. When a match is found, the corresponding fire report (i.e., the set of tweets referencing the same fire event) is considered “validated”, and the level of intensity of fire (i.e., the reported brightnessFootnote 12) is associated with it. In particular, items corresponding to tweets just validated are updated, and the corresponding brightness is stored.
The matching between places is made by evaluating the distance between their coordinates leveraging the Haversine formula [40]. It is a mathematical formula used to calculate the distance between two points on the surface of a sphere, given their latitudinal and longitudinal coordinates. It is commonly used in navigation and geolocation applications, especially in calculating distances on the Earth. Following its formal definition:
$$\begin & hav(\Theta ) = hav(\phi _2 - \phi _1) + \cos (\phi _1)\cos (\phi _2)hav(\lambda _2- \lambda _1)\\ & hav(\Theta ) = \sin ^2\left( \frac\right) = \frac \end} \end$$
(1)
where
\(\phi _1\) and \(\phi _2\) are latitudes of the first and second point, respectively;
\(\lambda _1\) and \(\lambda _2\) are longitudes of the first and second point, respectively;
\(\theta\) is the central angle formed by the two points and the center of the Earth.
Regarding time, tweets and satellite observations match when the reference date is the same, regardless of time.
Fire Reports DatabaseEvery tweet and fire information extracted is stored in an Apache SolrFootnote 13 index. Apache Solr is an open-source enterprise-search platform with REST-like API. Solr stores the documents in structures called cores. Every core has its schema, which defines data types for every field and indexing and querying functionalities. The core used for the proposed system stores documents consisting of the following fields:
id: Solr identifier for the specific document (representing a tweet): is unique and automatically generated at the document creation;
\(id\_tweet\): identifier of the tweet associated with the document;
text: text content of the tweet.
user: author of tweet;
\(retweet\_count\): number of retweets for the given tweet;
\(favorite\_count\): number of likes expressed for the given tweet;
\(retweeted\_tweet\): identifier of the retweeted tweet (if the given tweet is a retweet);
entities: entities extracted by the NLP from the tweet content;
emotions: type of emotions and their scores extracted from the tweet text and expressed as follows: \(emotionType_1: score_1\), \(emotionType_2: score_2\), \(\dots\);
coordinates: geolocalization of the tweet (extracted from the tweet metadata or its text), expressed in the “Latitude, Longitude” format;
date: tweet creation timestamp;
bright: level of brightness (i.e., intensity) of fire detected by the satellite on the same date and place;
firms: boolean value stating if a satellite detection has validated the report (i.e., the satellite has also detected the fire event).
The store component containing fire reports has been implemented through the Python library pysolr.Footnote 14
Perceived Risk Index EvaluationThe definition of the Perceived Risk Index (PRI) derives from a preliminary analysis of tweet aspects’ influence. In particular, a Multiple Linear Regression (MLR) has been done to determine a dependency between the brightness value (i.e., the fire strength or intensity) detected by the satellite and information from Twitter. The emotional fire score, number of retweets and likes, and the total number of tweets in the same day are associated with each detected tweet. The level of brightness is the dependent variable; the objective is to understand what tweet features (as independent variables) affect the fire intensity. The adopted dataset is the same as Fire Tweet Classifier training (see the “Fire Tweet Classifier” section). Results of the linear regression, shown in Table 1, register an \(R^2\) of 0.72. They affirm that with a level of significance \(\alpha =0.05\), the emotional fire score and the total number of tweets are relevant features for predicting a fire event intensity level. The same cannot be said for the number of retweets and likes. It follows that the Perceived Risk Index should exploit the number of tweets and the fire event intensity level. So, by defining a decay function \(\delta _t\) as follows:
$$\begin \delta _t = 2^)} \end$$
(2)
where:
\(\lambda\) is a decay factor in \([0-1]\);
t is the current instant;
\(t_\) is the instant of the last valid tweet.
The PRI for the g geographical area, at time t, is assessed through the following equation:
$$\begin = s_} * |T| * \delta _t} \end$$
(3)
where:
T is the tweet set for a given geographic area and date, posted by different users;
\(s_\) is the emotional fire score of tweet tw;
|T| is the cardinality of T.
The decay function needs to align the intensity of PRI to the real evolution of fire. In particular, it guarantees a gradual PRI decrease when the tweet stream slows down.
After an empirical analysis of results on the evaluated datasets, the Perceived Risk Index value can be interpreted as follows:
\(Perceived\_Risk\_Index < 50\) corresponds with low risk;
\(50< Perceived\_Risk\_Index < 500\) corresponds with a moderate risk;
\(Perceived\_Risk\_Index \ge 500\) corresponds with a high risk.
Table 1 Regression resultsInteractive Fire DashboardData contained in Solr is available through a dashboard realized with Banana,Footnote 15 a Solr plugin. From the dashboard, it is possible to filter reports and get every information about them, such as tweets generating the report and the intensity score. The dashboard also includes a map to show reports geographically based on their coordinates. In particular, the user can specify a query and a time period to search for reports (Fig. 2). Results are exposed in a table and graphical form and through a map, highlighting reports through a marker corresponding with their position. Markers change based on the number of detected fires and their intensity, as depicted in the example in Fig. 3).
Fig. 2
Detail of query and filter panels. The dashboard filters fire messages based on query input
Fig. 3
Detail of map panel. Fire messages are made more visible on the map, highlighting the fire intensity
留言 (0)