
記住我
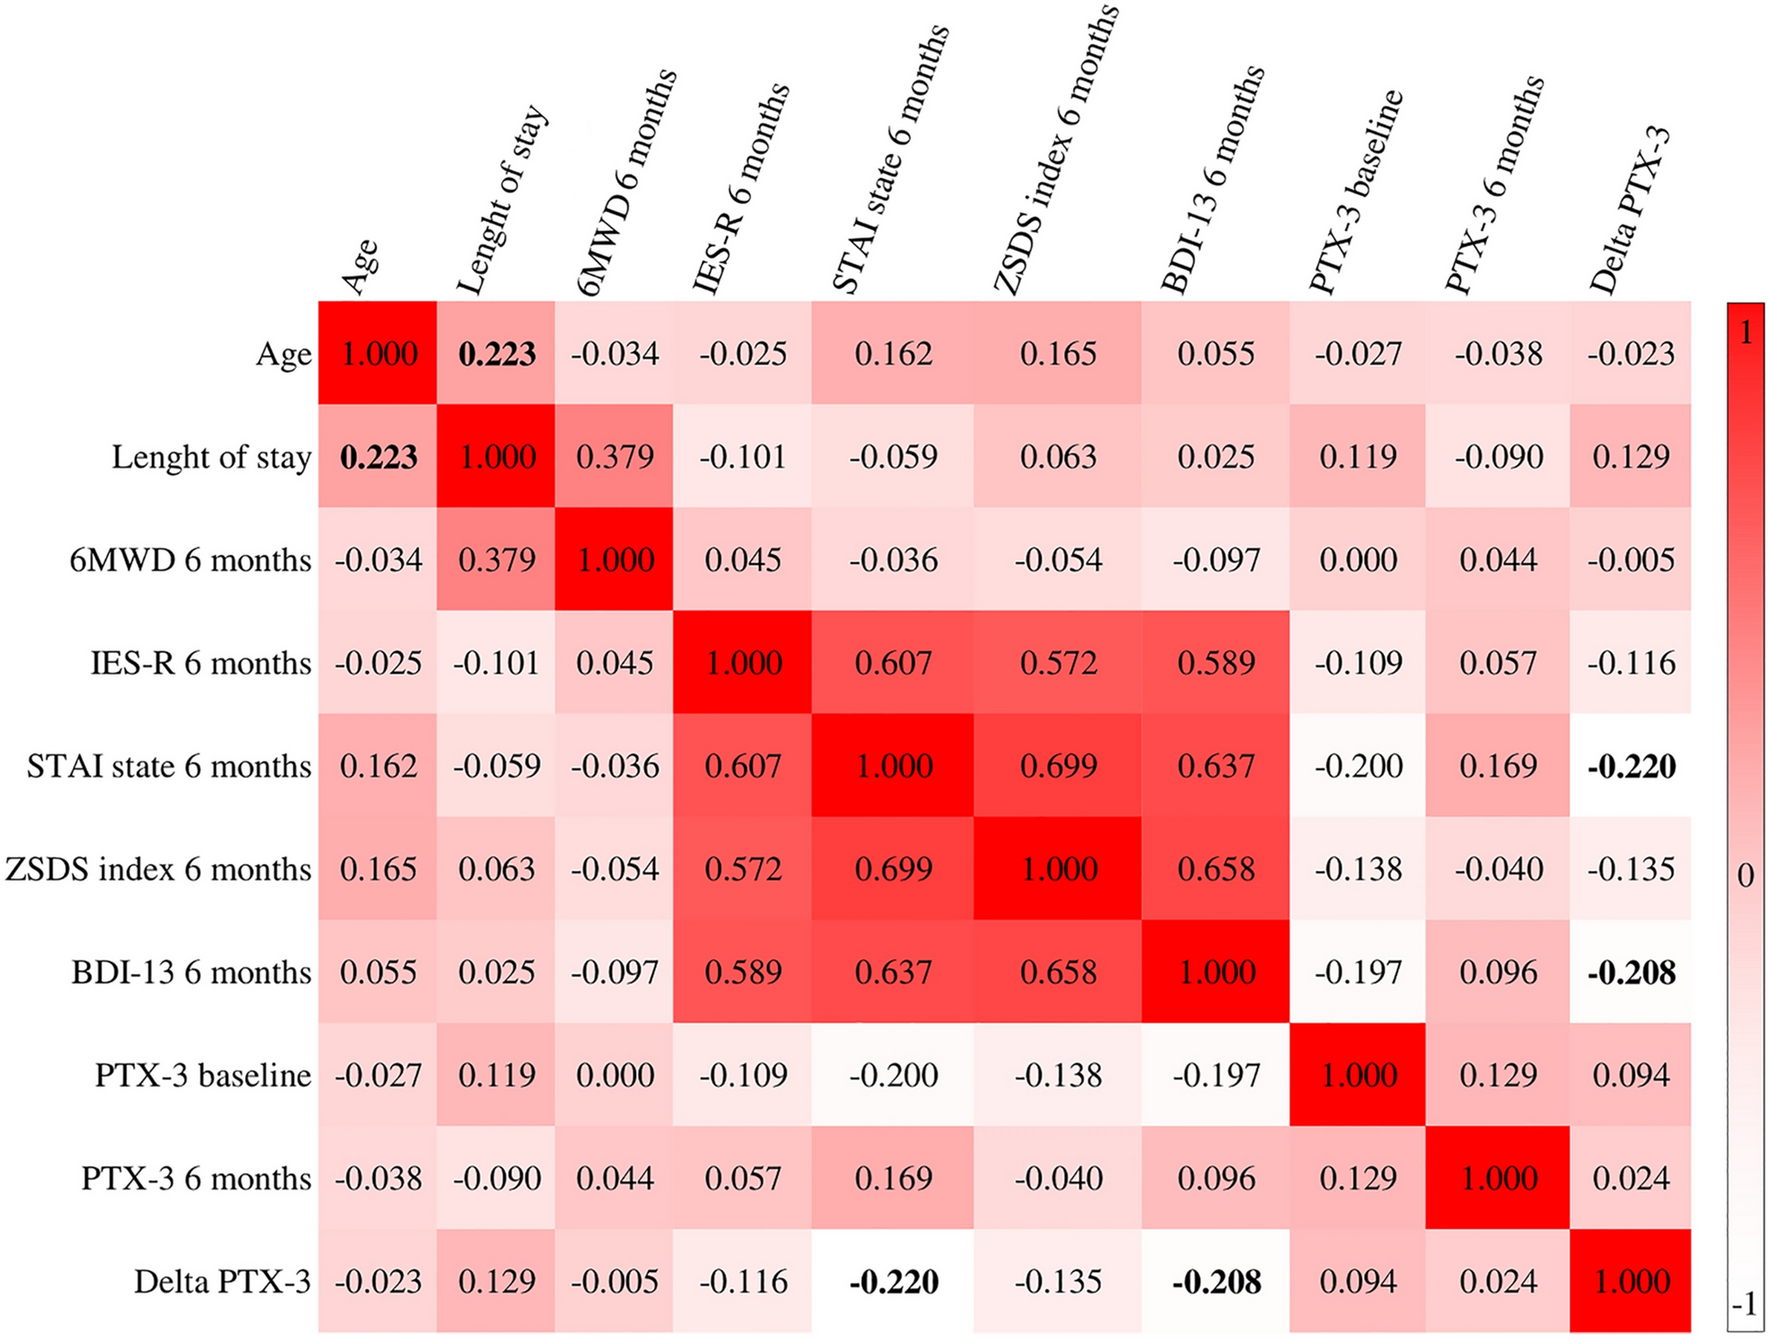
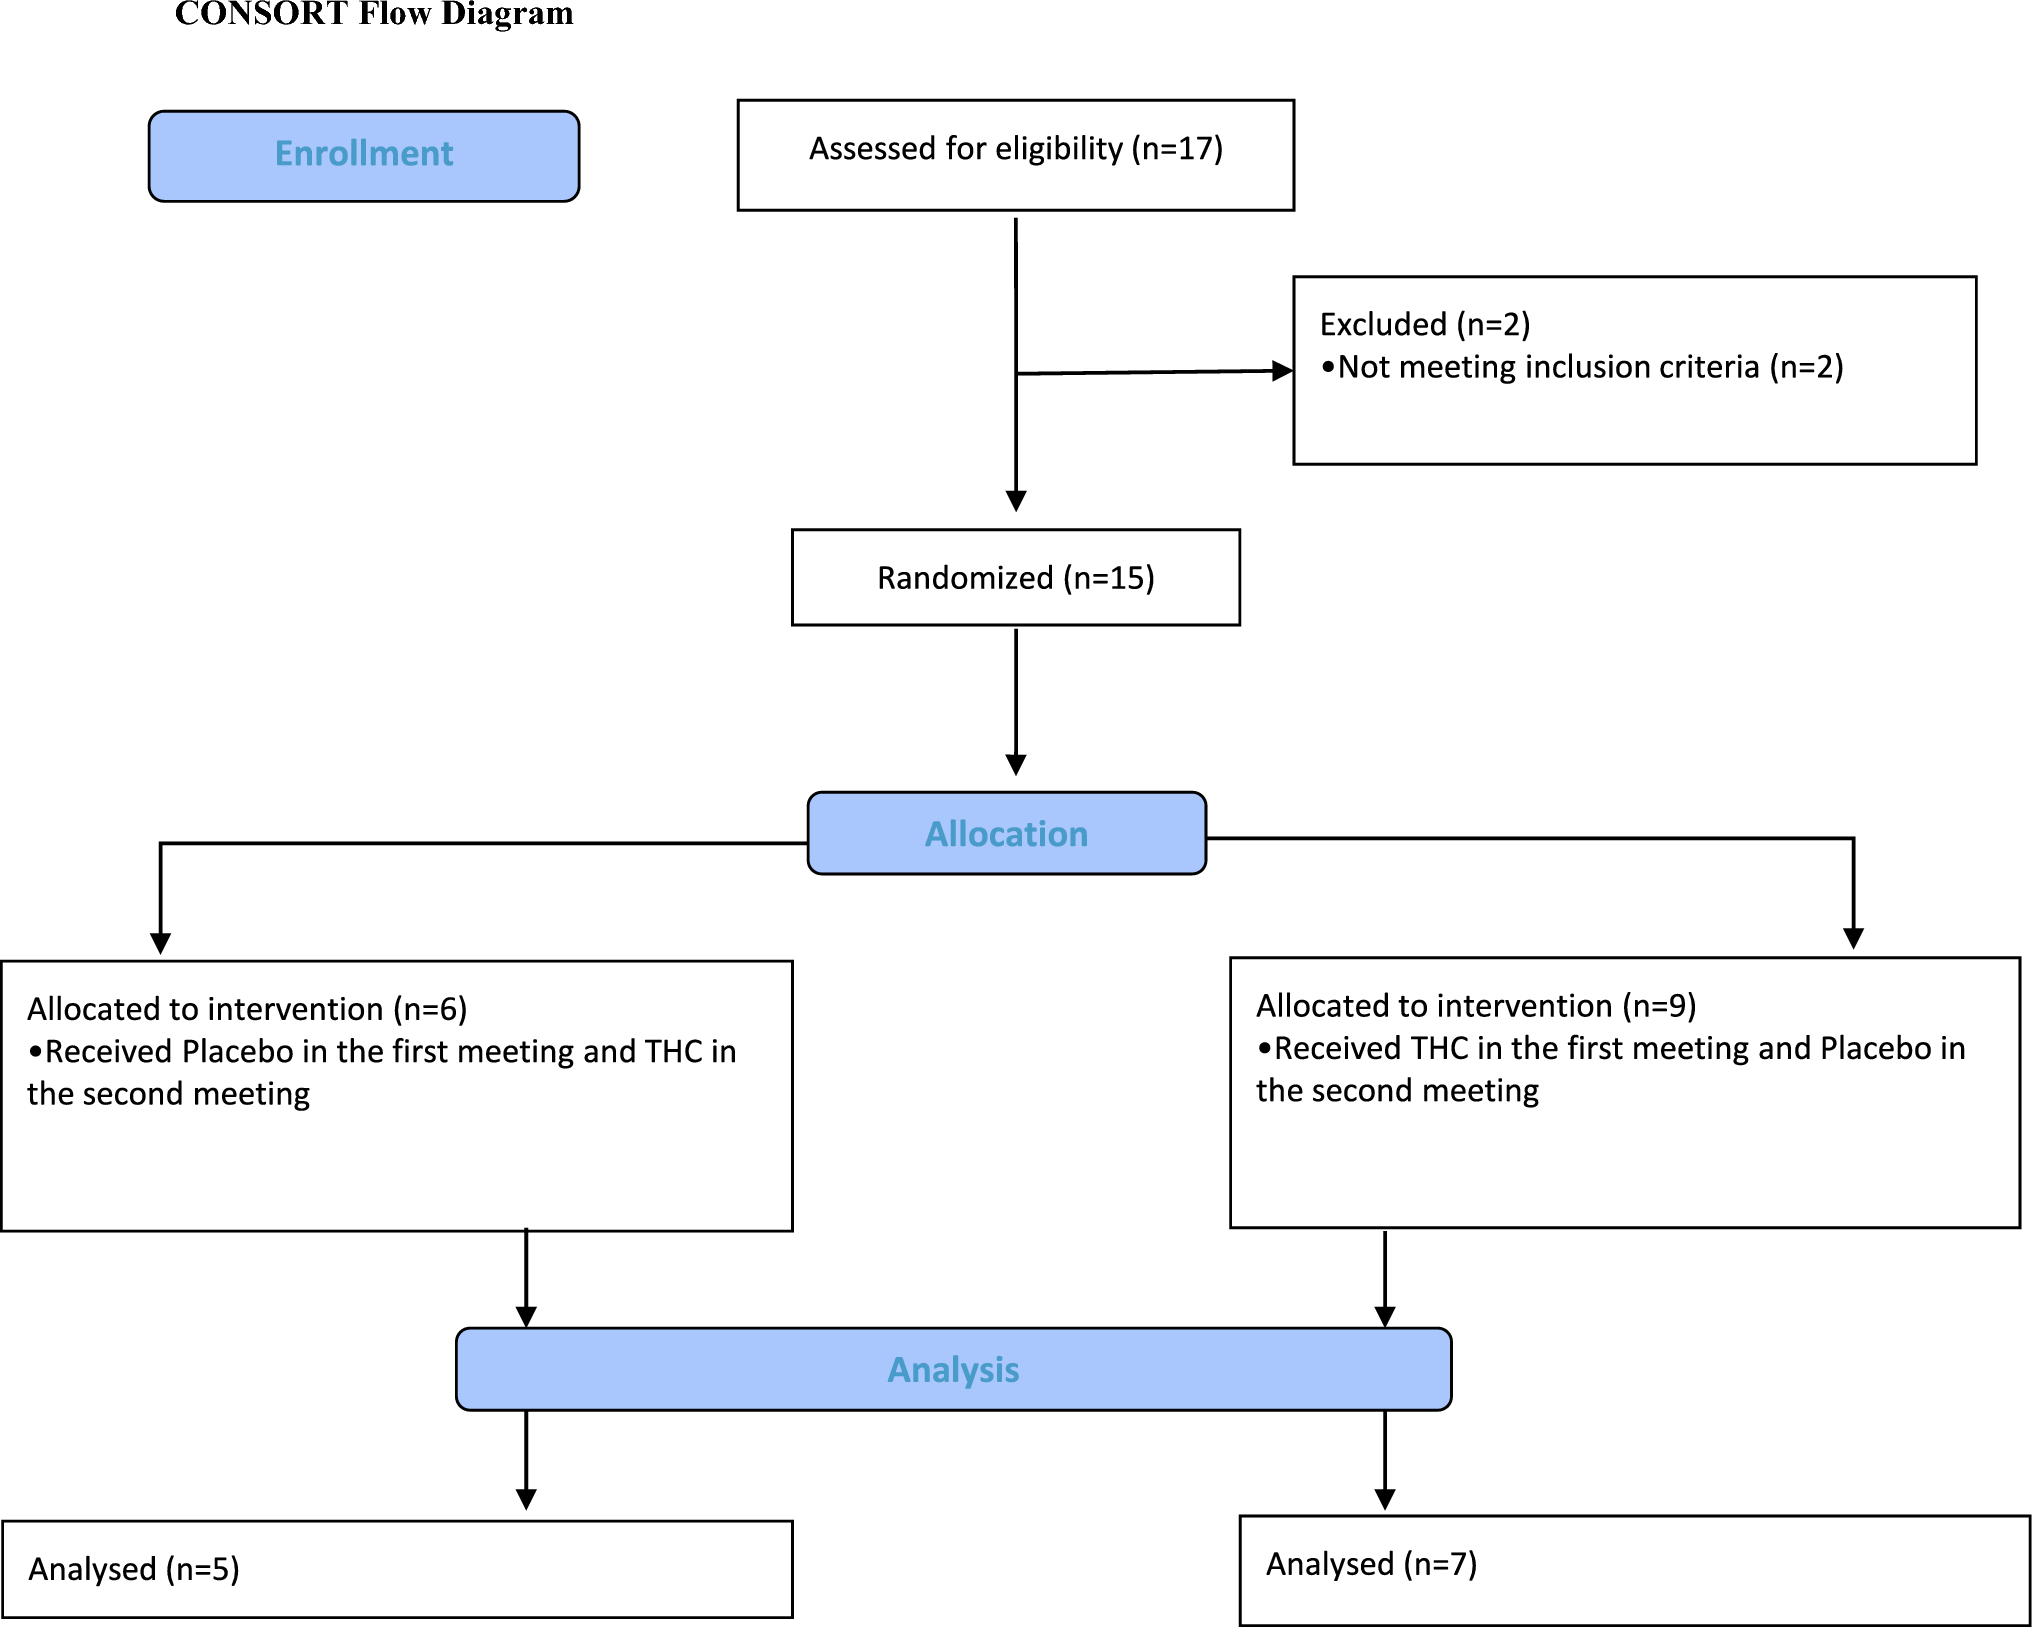
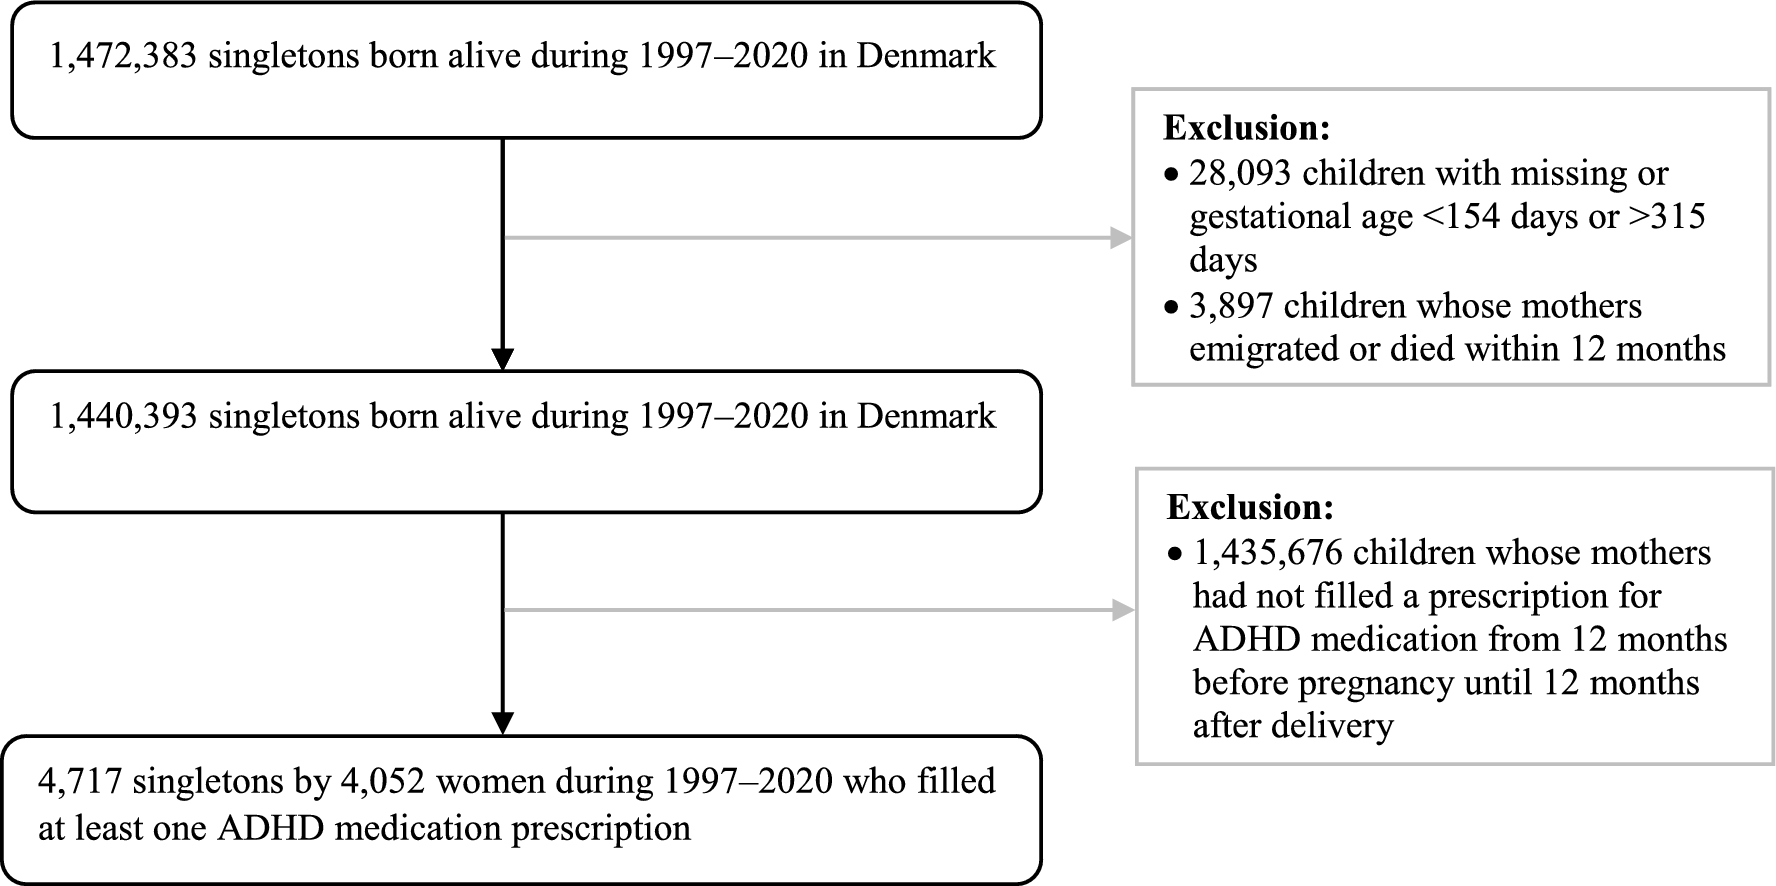
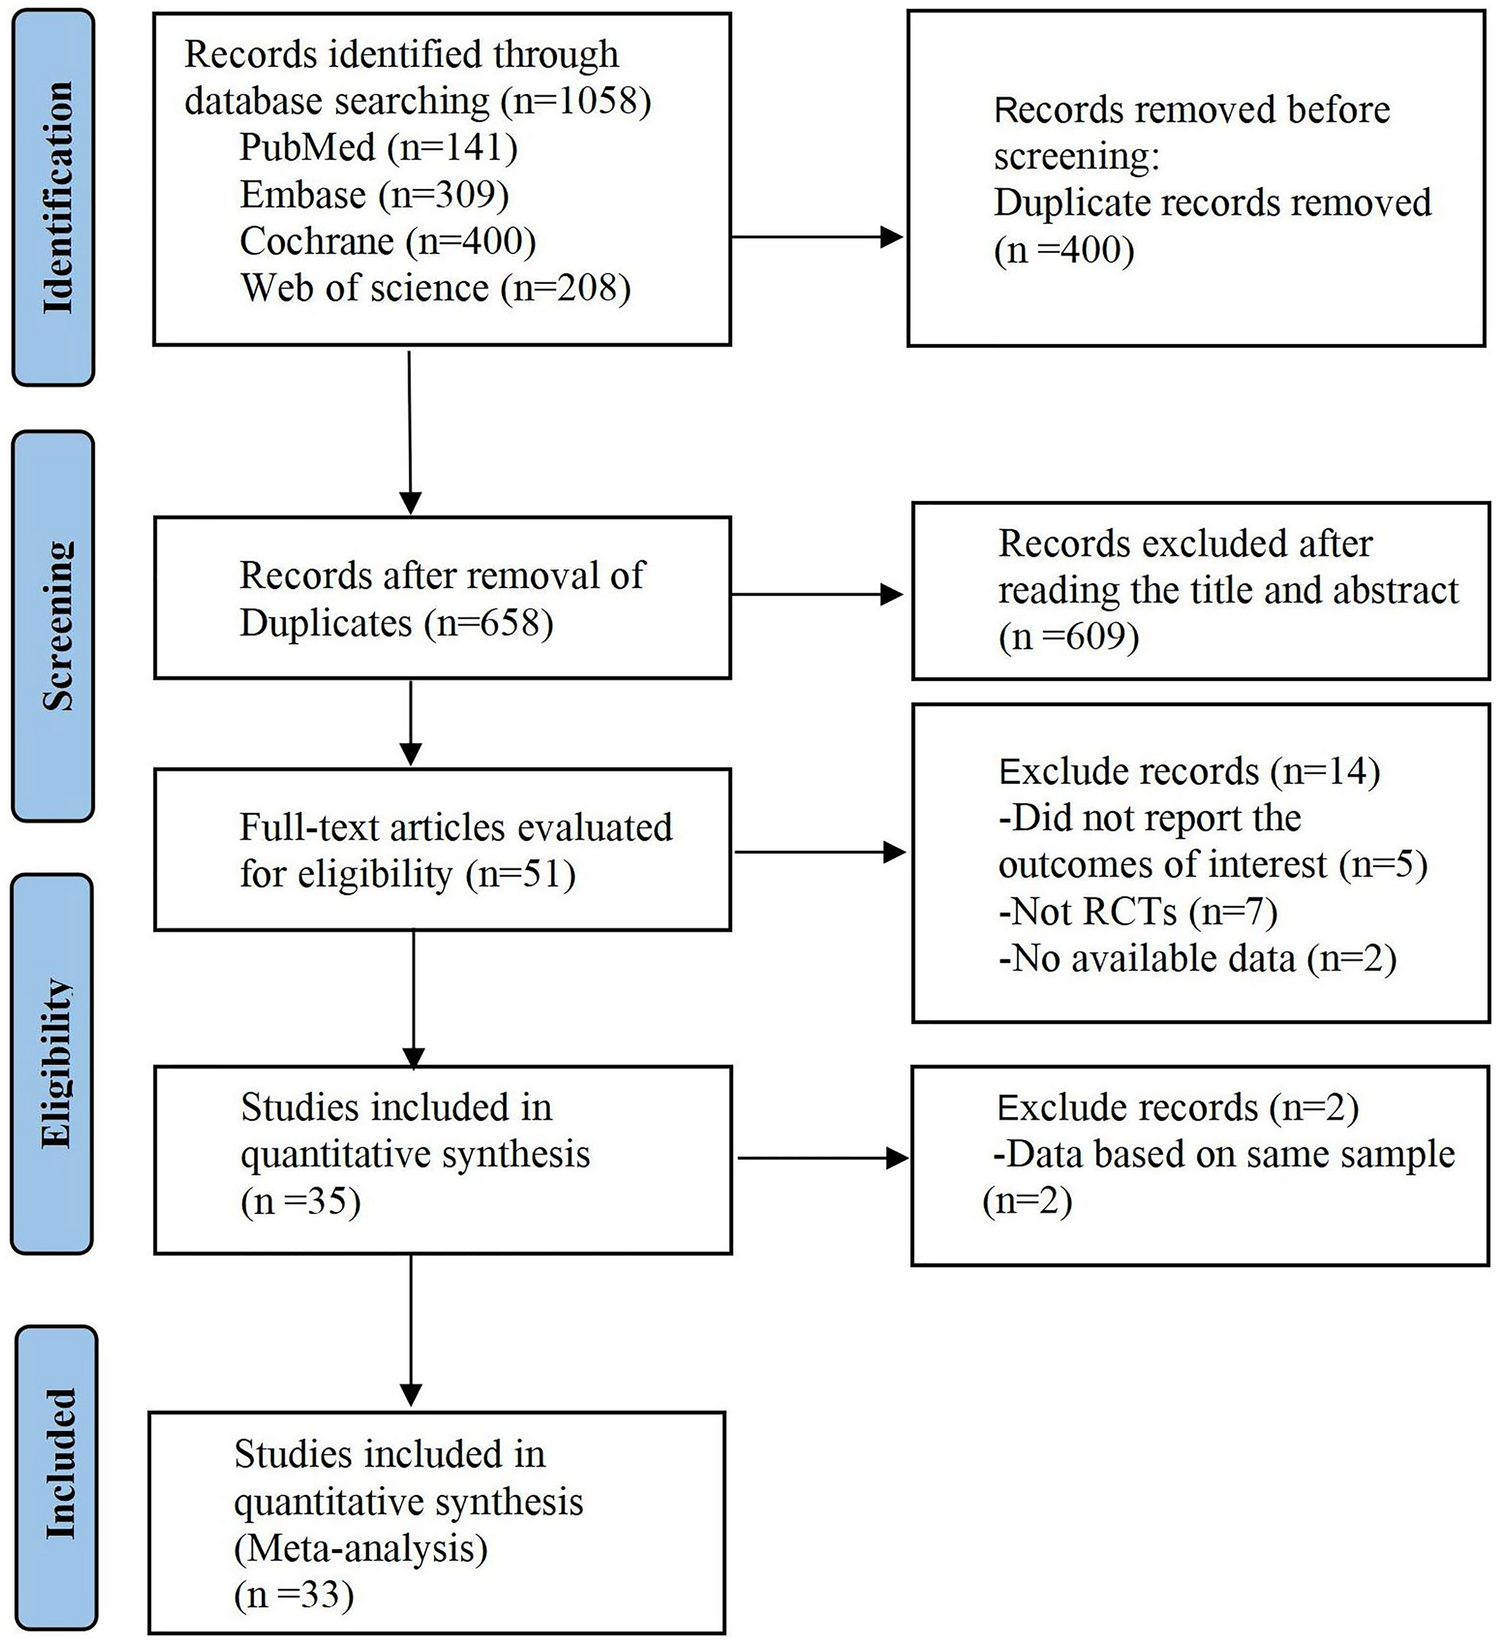
Patients were recruited by their treating physicians from the Institute of Pain Medicine, Tel-Aviv Sourasky Medical Center. Inclusion criteria were established neuropathic lower limb radicular pain for over 6 months and medium to high chronic pain (over 40 on a 100-point visual analog scale), with no other significant comorbidities or chronic pain syndromes. Women were excluded due to evidence that menstruation-related hormonal fluctuations may alter pain sensitivity and ANS regulation [35, 36]. Seventeen male participants provided written informed consent to be included in this study. Two participants were excluded because, on further examination, they did not fulfill the inclusion criteria. Three participants were not included in the final analyses due to data acquisition problems. Twelve patients with chronic lumbar radicular pain completed the study (27–40 years of age, mean age 33.9 ± 3.6 years, all males). Importantly, all patients were cannabis-naïve based on direct questioning, although we did not conduct a toxicological screening prior to participation. Full data for two participants of the CPM part were not completed and therefore they were excluded from the CPM analysis. Participants’ demographic and clinical data, as well as detailed inclusion and exclusion criteria, are available in Appendix Tables 1a and 1b. The study was approved by the Tel-Aviv Sourasky Medical Center Institutional Review Board (Clinical Trial Registration: clinicaltrials.gov/study/NCT02560545). The CONSORT diagram is shown in Fig. 1.
Fig. 1
Study CONSORT diagram. CONSORT Consolidated Standards of Reporting Trials
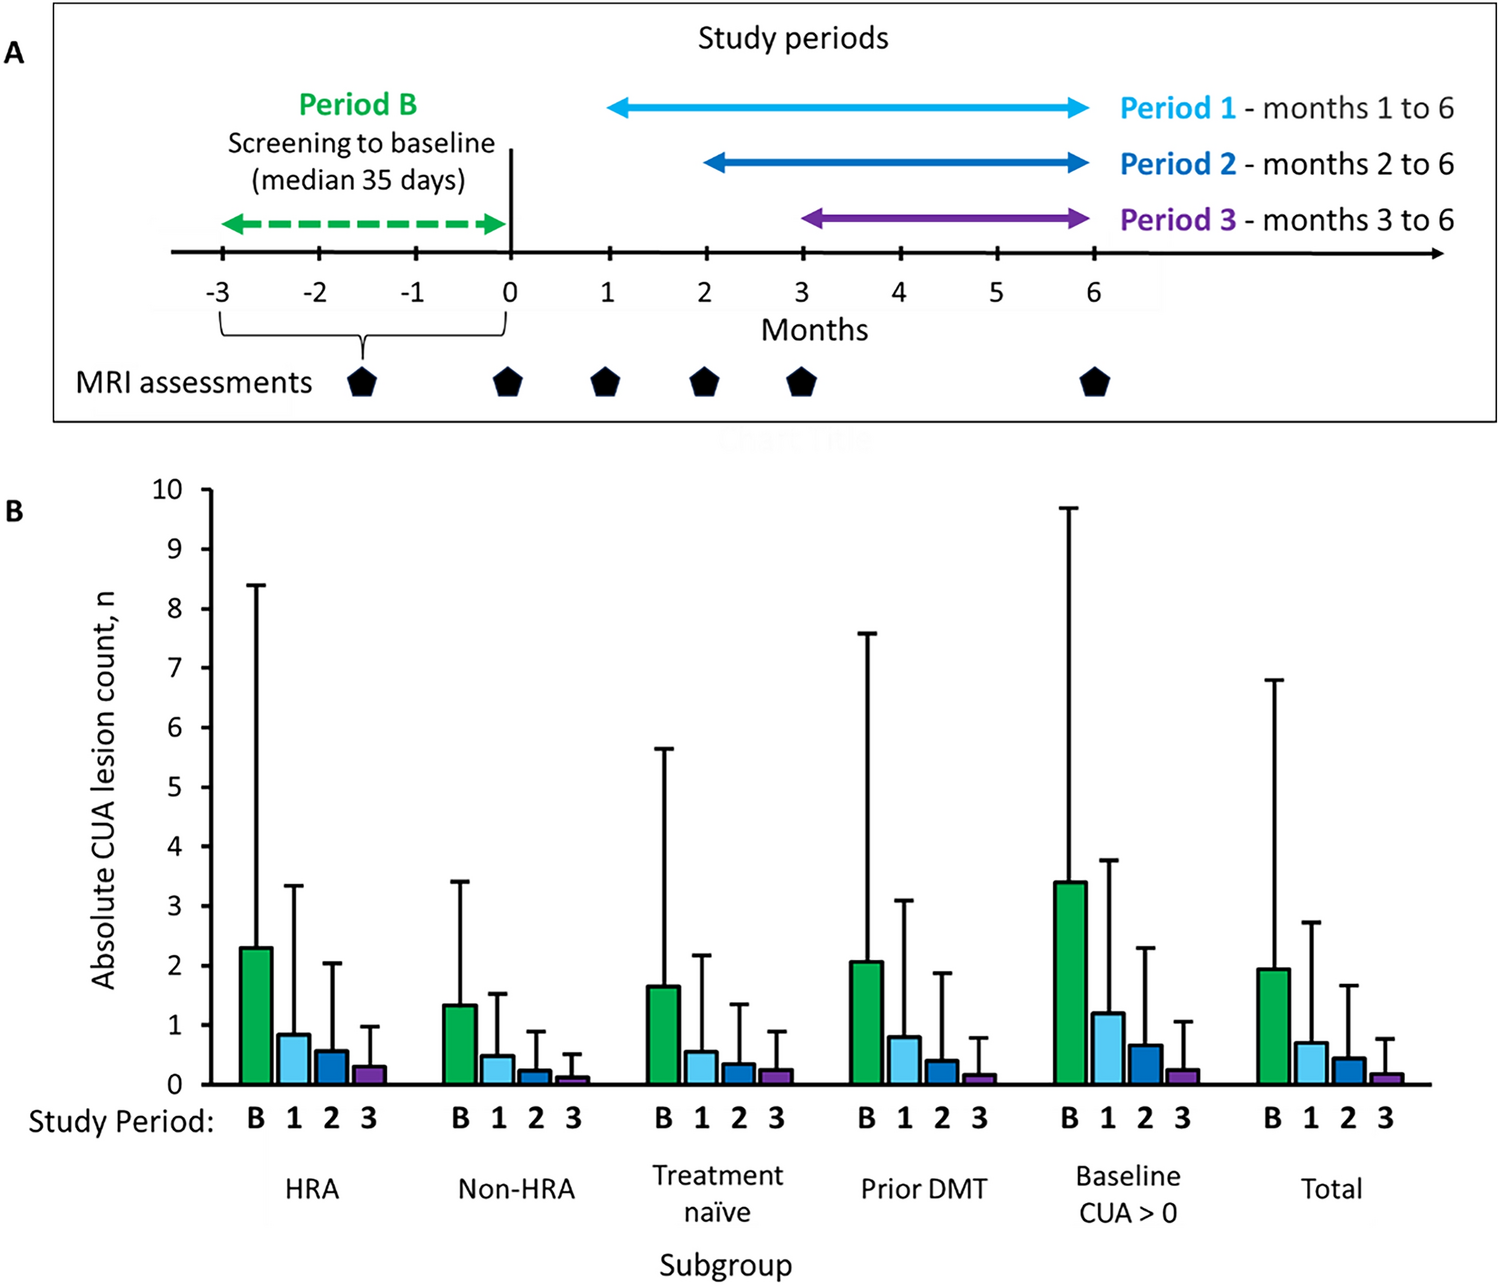
2.2 Study ProcedurePatients participated in two counterbalanced meetings of a crossover, randomized, double-blind, placebo-controlled trial. In each meeting, patients received THC oil or placebo hemp oil (similar in color and smell to cannabis oil) sublingually (0.2 mg/kg, average THC dose = 15.3 ± 2.1 mg; Panaxia Pharmaceutical Industries Ltd, Israel), and were instructed to keep the formulation sublingually in an upright position for 2 min. Of note, the oral formulation used consisted of isolated THC with no other trace substances, and therefore was independent of cultivar effects. Randomization was performed by a dedicated physician using a sealed envelope website (sealedenvelope.com/). The experimental design is depicted in Fig. 2.
Fig. 2
Experiment design: Twelve patients with chronic lumbar radicular pain participated in two meetings of a randomized, double-blind, counterbalanced, placebo-controlled trial. In each meeting, they received a sublingual dose of either 0.2 mg/kg THC oil or placebo. Patients underwent clinical evaluation and an fMRI scan pre and post drug/placebo administration. fMRI functional magnetic resonance imaging, THC δ-9-tetrahydrocannabinol
In each session, patients underwent baseline clinical evaluation, including heart rate (HR) and blood pressure (BP) measurements, and HRV assessment (Nexfin, BMEYE, Amsterdam, The Netherlands). HRV was sampled, calculated, and monitored by a three-lead electrocardiogram (ECG) for a period of 5 min after patients were asked to rest in a supine position, task-free, for 15 min. The CPM paradigm was applied, with a noxious heat stimulus as the test stimulus (Ts), delivered first alone and then concomitantly with a conditioning stimulus. Patients rated the pain intensity of the Ts continuously using a computerized visual analog scale (COVAS, Medoc, Israel), ranging from 0 (no pain at all) to 100 (the most intense pain imaginable). Subsequently, patients underwent a non-task resting state fMRI scan, lasting 6 min, and patients were instructed to keep their eyes closed, rest, and relax, but not to fall asleep. After the scan, patients received the treatment (THC/placebo). One hour post drug administration, the same procedure was repeated. The second fMRI scan was thus started about 2 h post drug administration, in accordance with THC sublingual absorption, usually showing maximal plasma concentrations after 2–3 h [37]. The meetings were separated by at least 1 week in order to enable a THC washout period (average weeks interval = 2.8 ± 3.4). Participants were not questioned as to the perceived allocation to THC or placebo per session.
2.3 Conditioned Pain Modulation (CPM) ParadigmThe Ts was a tonic noxious heat stimulus (TSA II, Neurosensory Analyzer; Medoc, Israel) delivered to the dominant volar forearm for 120 s at PAIN60 intensity. PAIN60 was determined individually as the temperature that induces pain at the intensity of 60 in a 0–100 scale. The temperature increase and decrease rate was 0.3 °C/s from a baseline temperature of 31 °C. The conditioning stimulus was immersion of the left foot into a cold water bath (8 °C) for 120 s or until the patient could not tolerate the stimulus and removed his leg.
2.4 Functional Magnetic Resonance Imaging (fMRI) Data AcquisitionfMRI data were acquired with a 3T MRI scanner (Magnetom Prisma, Siemens, Munich, Germany), with a 20-channel head coil, located at the Wohl Institute for Advanced Imaging at the Tel Aviv Sourasky Medical Center. Functional scans were performed with T2*-weighted echoplanar images (44 axial interleaved slices, repetition time [TR] 3000 ms, echo time [TE] 35 ms, field of view [FOV] 220 mm, in-plane matrix resolution 96 × 96, voxel size 2.3 × 2.3 × 3.0 mm, slice thickness 3 mm, flip angle 90°). Anatomical scan consisted of T1-weighted magnetization-prepared rapid gradient echo structural images (TR 1860 ms, TE 2.74 ms, FOV 256 mm, in-plane matrix resolution 256 × 256, voxel size 1 × 1 × 1 mm, slice thickness 1 mm, flip angle 8°).
2.5 Data Analysis2.5.1 Physiologic MeasurementsStatistical analyses for physiologic measurements were performed using STATISTICA 10 (TIBCO Software Inc., Palo Alto, CA, USA). Within-subject repeated measures analysis of variance was employed to ascertain significant interaction and simple main effects between the treatment (THC, placebo) and the state (pre, post) for cardiovascular measures (HR, BP and HRV) and CPM.
2.5.2 Heart Rate Variability (HRV) AnalysisThe HRV measures that were calculated were low frequency (LF), high frequency (HF), and LF/HF ratio, which reflects the balance between the two components of the autonomic system. A three-lead surface ECG was sampled for 5 min and digitized at 500 Hz by an analog-to-digital converter using the Windaq pro software (WinDaq, version 2.27; DataQ Instruments, Akron, OH, USA). The assessment of the power spectral analyses of R-R intervals was performed using the Welch periodogram method for power spectral density calculation. Band pass filter (BPF) was used for respiration and noise reduction. A Hanning window in the time domain was adopted to attenuate spectral leakage (512 samples). Two subsets of the frequency domain were used for the RR interval, low-frequency band (LFRR: 0.04–0.15 Hz) and high-frequency band (HFRR: 0.15–0.4 Hz). LF and HF were also normalized as the relative value of each power component in proportion to the total power minus the very LF (VLF) component (local software, using MathLab 2018 [38]).
For each participant, in each treatment condition, HRV changes were determined as the delta between the HRV score before intervention and the HRV score after intervention.
2.5.3 CPM AnalysisCPM response was calculated by subtracting the mean pain intensity ratings of the Ts alone from the mean pain intensity ratings of the Ts during the conditioning stimulus. Thus, greater CPM response is presented as a negative value. For each patient, the difference between baseline and the intervention stages was calculated [8]. The whole paradigm was completed by 12 participants but due to recording problems, two participants did not include the whole dataset and were excluded.
2.6 fMRI Data Analysis2.6.1 Preprocessing and Functional Connectivity AnalysisFunctional analyses were performed using Statistical Parametric Mapping (SPM12) software (fil.ion.ucl.ac.uk/spm/software/spm12/) and the Functional Connectivity toolbox [39] (nitrc.org/projects/conn). Preprocessing included the following; the first 18 s of the functional data were discarded to allow steady-state magnetization. Functional images were slice-time corrected, realigned to the middle scan, motion-corrected, and normalized according to standard Montreal Neurological Institute (MNI) space. Spatial smoothing was performed using a 6-mm full width at half maximum Gaussian kernel. In order to reduce noise, functional volumes were bandpass filtered at 0.008–0.15 and the component-based method (CompCor) was used for noise signals such as white matter, CSF, and movement artifacts that were taken as confounders. In addition, images that were regarded as movement outliers were regressed out. Outliers were detected using the ART toolbox (nitrc.org/projects/artifact_detect/) and defined as volumes with a movement > 2 mm or signal intensity changes > 9 SD.
Functional connectivity was performed using a seed-based analysis looking for temporal correlations of the resting-state blood oxygenation level-dependent (BOLD) signal time series between the RVLM as the seed region and the rest of the brain. The region of interest (ROI) was defined using the left RVLM peak coordinates from an fMRI study of the sympathetic nerve activity [40]. A 2 mm radius sphere was generated around the coordinates (MNI coordinates − 5, − 42, − 52).
For each participant, first-level correlation maps were produced by extracting the residual BOLD time course from the seed and computing the Pearson correlation coefficients between that time course and the time course of all other voxels. Correlation coefficients were converted to normally distributed z scores using the Fisher transformation to allow second-level general linear model analyses.
To examine HRV-related changes in connectivity, first-level connectivity maps for each participant, at each state (pre, post), were entered into a whole-brain regression analysis with HRV changes as a covariate. The states were contrasted (post > pre) in order to examine the change in the treatment state (post) compared with the baseline state (pre). In this analysis, reported clusters survived a height threshold of uncorrected p < 0.001 and an extent threshold of false discovery rate (FDR)-corrected p < 0.05 at the cluster level.
留言 (0)