
記住我
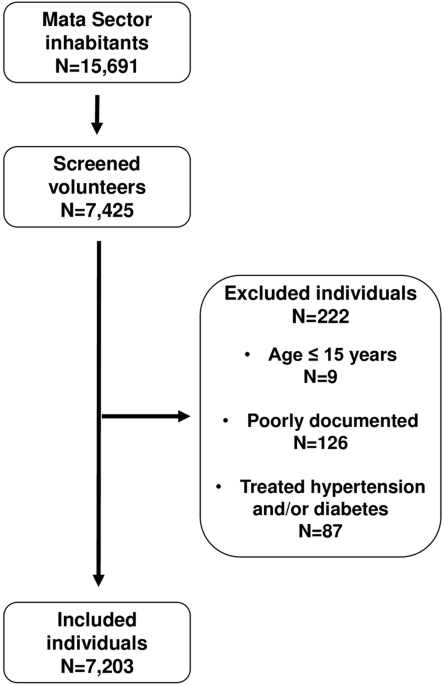


Our study population consisted of the OPERA study cohort whose participants underwent ABPM in the baseline study and again 21.7 years later (SD ± 0.7, range 20.4–23.8 years) during the follow-up study (Fig. 1). Twenty-seven persons were excluded from the analyses based on an earlier diagnosis of coronary artery disease, three persons because of a history of previous stroke, and one because of missing nighttime ABPM values.
Fig. 1: Flow chart of the study population of the OPERA study.
Inclusion and exclusion of study subjects, resulting in 452 eligible participants. ABPM Ambulatory blood pressure monitoring; CV cardiovascular.
In the analyses, there were altogether 452 eligible individuals, of which 228 (50.4%) were women and 224 (49.6%) men (Table 1). During the recruitment, the mean age of the participants was 49.7 ± 5.4 years, and the age range was from 40.2 to 62.0 years. Non-fatal CV events (n = 65, in 14.4% of the subjects) were assessed during the follow-up until the first event. As expected, those who experienced a CV event were predominantly men (p < 0.001), older (p = 0.012), had higher 24-h mean systolic (p = 0.013), daytime systolic (p = 0.033), nighttime systolic (p < 0.001) and nighttime diastolic BP (p = 0.001) and more unfavorable lipid profile than those without a CV event. Almost half of the subjects were hypertensive (47.6%), and 45.4% were treated with at least one antihypertensive medication. The prevalence of diabetes was 6.9%. The average body mass index was 27.2 ± 4.3 kg/m2. Of all the subjects, 22.6% were non-dippers. The prevalence of non-dippers was significantly higher in those with a CV event than in those without (40.0% vs. 19.6%, p < 0.001) (Table 1).
Table 1 The baseline characteristics of the study population and CV events.The cohort was divided into four groups according to the dipping status change from the baseline to the follow-up study (Fig. 2). Dipping–dipping pattern was present in 33.6% of the whole cohort, and non-dipping–non-dipping pattern in 18.2%. Non-dipping phenotype was the most consistent: it prevailed in the follow-up in 80.4% of the baseline non-dippers, whereas 43.4% of the baseline dippers remained dippers. A large proportion of the original dippers changed their phenotype to non-dippers (56.6%).
Fig. 2
Flow chart of the cohort (n = 452) from the baseline study to the follow-up by the dipping status.
Altogether, 65 non-fatal CV events occurred, and the incidence was the highest (28.0%) in the non-dipping–non-dipping group and the lowest (6.6%) in the dipping–dipping group, p < 0.001 (Table 2). Age, office BPs, 24-h mean BPs and nighttime BPs differed between the groups and were significantly higher in the non-dipping–non-dipping group compared with the dipping–dipping group. The non-dipping–non-dipping group also had lower estimated glomerular filtration rate (eGFR), total cholesterol, LDL cholesterol and triglycerides levels compared with the dipping–dipping group. Additionally, there was a trend of rising prevalence of hypertension (p < 0.001) and antihypertensive medication use (p < 0.001) in the non-dipping–non-dipping group (linear by linear association p < 0.001).
Table 2 The baseline characteristics of the study population by the dipping categories.Kaplan–Meier survival curves for CV events by different dipping patterns are presented in Fig. 3.
Fig. 3
Kaplan–Meier survival curves of CV events by the dipping status groups.
We analyzed the changes in BP, metabolic factors, and prevalence of hypertension and medication use during the follow-up time (Table 3) by the dipping categories. In the non-dipping–non-dipping group, the incidence of new-onset diabetes was significantly higher than in the dipping–dipping group, and it was reported earlier [11].
Table 3 Changes in variables during the follow-up time shown in respective units or incidence.A general positive development over time in BP measurements can be observed, with the DBP decreasing more, as expected, with age. There were statistically significant differences in office BP and nighttime BP between the dipping groups. In the non-dipping–non-dipping group, the reduction of office BP was the greatest and in the dipping–dipping group the smallest. In nighttime mean BP, the groups also differed from each another, but in post hoc analyses, there was no statistically significant difference in the change in the nighttime BP between the dipping–dipping and the non-dipping–non-dipping group.
As expected, the prevalence of any BP medication use increased over time in all the dipping groups, especially the proportions of the RAA system agents. The non-dipping–non-dipping group had more often BP medication than the dipping–dipping group (86.6% vs. 63.2%, p < 0.001 between the groups, data shown as Supplementary Table 3).
In the follow-up, a lipid lowering agent was used by 45.4% of the study population, compared to only 2.4% at the baseline. Non-dippers tended to use statins more often than the other groups in the follow-up, but the difference did not reach statistical significance.
In the multivariate Cox model, we included variables, that were statistically significant in univariate analyses (data shown only as Supplementary Tables 1 and 2): dipping change pattern (dipping–dipping group as a reference), age, sex, hypertension, office SBP, 24-h mean SBP or nighttime mean SBP, total cholesterol and use of antihypertensive agent (Table 4). The baseline fasting blood glucose levels, prevalence of diabetes or smoking did not differ between the dipping groups and were therefore left out of the Cox model. The non-dipping–non-dipping pattern was independently associated with CV events when adjusted with the above covariates and the 24-h mean SBP (HR 4.01; 95% CI 1.86–8.67, p < 0.001) (Table 4a). The association between the non-dipping–non-dipping pattern and CV events also remained statistically significant when the adjustment in this model was made with the nighttime mean SBP instead of the 24-h mean SBP (HR 3.19; 95% CI 1.41–7.20, p = 0.005) (Table 4b).
Table 4 Multivariate Cox regression models: association of the dipping pattern and CV events.Finally, the delta values of nighttime SBP or 24-h mean SBP, as well as delta office SBP, total cholesterol, new onset diabetes, new onset hypertension, and the change in BP medication were added to multivariate models. The statistical significance of the association of the dipping pattern with CV events remained (for nighttime SBP delta: HR 3.40; 95% CI 1.47–7.88, p = 0.004 and for 24-h mean SBP: HR 3.13; 95% CI 1.38–7.11, p = 0.006).
留言 (0)