
記住我
Cognitive flexibility is defined as the ability to make behavioral adjustments in the face of changing external stimuli,26 such that one is able to shift their attention from their current task in response to a new stimulus or focus on a new cognitive task while experiencing ongoing pain. Attal et al.5 found that patients who had poorer preoperative performance on neurocognitive measures of cognitive flexibility had a greater prevalence or severity of clinically meaningful persistent pain after surgery, suggesting that impaired cognitive flexibility may be a risk factor for chronic pain. To further quantify the role of cognitive flexibility in the development of chronic pain after surgery, Vila et al.76 enrolled a cohort of surgical patients to determine the association between preoperative cognitive flexibility (assessed using the Color-Word Matching Stroop Test [CWMST]) and the incidence of clinically meaningful surgical site pain 6 months postoperatively. Results revealed that poor preoperative performance on the CWMST was associated with higher risk of persistent postsurgical pain.
Cognitive and emotional processes governing adaptations to pain play an important role in the transition from acute to chronic pain.65,71,72,73,74 According to the well-established cognitive appraisal of resilience model,54 a cognitive appraisal occurs after an adverse/noxious event, and cognitive flexibility is a key contributor to a positive appraisal and subsequently positive adaptation and favorable outcome (vs a maladaptive response and pain persistence). Cognitive flexibility is also associated with greater tolerance of uncertainty when unexpected or adverse events occur.76 These data suggest an association between impaired cognitive flexibility and increased risk, or vulnerability, to persistent pain. This premise is also supported by neuroimaging data demonstrating that cortical areas with key roles in pain processing and control4,7,8,17,19,39,63,75,77–80 are actively involved in cognitive flexibility tasks.27,36,44 Individuals with higher levels of pain may perform worse on tests of cognition3,32,55,70; conversely, impaired cognitive flexibility may precede chronic pain development.5,76
Despite evidence suggesting a link between cognitive flexibility and the development of chronic surgical-site pain, it is not known whether cognitive flexibility can be improved in patients with chronic pain, and whether this improvement would translate to reduction in pain. For example, interventions focusing on the cognitive processing of pain, including cognitive behavioral therapy and mindfulness-based approaches, can provide long-lasting pain relief.25,28,29,34,35,73,74 However, it is unclear whether these interventions alleviate pain through modifying cognitive flexibility or other components of executive function (EF),20,48 such as self-inhibition, emotional control, and working memory.
A computer-based approach for neurocognitive training has the potential to provide a scalable standardized method to modify cognitive flexibility with objective, measurable endpoints for subject performance and training adherence. Computerized cognitive flexibility training has led to improved performance on measures of cognitive flexibility and other EF tests in patients with anorexia nervosa and posttraumatic stress disorder.10,16,21,37 Furthermore, chronic pain patients appear to be amenable to improvements in EF performance and self-reported cognition through a computer-based intervention.6
In this prospective study, we assessed a neurocognitive intervention for patients with chronic hip, back, and knee pain. The primary goal was to understand whether a 5-week training program could boost cognitive function in these individuals. Simultaneously, the secondary objective was to assess the program's effect on pain severity and interference, leading to our dual hypotheses that computer-based cognitive training over 5 weeks (1) can improve cognitive flexibility scores in the context of chronic pain (primary outcome) and (2) can improve pain severity and pain interference scores in individuals with chronic pain (secondary outcome).
2. Methods 2.1. Study overviewThis was a single-center, prospective, randomized, parallel-group clinical study. This study was approved by the Institutional Review Board of Washington University School of Medicine in St. Louis and registered on clinicaltrials.gov (https://clinicaltrials.gov/ct2/show/NCT03398408).
2.2. ParticipantsStudy coordinators recruited participants from the Washington University Pain Center and from the community. Inclusion criteria were as follows: (1) adults between 18 and 70 years with chronic (>3-month duration) hip, knee, or back pain; (2) documented moderate-to-severe chronic pain (eg, a physician's note or visit summary), defined as pain greater than or equal to 4 on a 0–10 numerical rating scale; (3) English fluency; and (4) access to an email account. Exclusion criteria were as follows: (1) lack of basic computer skills/no access to a computer with internet; (2) diagnosed Alzheimer disease or documented severe cognitive impairment; (3) severely impaired vision or color blindness; (4) inability to complete cognitive testing; (5) an interventional pain procedure within one week before enrollment; or (6) scheduled to undergo an interventional or surgical procedure during the study period. Eligibility was not affected by the participants' current pain treatment, whether pharmacological or nonpharmacological. Participants provided their written informed consent before completing the baseline questionnaires, which were conducted during the in-person enrollment visit. Participants were paid up to $45 for their participation ($15 for baseline questionnaire completion and $15 each for completion of 5-week and 3-month assessments).
2.3. RandomizationParticipants were randomized by the study team. Randomization was done in a 2:1 ratio, in blocks of 6, using an online research randomizer (https://www.randomizer.org/). Twenty-five sets of 6 unique numbers were randomly generated from the sets 1 to 6. Two numbers were randomly selected to represent the control condition, and 4 numbers were randomly selected to represent intervention. Study coordinators then assigned participants to the intervention or control condition depending on their assigned number. Research coordinators were required to provide logistical guidance for patients engaging in the training program; therefore, group assignment was not concealed from the study team. Each participant was provided with a unique link to their computerized tests. Only participants in the intervention group had access to the neurocognitive training module.
2.4. Description of interventionPatients in the intervention group continued their care as usual and were assigned to daily neurocognitive training, which they completed at home. The training consisted of completing predetermined modules (games) on the Lumos Labs platform. There were 40 games in total, and participants could play 10 games per day, which appeared in a preset order. Participants were able to skip games and play each game multiple times per day. Overall, 40% of the neurocognitive training session comprised tasks on cognitive flexibility. The cognitive flexibility subset included the following: Brain Shift 2 (task switching between numbers vs letters), Disillusion 2 (task switching between matching shape vs color), Ebb and Flow (task switching between shape vs direction of movement), Robot Factory (response inhibition; ignoring incorrect cues), Chalkboard Challenge 2 (numerical estimation), and Organic Order (logical reasoning). The other 60% of the time included 20% on memory (Memory Matrix 2, Tidal Treasures, Pinball Recall), 20% on attention (Lost in Migration 2, Train of Thought), and 20% on speed (River Ranger, Spatial Speed Match 2). Participants were asked to complete 35 minutes of training daily, for 5 weeks. This training schedule was selected based on results of a previous study demonstrating that these training modules influenced neurocognitive performance with 966 minutes of average engagement.38 The authors of the previous study recommended a target of 20 hours (or 1200 minutes) total as necessary to change neurobiological processes. As a result, we aimed for 1225 minutes total (35 minutes per day for 35 days or 5 weeks). Participants were not restricted from continuing to play the cognitive games after study completion.
2.5. Description of controlParticipants in the control group were not assigned to the neurocognitive intervention of daily training and continued their care as usual.
2.6. Measurements 2.6.1. Baseline assessmentThe baseline assessment included a detailed medical history, a history of chronic pain and analgesic use, along with the participant's current use of medications which primarily act on the central nervous system (antidepressants, stimulants, etc). Participants completed assessments of pain, catastrophizing, anxiety, and depression. We chose the following measures (Brief Pain Inventory [BPI], Pain Catastrophizing Scale [PCS], Hospital Anxiety and Depression Scale [HADS]) because they are commonly used to describe these characteristics in pain populations.33 The BPI22 was used to assess pain severity and interference in their daily lives. The pain severity score represents the arithmetic mean of 4 severity items and ranges from 0 to 10. The pain interference score is measured from the arithmetic mean of 7 interference items and ranges from 0 to 10. The BPI has been widely validated in a variety of populations, including individuals with chronic pain.65,71 The PCS68 has 13 items quantifying 3 components of pain: rumination (scores range 0–16), magnification (0–12), and helplessness (0–24). The total PCS score ranges from 0 to 52, with higher scores indicating higher levels of catastrophizing. The 14-item HADS79 was used to assess participants' anxiety and depression over the past week. The anxiety and depression subscores range from 0 to 21. Both the HADS and PCS are recommended for patient characterization in the context of chronic pain.33
As in previous studies,5,76 changes in cognitive flexibility were measured with the Trail Making Test (TMT) Parts A and B,14 and CWMST80 with the addition of the Neurocognitive Performance Test (NCPT). Both TMT A and B examine scanning, speed, and motor responses, whereas part B additionally tests the simultaneous maintenance of 2 mental sequences, sustained attention and working memory, and cognitive flexibility.23–25 The CWMST has been validated for use in testing EF, particularly the ability to sort out task-relevant information with concurrent distracting information.26,28
The TMT and CWMST each took approximately 5 minutes to complete, including instructions. For each test, the participant was given verbal instructions as well as an example for each task. The participant was then asked to complete the task using pencil and paper format. The time required to complete each task was measured by stopwatch. The participant's scores for each measure reflect the number of seconds they took to complete the tasks. The cognitive assessments were administered in the same order for each participant by a trained examiner. Following the enrollment visit, participants were instructed to complete the NCPT within 48 hours of enrollment, before the initiation of the training module. All instructions appeared on the screen as a part of these tests. Neurocognitive performance test is a composite measure of performance on 9 subtests (TMT A, TMT B, digit symbol coding, dual search, go/no-go, grammatical reasoning, progressive matrices, reverse memory span, scale balance) assessing 9 cognitive domains (working memory, visuospatial memory, psychomotor speed, fluid and logical reasoning, response inhibition, numerical calculation, and selective and divided attention). Participants were also asked to complete a computerized CWMST on Lumos Labs platform at the same opportunity. The full description of each subtest of the NCPT batteries are outlined elsewhere.41 It has been validated in a sample of >130,000 participants, including test–retest reliability and concurrent validity in >35,000 participants.49
The cognitive training intervention took place during the 5 weeks following initial testing.
2.6.2. Follow-up assessmentParticipants were reassessed with the computerized CWMST, NCPT (includes the computerized TMT A and TMT B), and BPI within 1 to 3 days after the 5-week training completion and then again 3 months later. Patients received either an email, phone call, or both as a reminder to complete their assessments. Outcome measures were collected remotely in a bias-free manner with no interpretation by the coordinator.
Information regarding medications was extracted from the patient medical record as recorded by nursing staff or physicians, changes to outpatient pain medication regimen, or from the physician report.
2.7. OutcomesThe primary outcome of this study was change in computerized NCPT scaled score over 5 weeks of cognitive training between the training group and the control group. Secondary outcomes included the changes from baseline on the BPI pain severity and pain interference subscores. Additional outcomes included changes in NCPT flexibility subscores and computerized CWMST scores from baseline to 5 weeks, as well as all outcomes from baseline to 3 months postintervention follow-up.
The flexibility subscore of NCPT is an arithmetic mean of the flexibility specific NCPT tasks (digit symbol coding, grammatical reasoning, progressive matrices, scale balance, and TMT B). The CWMST interference T-score is calculated by subtracting the predicted color word (PCW) score from the actual CW score.59 A T-score of 50 indicates a difference score of 0, and lower scores (<50) suggest deficiencies in performing cognitive flexibility tasks.
To determine the proportion of patients achieving meaningful relief following the intervention, we calculated the proportion of patients achieving 30% or more reduction of pain from baseline, as well as 50% or more reduction in pain from baseline, for both BPI pain severity and pain interference measures. This allowed for the calculation of the number needed to treat (NNT) for the intervention.
2.8. Statistical analysisThe arithmetic means, standard deviations, and 95% confidence intervals (CI) for continuous variables, and percentages for categorical variables were calculated for baseline values. Data on BPI and NCPT (flexibility and computerized CWMST scores) at 5 weeks and 3 months were compared between the groups with an unpaired t test. Between-group effect sizes were calculated using Cohen d23 based on the difference in mean change scores for each cognitive and pain-related outcome between the training and control groups at each time point. Effect sizes of 0.2 to 0.5, 0.5 to 0.8, and 0.8+ were interpreted as small, medium, and large effects, respectively.23 To visualize the BPI, NCPT, flexibility NCPT, and CM scores for all subjects over the entire study period, spaghetti plots, each with lines for arithmetic mean score by group, were created.
As a post hoc analysis, we examined differences in scores by adherence in the intervention group only. Changes in outcome measures at 5 weeks and 3 months were compared with paired t tests in the intervention group in total and separated by participants with ≥80% adherence (ie, >980 of the total 1225 planned minutes trained) vs <80% adherence.
Because we did not have a priori data on the effect size of the intervention, we decided on a convenience sample of 150 participants in this study (100 in the intervention group and 50 in the control group).
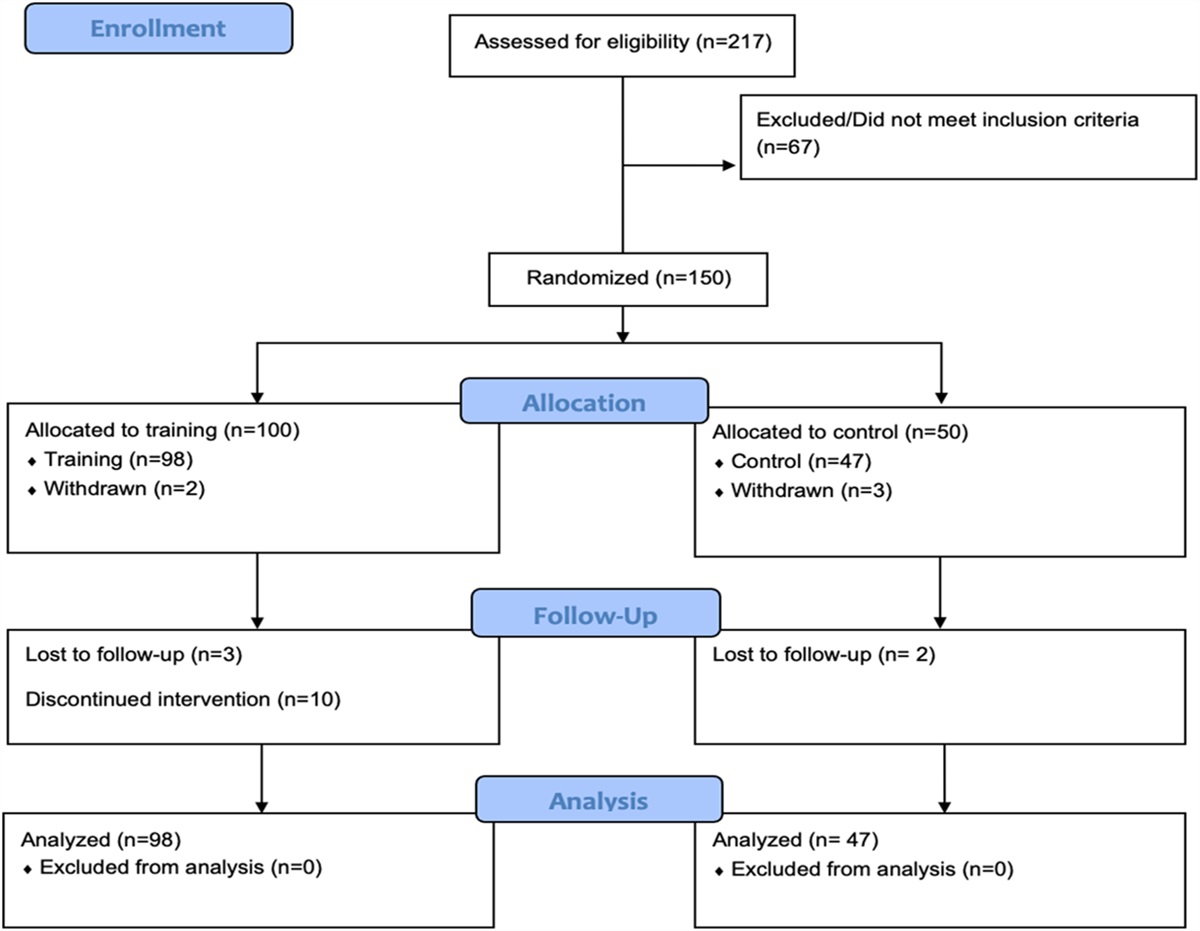
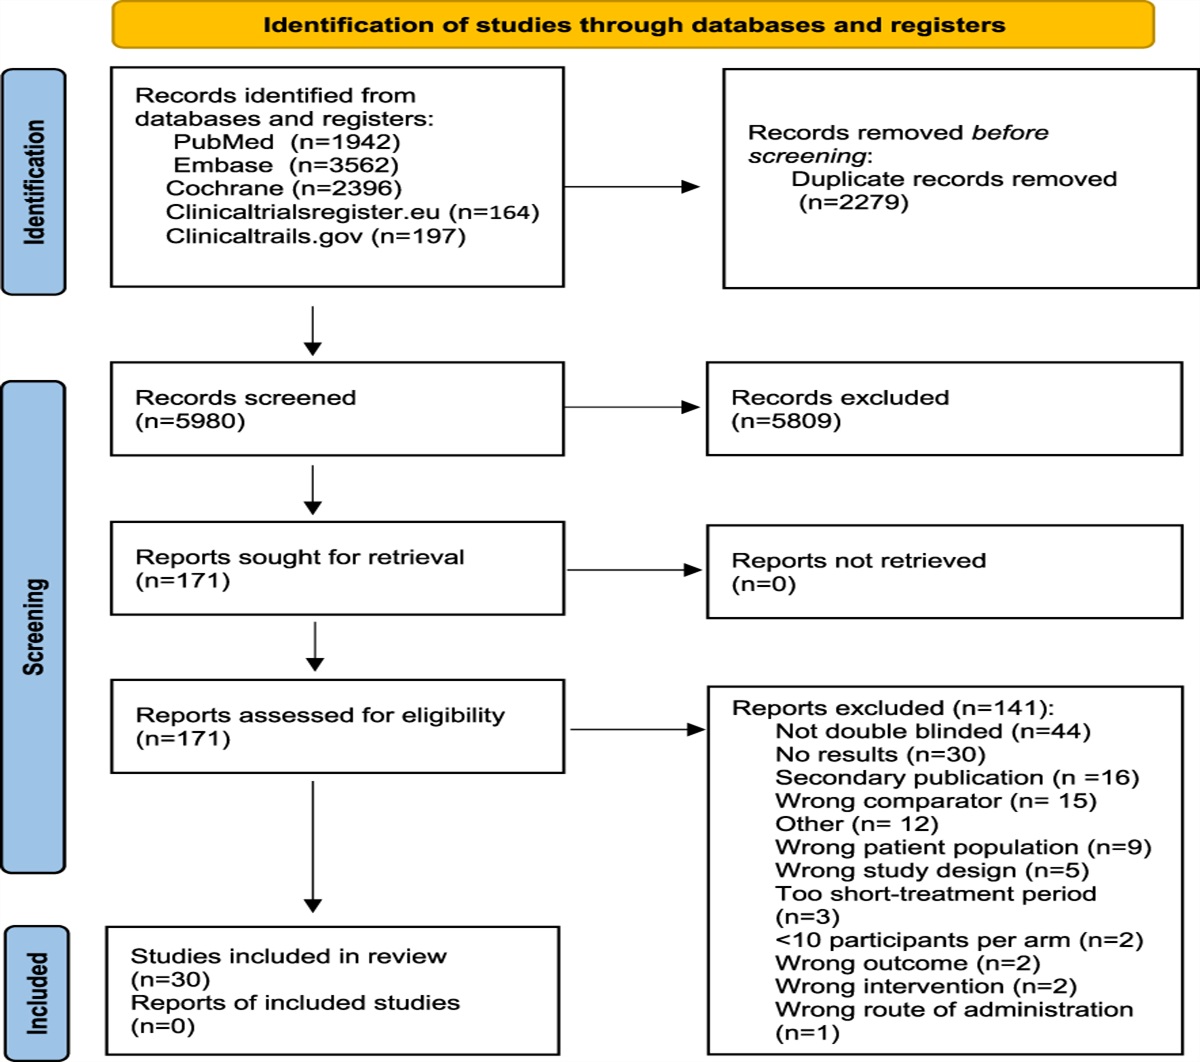
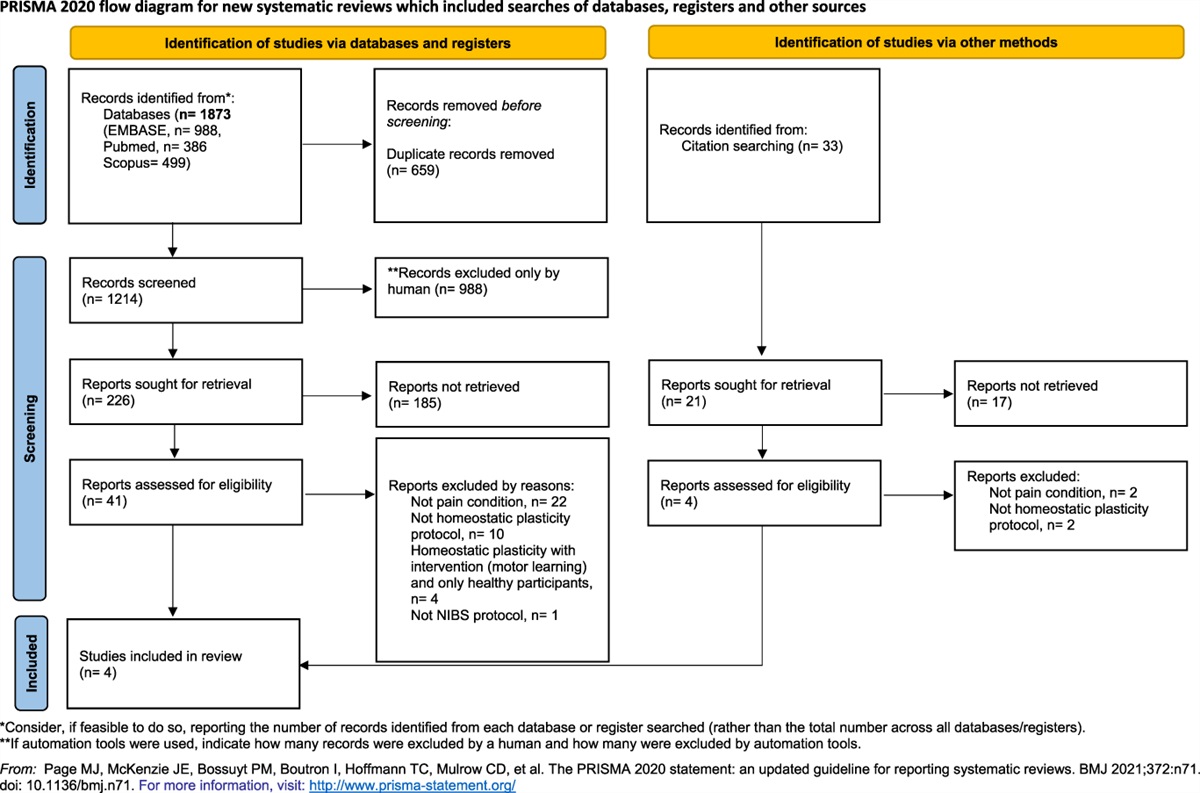
3. ResultsOf the 217 patients screened in the main study cohort, 67 failed eligibility screening, resulting in 150 enrolled and randomized patients (Fig. 1).
 Figure 1.:
 Consolidated Standards of Reporting Trials diagram. Reasons for losses and exclusions after randomization: Participants did not complete any baseline assessment/questionnaires (n = 2 in training group, n = 3 in control group); loss to follow-up (n = 3 in the training group, and n = 2 in the control group); challenges with computer access/skills for training requirements (n = 6, all in training group); and voluntary withdrawal for other reasons (n = 4, all in the training group).
3.1. Sample characteristicsTable 1 presents demographic information and baseline results for 145 study participants, separated to training vs control. The randomization provided adequate balance across groups with no significant differences in baseline characteristics.
Table 1 - Demographics and baseline information for study participants. All participants (n = 145) Training (n = 98) Control (n = 47) P Age, mean (SD) 54.8 (11.5) 54.5 (11.4) 55.7 (11.9) 0.56 Female sex, % 78.0 75.5 83.0 0.31 Caucasian race, % 71.0 68.4 76.6 0.31 Education, median years (IQR) 16.0 (14.0,18.0) 16.0 (14.0,18.0) 16.0 (14.0,18.0) 0.55 Body mass index, mean (SD) 32.7 (8.6) 33.2 (8.7) 31.6 (8.3) 0.30 Trail making test part A score, median (IQR) 22.7 (18.1–28.4) 21.5 (17.5–28.2) 23.7 (19.2–29.5) 0.72 Trail making test part B score, median (IQR) 47.2 (38.6–63.7) 48.0 (38.5–61.0) 46.5 (39.5–64.9) 0.45 Trail making test part B minus part A, median (IQR) 24.2 (15.4–36.5) 24.5 (15.9–35.2) 22.6 (14.7–38.0) 0.33 CWMST interference T-score, mean (SD) 50.4 (7.1) 50.2 (7.0) 50.6 (7.4) 0.76 Brief pain inventory Pain severity score, median (IQR) 4.8 (3.3,6.3) 5.0 (3.3,6.3) 4.5 (3.3,6.0) 0.29 Pain interference score, median (IQR) 4.4 (2.4,6.3) 4.5 (2.4,6.4) 4.4 (2.4,6.1) 0.97 Hospital anxiety and depression scale Depression subscore, mean (SD) 4.7 (3.7) 4.6 (3.7) 5.0 (3.8) 0.52 Anxiety subscore, mean (SD) 5.8 (3.8) 5.6 (3.4) 6.3 (4.4) 0.29 Pain catastrophizing scale Rumination, mean (SD) 5.9 (4.3) 6.0 (4.3) 5.7 (4.2) 0.71 Magnification, mean (SD) 3.2 (2.7) 3.1 (2.7) 3.3 (2.7) 0.63 Helplessness, mean (SD) 6.6 (4.9) 6.5 (5.0) 6.8 (4.9) 0.80 Total score, mean (SD) 15.7 (10.6) 15.6 (10.7) 15.8 (10.6) 0.93 Baseline comorbidities, % Anxiety 30.4 27.6 36.2 0.55 Depression 37.9 35.7 42.6 0.62 Diabetes 13.3 17.5 4.35 0.09 Obstructive sleep apnea 21.0 20.6 21.7 0.76 Baseline medications (yes) Anticonvulsants 17.2 18.4 14.9 0.60 Antidepressants 37.9 37.8 38.3 0.95 Anxiolytics and muscle relaxants 24.1 24.5 23.4 0.89 Opioids 22.8 19.4 29.8 0.16 Non-opioid analgesics 60.0 58.2 63.8 0.51 Physical, complementary, and alternative therapies 2.1 2.0 2.1 Other medications 3.5 3.1 4.3 0.71 Baseline pain location (yes) Hip 31.0 30.6 31.9 0.87 Knee 48.3 48.0 48.9 0.91 Low back 65.5 65.3 66.0 0.94CWMST, Color–Word Matching Stroop test; IQR, interquartile range.
Participants in the intervention group trained an average of 679 ± 297 minutes, which was 55% of the prescribed training amount. The average number of days participants trained during the 5-week period was 33 days.
Table 2 presents 5-week and 3-month changes in NCPT scores, including the average score for the battery of neurocognitive tests, average score for NCPT flexibility subscores, and the computerized Color Match (CM) score. In each group and both time points, the NCPT and flexibility NCPT scores increased, indicating improved neurocognitive performance. The effect size for the changes in NCPT score between the training and control group was small for both 5 weeks (d = 0.37) and for 3 months (d = 0.18). For the change in flexibility NCPT performance, the effect sizes were small for both 5 weeks (d = 0.30) and 3 months (d = 0.44). Higher scores on the computerized CM assessment also indicate a better performance. The computerized CM scores increased slightly (Δ = 0.6) among the training group at 5 weeks; however, it decreased slightly (Δ = −0.2) at 3 months in this group. In the control group, the computerized CM score decreased at both time points (5-week Δ = −4.4; 3-month Δ = −4.9). Small effect sizes were seen for 5-week (d = 0.44) and 3-month (d = 0.46) changes in computerized CM scores. The changes in NCPT score, NCPT flexibility subscore, and computerized CM are outlined in Figures 2–4 respectively. The 5-week and 3-month changes for each of the neurocognitive tests are provided in Appendix A, https://links.lww.com/PR9/A214.
Table 2 - Change over 5 weeks and 3 months in cognitive training scores for training and control groups. 5-wk change 3-mo change Training Control Effect size Training Control Effect size Overall NCPT 3.9 (6.0) [2.4, 5.4] 2.1 (3.3) [0.7, 3.5] 0.37 2.9 (4.8) [1.5, 4.4] 2.1 (4.3) [−0.0, 4.2] 0.18 Flexibility NCPT 3.7 (6.5) [2.1, 5.3] 1.9 (5.3) [−0.4, 4.1] 0.30 3.7 (6.4) [1.7, 5.6] 0.9 (6.4) [−2.3, 4.1] 0.44 Computerized Color Match score 0.6 (11.6) [−2.5, 3.6] −4.4 (11.1) [−10.6, 1.8] 0.44 −0.2 (11.4) [−3.2, 2.9] −4.9 (9.2) [−10.0, 0.2] 0.46Bold indicates P < 0.05.
NCPT, neurocognitive performance test.
 Figure 2.:
 NCPT score over 3 months with thicker lines demonstrating the average score in the training and control groups. NCPT, neurocognitive performance test.
 Figure 3.:
 Flexibility NCPT score over 3 months with thicker lines demonstrating the average score in the training and control groups. NCPT, neurocognitive performance test.
 Figure 4.:
 Color Match score over 3 months with thicker lines demonstrating the average score in the training and control groups.
Table 3 presents the 5-week and 3-month change from baseline in BPI severity and interference scores by group. For both groups, the pain scores numerically decreased at follow-up. Effect size calculations between the control and training groups were d = 0.16 for the 5-week change in BPI severity and d = 0.39 effect for the 3-month change. The effect size for change in BPI interference between the groups was d = 0.09 for the 5-week and d = 0.20 for the 3-month change. The changes in BPI severity scores over 3 months are outlined in Figure 5, and the corresponding changes in BPI interference scores in Figure 6.
Table 3 - Change over 5 weeks and 3 months in pain scores for training and control groups. 5-wk change 3-mo change Training Control Effect size Training Control Effect size BPI severity −0.6 (1.5) [−1.0, −0.3] −0.4 (1.5) [−0.9, 0.1] 0.16 −1.0 (2.0) [−1.5, −0.5] −0.3 (1.6) [−0.8, 0.3] 0.39 BPI interference −0.3 (1.9) [−0.7, 0.1] −0.5 (2.4) [−1.4, 0.3] 0.09 −0.7 (2.4) [−1.3, −0.2] −0.2 (2.5) [−1.1, 0.7] 0.20Bold indicates P < 0.05.
BPI, brief pain inventory.
 Figure 5.:
 BPI pain severity score over 3 months with thicker lines demonstrating the average score in the training and control groups. BPI, brief pain inventory.
 Figure 6.:
 BPI interference score over 3 months with thicker lines demonstrating the average score in the training and control groups. BPI, brief pain inventory.
Table 4 presents the percentage of patients in each group who achieved a 30% and 50% reduction in BPI pain severity and pain interference scores from baseline to 3 months. The NNT for each group is provided. A greater proportion of patients in the training group reported a 30% or 50% reduction in pain severity and interference from baseline to 3 months. The difference was greatest for pain interference, with 43% of the training group reporting a 30% reduction at 3 months compared with 19% in the control group.
Table 4 - Reduction in pain from baseline to 3 months. Training Control Number needed to treat Percentage Percentage BPI pain severity score 30% reduction 40.6 31.4 10.9 50% reduction 29.0 8.6 4.9 BPI pain interference score 30% reduction 42.9 19.4 4.3 50% reduction 28.6 12.9 6.4BPI, brief pain inventory.
We performed a subanalysis of primary and secondary outcome results stratified by adherence to the prescribed neurocognitive training intervention. Table 5 displays follow-up results for participants in the training group stratified by the level of adherence. Adherence level indicates whether patients participated in cognitive exercises for at least 980 minutes (≥80% of the expected 1,225 minutes in total) over the study period.
Table 5 - Change over time by adherence (≥980 minutes). Change over time by adherence (≥980 minutes) (n = 10) 5-wk change Paired t-test
留言 (0)