
記住我
Neuropathic pain is a common and challenging chronic pain condition.47,59 Despite posing a significant human and economic burden, effective pain relief remains an unmet global need.
As for all chronic pain conditions, treatment of neuropathic pain should follow a multidisciplinary approach. However, in this review, we only consider pharmacological treatments. The current international recommendation for pharmacotherapy in neuropathic pain, as outlined by the Neuropathic Pain Special Interest Group (NeuPSIG) of the International Association for the Study of Pain (IASP) from 2015, included 8 different drug types.13 First-line treatments are tricyclic antidepressants (TCA), serotonin–noradrenaline reuptake inhibitors (SNRI), pregabalin, and gabapentin, second-line treatments lidocaine patches, capsaicin high-concentration patches, and tramadol, and third-line treatments strong opioids and botulinum toxin type A (BTX-A). The recommendations are based on placebo-controlled randomized trials, with efficacy assessed through numbers needed to treat (NNT) and tolerability using numbers needed to harm (NNH) and the certainty of evidence assessed according to the Grading of Recommendations Assessment, Development, and Evaluation (GRADE) criteria.
The relative treatment effect of recommended drugs for neuropathic pain cannot be estimated reliably from indirect treatment comparisons of effect sizes or network meta-analysis. Several factors contribute to this challenge. First, differences in study design preclude a direct comparison. As an example, most studies assessing TCA are small crossover studies with per-protocol analyses, which may overestimate treatment effect compared with studies assessing pregabalin that are most often larger and parallel-design studies with ITT analyses.13 Second, emerging evidence suggests that the effect size cannot be reliably estimated by subtracting the placebo response from the active treatment response.14,32 Notably, studies with high placebo responses may underestimate the true treatment effect.24,25,29,34 Consequently, if there exists an interaction between the placebo and drug effect, network meta-analyses become inadequate for inferring relative effectiveness and tolerability.
Although the NeuPSIG review included active comparator trials of first- and second-line drugs,13 it did not include third-line drugs and has not been updated since the search was conducted in April 2013 and did not include other outcomes than NNT and NNH. Therefore, the purpose of this systematic review was to compare the efficacy and tolerability of first-, second-, and third-line drugs for neuropathic pain through head-to-head trials. The aim is to complement the work in progress by NeuPSIG to update the 2015 guidelines as these only consider placebo-controlled trials.
2. MethodsThis review adhered to guidelines outlined in the Preferred Reporting Items for Systematic Reviews and Meta-Analyses (PRISMA) Statement.39 The protocol for this systematic review was registered in Prospero (ID: CRD42022364481) before the conduct of the review. There was 1 deviation from the protocol: In the protocol, our search in clinical trials registers was limited to clinicaltrialsregister.eu, but we also included clinicaltrials.gov in the search for unpublished studies with results.
2.1. Eligibility criteria 2.1.1. DesignWe included comparative, double-blind randomized controlled trials (RCTs) with parallel-group or crossover study designs that investigated the analgesic effect of at least 2 first-, second-, and third-line drugs for neuropathic pain.13 We only included double-blind RCTs to reduce the risk of bias. Studies were required to examine neuropathic pain as the primary target condition. As in the NeuPSIG systematic review,13 studies with a treatment duration of at least 21 days (or a follow-up for at least 21 days in case of single treatment) and with at least 10 patients per group were eligible for inclusion. Randomized controlled trials without an active comparison group, single case reports, clinical observations, and studies published only as abstracts were excluded.
2.1.2. PopulationStudies eligible for inclusion included patients of any age with neuropathic pain, as defined by the IASP definition (ie, pain caused by a lesion or disease of the somatosensory nervous system) and the current ICD-11.26,52 This included, but was not restricted to, diabetic, chemotherapy-induced and other painful polyneuropathies, postherpetic neuralgia, postamputation pain, post-traumatic or postsurgical neuropathic pain, painful radiculopathy, central poststroke pain, spinal cord injury pain, and mixed neuropathic pain. Conditions not considered neuropathic according to the current definitions, such as complex regional pain syndrome and fibromyalgia, were not included.
2.1.3. Interventions and comparatorsWe considered studies examining at least 2 pharmacological treatments recommended by the current NeuPSIG treatment recommendation of 201513: TCA, SNRI, pregabalin, gabapentin (including gabapentin extended release and enacarbil), lidocaine patches, capsaicin high-concentration patches, tramadol, strong opioids, and BTX-A. A placebo treatment was not required.
2.1.4. OutcomesWe grouped the outcomes of interest into primary and secondary outcomes. Primary outcomes measured the effectiveness of interventions and included (1) mean change from baseline to the last week of treatment in pain intensity scales (eg, using a numerical rating scale or visual analogue scale) and (2) number of responders defined as the proportion of patients with 50% reduction in pain intensity. If this information was unavailable, we considered a 30% pain reduction or alternatively at least moderate pain relief.
Secondary outcomes were Patient Global Impression of Change (PGIC), quality of life (QoL), sleep duration and quality, emotional functioning (eg, anxiety and depression), number of withdrawals during active treatment, number of dropouts because of adverse events, and adverse events.
2.2. Search methods and study selectionWe adhered to the PRISMA for Searching (PRISMA-S) extension.46 We conducted a literature search for available trials until July 2023 in the electronic databases PubMed, Embase, Cochrane central, clinicaltrial.gov, clinicaltrialsregister.eu, FDA, and EMEA websites. Only studies published in English were searched for and included. Search strategies are available in the supplementary. Record management was conducted using the Covidence systematic review software (Veritas Health Innovation, Melbourne, Australia). Two review authors (A.A.S. and N.L.G.) independently screened titles and abstracts, accessing the full text of articles that met the a priori inclusion criteria specified in the protocol. Disagreements were resolved through reviewer re-examination and discussion of the article or by consulting an independent third reviewer (N.B.F.).
2.3. Data extractionTwo authors (A.A.S. and N.L.G.) independently extracted data from included studies. A third author (N.B.F.) resolved disagreements. We extracted details on the patient, interventions, comparisons, outcomes, and study design of each study, including sample size, age, sex, neuropathic pain condition, primary and secondary outcomes at baseline and at the end of follow-up, type and dose of treatment, route of administration, comparator type, add-on therapy, study year, and design. If studies reported multiple analyses (eg, ITT or per-protocol), we extracted the more conservative data with a preference for ITT analyses.
2.4. Data synthesisWe combined data in meta-analyses where sufficient data were available using Review Manager (RevMan) version 5.4. All analyses were conducted using a random-effect model because of substantial differences in methodology and scales within the included studies and varying levels of heterogeneity observed in most of our analyses. Pain outcomes measured on continuous scales were expressed as mean differences (MD) with a 95% CI, whereas risk difference (RD) was used for dichotomous outcomes. Secondary outcomes measured on continuous scales were expressed as standardized mean differences (SMDs) with a 95% CI when studies examined the same outcome assessed with different scales. An SMD of 0.2 represented a small effect, 0.5 a moderate effect, and 0.8 a large effect.54 For studies that reported partial pain outcomes (eg, mean values without SDs), we calculated outcomes as needed based on other available information. We planned to conduct meta-analysis for all the outcomes of this review, and studies with available outcome data were included in the meta-analysis. Studies were grouped by the intervention type/drug group. Studies that investigated subtherapeutic drug doses, including pregabalin < 150 mg, gabapentin < 900 mg, TCA < 50 mg, and duloxetine < 60 mg,13 were not included in the meta-analysis. Heterogeneity between studies was examined using a χ2 test and the I2 statistic.
2.5. Assessment of risk of biasUsing the Cochrane risk-of-bias20 for randomized trials, methodological quality was independently assessed by 2 reviewers (A.A.S. and N.L.G.). We assessed the following 6 risk-of-bias categories: random sequence generation, allocation concealment, blinding of participants and personnel, blinding of outcome assessment, incomplete outcome reporting, and selective reporting. Each category was classified as low, unclear, or high risk of bias. Disagreements between reviewers were resolved through discussion or by consulting a third reviewer (N.B.F.).
2.6. Quality of evidenceThe GRADE approach was used to assess the quality of evidence. The quality of evidence was rated from very low to high.19 The certainty began with high quality but could be downgraded because of study limitations, inconsistency, imprecision, and indirectness.
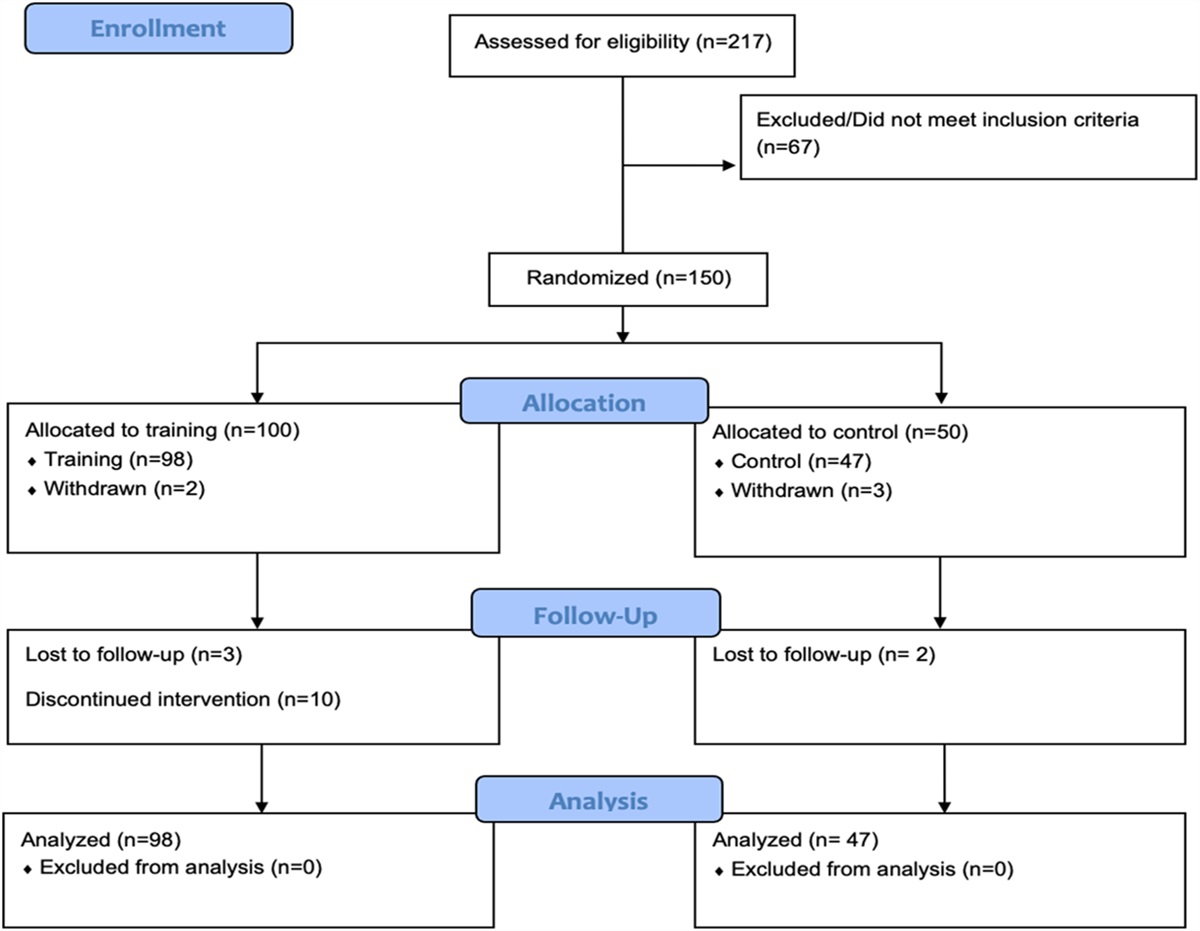
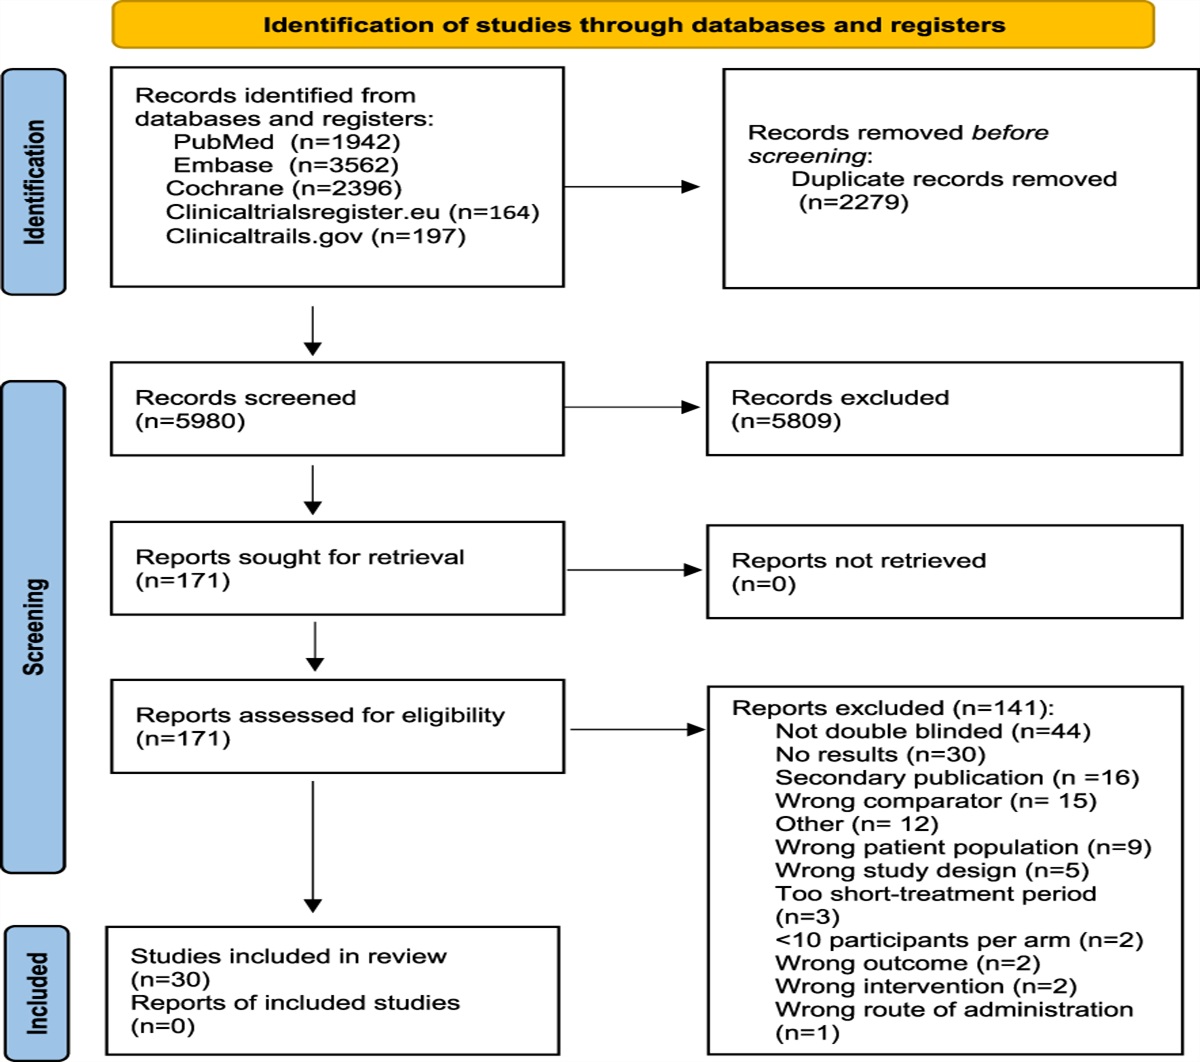
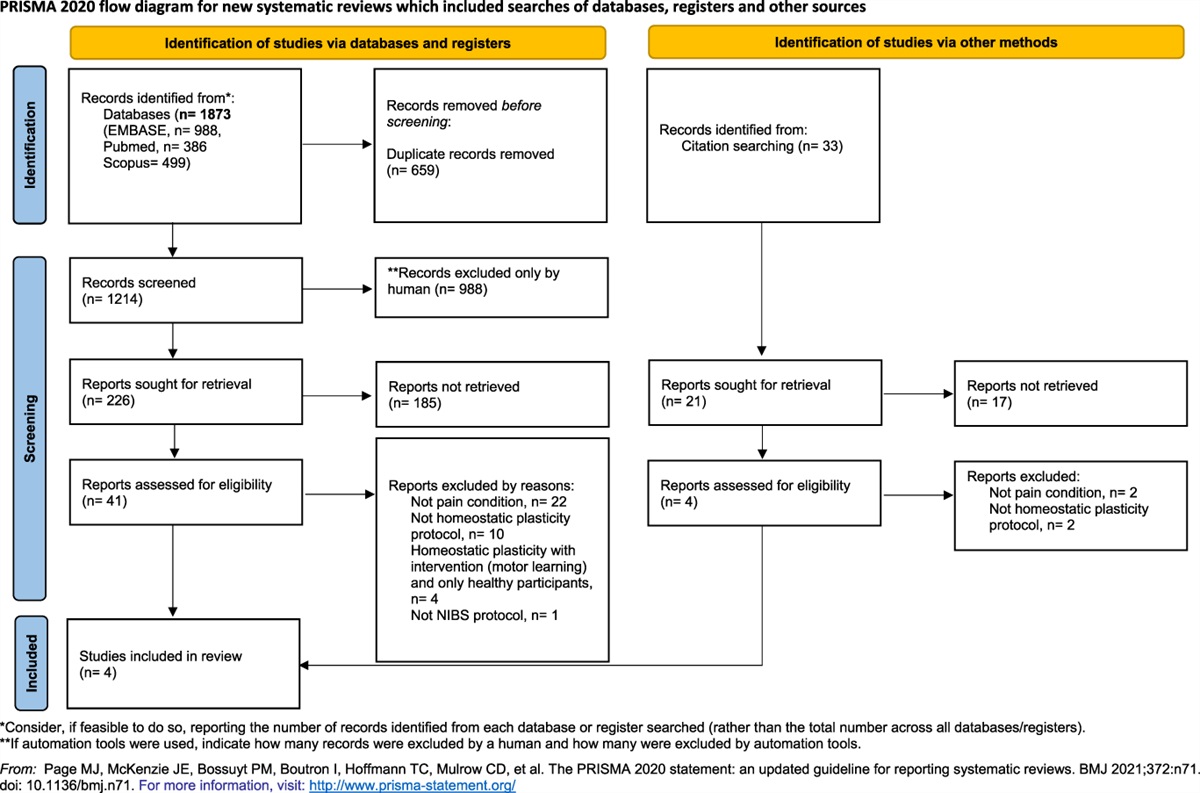
3. ResultsThe combined searches resulted in 7900 records. After removing duplicates, 5626 records were screened for title and abstract. We reviewed 171 full-text articles and subsequently excluded 141 studies. In total, 30 publications were eligible and included in the review (Fig. 1).
 Figure 1.:
 PRISMA flowchart showing the study selection process. PRISMA, Preferred Reporting Items for Systematic Reviews and Meta-Analyses.
3.1. Included studiesWe included 30 comparative, double-blind RCTs with parallel-group or crossover study designs comprising a total of 4087 patients.1,2,6,8,11,15–17,21,27,28,30,35–38,41–45,48–51,55,57,58,60,62 Sixteen of these were also included in the NeuPSIG review (Appendix 5b).13 Fourteen of the included studies were classified as parallel-group trials, with 4 of these including a placebo group. Sixteen of the included studies had a crossover study design, of which 8 also had a placebo group. Characteristics of included studies are provided in Table 1, and assessment scales used are presented in supplementary table S1, https://links.lww.com/PR9/A220. All trials were conducted in adults, and no trials included children or adolescents younger than 18 years. Of the 25 studies reporting inclusion criteria for age, 13 had an upper limit between 65 and 89 years, whereas 12 had no upper age limit. Most studies included both men and women with numbers reasonably representative for the respective pain conditions. Studies were conducted in Europe, United States, Canada, Iran, India, Japan, and Australia. Of the 26 studies that reported funding, 5 were company-sponsored trials, and 21 were investigator-initiated trials, of which 9 had drugs provided free by a company and 2 received company funding. All studies investigated measures of neuropathic pain as primary outcome. Pain conditions included diabetic painful polyneuropathy (D-PPN) (n = 15), postherpetic neuralgia (PHN) (n = 4), mixed peripheral neuropathic pain (PNP) (n = 4), D-PPN and PHN (n = 2), chemotherapy-induced painful polyneuropathy (C-PPN) (n = 1), chronic lumbar root pain (CLRP) (n = 2), cancer neuropathic pain (n = 1), and spinal cord injury neuropathic pain (SCI-NP) (n = 1).
Table 1 - Characteristics of included studies. StudyFunding is reported as company-sponsored (“company name”), investigator-initiated (Inv. Init.), investigator initiated with company-provided drugs (Inv. Init. Drugs), or investigator initiated with funding from company (Inv. Init. “company name”).
C, crossover; CLRP, chronic lumbar loot pain; C-PPN, chemotherapy-induced painful polyneuropathy; D-PPN, diabetic painful polyneuropathy; NA, not available; NS, not significant; P, parallel; PHN, postherpetic neuralgia; PNP, peripheral neuropathic pain; S, significant; SCI NP, spinal cord injury neuropathic pain.
A summary table for risk-of-bias judgments for included studies is shown in Figure 2. Risk-of-bias assessments for individual studies are included in Figure 3. Details of risk-of-bias assessment are included in the supplementary.
 Figure 2.:
 Risk-of-bias graph: review authors' judgements about each risk-of-bias item presented as percentages across all included studies.
 Figure 3.:
 Forest plots of mean change in pain intensity (0-10 numeric rating scale) of trials comparing gabapentin/pregabalin with TCA (A), gabapentin/pregabalin with SNRI (B), TCA with SNRI (C), and opioids with TCA (D). SNRI, serotonin–noradrenaline reuptake inhibitors; TCA, tricyclic antidepressants.
3.3. OutcomesResults related to change in pain intensity are presented in Figure 3A–D, treatment responders in Figure 4A–D with L'Abbé plots in supplementary Figure S1, https://links.lww.com/PR9/A220, and dropouts because of adverse events in Figure 5A–D. QoL, sleep, emotional functioning, and dropouts are presented in the supplementary.
Forest plots of treatment responders, of trials comparing gabapentin/pregabalin with TCA (A), gabapentin/pregabalin with SNRI (B), TCA with SNRI (C), and opioids with TCA (D). A responder was defined as a patient with at least 50% pain reduction (if not available 30% pain reduction or at least moderate pain relief). SNRI, serotonin–noradrenaline reuptake inhibitors; TCA, tricyclic antidepressants.


 Figure 5.:
 Forest plots of number of dropouts because of adverse events of trials comparing gabapentin/pregabalin with TCA (A), gabapentin/pregabalin with SNRI (B), TCA with SNRI (C), and opioids with TCA (D). The distribution indicates more dropouts with the drug. SNRI, serotonin–noradrenaline reuptake inhibitors; TCA, tricyclic antidepressants.
3.3.1. Tricyclic antidepressants vs pregabalin/gabapentin 3.3.1.1. Mean change in pain intensityWe identified 10 studies (920 patients) that evaluated the effect of TCA and pregabalin or gabapentin on neuropathic pain through head-to-head comparisons. The pooled effect showed no difference between TCA and pregabalin/gabapentin in pain reduction (MD 0.10, 95% Cl −0.13 to 0.32, P = 0.39) (Fig. 3A).
3.3.1.2. Treatment respondersEight studies (849 patients) reported either 50%, 30%, or at least moderate pain relief and were eligible for inclusion in the meta-analysis for treatment responders (Figure 4A and Supplementary Figure S1a, https://links.lww.com/PR9/A220). The combined effect showed a nonsignificant trend, suggesting superiority of TCA compared with pregabalin/gabapentin (RD 0.06, 95% Cl −0.01 to 0.12, P = 0.08).
3.3.1.3. Secondary outcomesWe did not find any studies reporting PGIC. No differences were found in QoL or sleep scores (Supplementary Figures S2 and S3, https://links.lww.com/PR9/A220). We found 9 studies that investigated the treatment effect on emotional functioning by using different depression scales (Supplementary table S1, https://links.lww.com/PR9/A220). None of these studies reported a significant difference between the treatment groups, and meta-analysis of the 2 studies that reported extractable data also showed no difference (Supplementary Figure S4, https://links.lww.com/PR9/A220). We found no significant difference in number of patients who withdrew during active treatment (Supplementary Figure S5, https://links.lww.com/PR9/A220) or number of dropouts because of adverse events (RD 0.02, 95% CI −0.03 to 0.07, P = 0.50) (Fig. 5A). Most frequent adverse events were dry mouth and dizziness during TCA treatment and somnolence and dizziness during pregabalin/gabapentin treatment.
3.3.2. Serotonin–noradrenaline reuptake inhibitors vs pregabalin/gabapentin 3.3.2.1. Mean change in pain intensityWe found 8 studies that investigated the effect of SNRI compared with pregabalin or gabapentin. Five studies (1495 patients) reported pain reduction by change in pain intensity scales and were included in meta-analysis (Fig. 3B). The pooled effect size showed higher pain reduction in the SNRI group compared with pregabalin or gabapentin groups (MD 0.36, 95% CI 0.01–0.70, P = 0.04).
3.3.2.2. Treatment respondersThree studies (1312 patients) reported extractable data for 50%, 30%, or at least moderate pain reduction and were included in the meta-analysis (Figure 4B and Supplementary Figure S1b, https://links.lww.com/PR9/A220). The combined effect showed no difference between the SNRI group compared with pregabalin or gabapentin (RD 0.03, 95% CI −0.08 to 0.14, P = 0.59).
3.3.2.3. Secondary outcomesWe did not find any studies reporting PGIC. No differences were found in QoL, sleep, or depression outcomes (Supplementary Figure S2, S3, S4, https://links.lww.com/PR9/A220). We found no significant difference in number of patients who withdrew during active treatment (Supplementary Figure S5, https://links.lww.com/PR9/A220) and number of dropouts because of adverse events (RD 0.03, 95% CI −0.03 to 0.10, P = 0.34) (Fig. 5B). Considering adverse events, nausea was more common during SNRI treatment compared with pregabalin or gabapentin, and dizziness was more common during pregabalin/gabapentin treatment.
3.3.3. Tricyclic antidepressants vs serotonin–noradrenaline reuptake inhibitors 3.3.3.1. Mean change in pain intensityWe found 6 studies that investigated the effect of TCA compared with SNRI. Four studies (432 patients) reported on change in pain from baseline using numeric rating scales (Fig. 3C). No difference was found between TCA and SNRI treatment groups (MD 0.33, 95% CI −0.44 to 1.10, P = 0.40).
3.3.3.2. Treatment respondersThe pooled effect showed no difference between TCA and SNRI treatment groups in the number of treatment responders (4 studies, 505 patients) (RD −0.04, 95% CI −0.25 to 0.18, P = 0.73) (Figure 4C and Supplementary Figure S1c, https://links.lww.com/PR9/A220).
3.3.3.3. Secondary outcomesWe did not find any studies reporting on PGIC. There were no differences in QoL (SMD −0.05, 95% CI −0.30 to 0.19, P = 0.67) or sleep scores (SMD 0.19, 95% CI −0.05 to 0.44, P = 0.12) (Supplementary Figure S2 and S3, https://links.lww.com/PR9/A220). One study compared the effect of amitriptyline and duloxetine on depressive symptoms and concluded no significant difference between treatment groups.57 We found no significant difference in number of patients who withdrew during active treatment (Supplementary Figure S5,
留言 (0)