
記住我
The biopsychosocial model of chronic pain posits that pain is affected by interactions between biological, psychological, and social factors. Yet, chronic pain research has disproportionately focused on biological/psychological factors, with fewer studies examining social correlates of pain.1,3,11,17,20,21,26,27,32,37,39,43,50–52,69 Extant studies show that relative to pain-free populations, individuals with chronic pain report lack of friendships and feelings of social isolation,26,43,55,67,68,75 more victimization/isolation,31,32 greater dissatisfaction with social roles/activities,32,73 and poor emotional support,32,72 among other negative social outcomes.28,32,46,68 In addition, youth with chronic pain experience developmental delay in education,51,52 relationships,31 and autonomy21 and are less likely to attend social/family events,13,20,57,70 suggesting that chronic pain may negatively affect multiple social domains.
The impact of pain on social functions may be exacerbated in those with multiple pain conditions. Chronic overlapping pain conditions (COPCs) are a set of commonly comorbid disorders, including temporomandibular disorders (TMD), fibromyalgia, and migraine, among others that share overlapping physiological, genetic, and pain mechanisms.4,22,30,53,56,59,62 COPCs are associated with worse psychological function in a gradient-specific manner, based on the number of overlapping conditions.59 Although research has examined sociopsychological and biological variables of these chronic pain conditions alone,30 no work, to our knowledge, has examined the broad social impact of COPCs.
Moreover, social impact of pain may not be similar across the life span. One in 9 young adults experience chronic pain worldwide,58 and young adulthood (ages 18–30 years) is a crucial period of life for development of personal identity and lifelong social bonds.2,6,39,77 Previous research has found that female individuals are more likely than male individuals to seek treatment for several chronic pain conditions,8,36 suggesting that they may be the most socially affected by pain. Although others have called for explicitly examining the needs of young adults with chronic pain specifically, relatively few studies have specifically examined social parameters in this population.14,74 Thus, investigating the impact of pain on social functioning in this developmental period is imperative.
The aim of this study was to compare social functioning among young women (ages 18–30 years) with TMD, fibromyalgia, migraine, and a combination thereof (ie, COPCs), and healthy controls. First, we will test which specific social domains (Table 1) are different between young women with chronic pain and controls. Second, we will test whether social impact differs among those with 3 different pain conditions. Temporomandibular disorders consist of pain in the head/face and may have a substantial impact on social functioning and activities because pain is aggravated by jaw function (chewing, speaking, and talking) and expressing emotions (smiling and laughing40). Migraine consists of pain in the head, which is not triggered by social activities, providing a good comparison group. Fibromyalgia is characterized by generalized bodily pain, allowing us to test whether pain in the head/face is particularly disruptive. Finally, we will test the impact of COPCs on social functioning among young women. We hypothesized that young women in all chronic pain groups would report worse social functioning than controls (Aim 1). Because social activities would likely aggravate TMD pain, we hypothesized that social outcomes would be more impaired in those with TMD (Aim 2). Finally, we hypothesized that young women with COPCs would report worse social functioning than those with only 1 pain condition (Aim 3). To the best of our knowledge, this is the first study to comprehensively characterize social health parameters in young women with COPCs.
Table 1 - Definition and sample items for social functioning battery. Social construct Definition Sample items Emotional support The perception that people in one's social network are available to listen to one's problems with empathy, caring, and understanding “In the past 4 weeks, describe how often I have someone who will listen to me when I need to talk”This study was conducted entirely online and by phone. Participants were recruited nationwide through ResearchMatch and through online advertisements/emails sent to chronic pain listservs. The recruitment process lasted 24 months (October 2019–February 2021). To be eligible, participants needed to be female, be between 18 and 30 year of age, be on a stable medication regimen during the previous 4 weeks, understand English, and have internet access. Participants were excluded if they self-reported flu-like symptoms within the previous 2 weeks, current use of opioids, being pregnant, or being diagnosed with cancer. To qualify for the chronic pain group, patients also needed a positive chronic pain screen (see Materials section below) and a physician-confirmed diagnosis of TMD, migraine, or fibromyalgia. Healthy controls were included if they had a negative pain screen and no lifetime history of chronic pain. We first recruited the 3 chronic pain groups (simultaneously) and then recruited the healthy women after sufficient participants were obtained for the pain groups.
2.2. Study proceduresInterested participants were instructed to call the study coordinator at Cincinnati Children's Hospital Medical Center. A research coordinator confirmed eligibility criteria over the phone, asked potential participants about their previous physician-confirmed chronic pain diagnosis, and conducted a brief screener of TMD, fibromyalgia, and chronic migraine. To be eligible, participants in any of the 3 chronic pain groups needed to screen positive on 1 or more of these screeners and report having a physician-confirmed diagnosis for that same condition, by answering yes to the question “Have you ever been diagnosed by a medical professional with fibromyalgia, migraine, or temporomandibular joint disorder or other chronic pain condition in the face?” If participants scored positive and had a physician-confirmed diagnosis for 2 or more conditions, they were asked which of the conditions was most disruptive to their day-to-day functioning and were placed in that group. Participants in the healthy control group needed to screen negative on all 3 screeners and report a lifetime absence of any chronic pain condition.
After completing the 15-minute phone call with the study members, eligible participants were e-consented. Participants completed all aspects of the study from their home (or anywhere else they had internet access). They were then emailed a link to a REDCap questionnaire containing the pain and social measures described further. They were told that the questionnaire would take approximately 1 hour to complete and that they were given 7 days to complete it before the survey link expired to prevent completion outside of the 7-day window. The participants who completed the questionnaire were mailed a $15 Target gift card. The study was approved by the IRB at Cincinnati Children's Hospital (IRB#2019-0855).
2.3. Materials 2.3.1. Telephone screening instruments 2.3.1.1. Temporomandibular disorder screenerParticipants were assessed for the presence of TMD using a 3-item questionnaire.33 They were asked about the duration of pain in the jaw or temple in the past 30 days (0 = “no pain,” 1 = “from very brief to more than a week, but it does stop,” and 2 = “continuous”), the presence of jaw stiffness upon awakening (0 = “no” and 1 = “yes”), and whether they experienced changes in pain with jaw function (0 = “no” and 1 = “yes”). A total score was calculated by summing all items, and a score ≥3 was considered a positive screen for TMD.
2.3.1.2. Chronic migraine screenerParticipants were assessed for the presence of migraine with a 12-item questionnaire.48 Questions 1 to 2 assessed the frequency of headache in the past 90 and 30 days, respectively. Questions 3 to 6 assessed the presence of associated symptoms (ie, nausea, photophobia, and phonophobia) and headache severity in the past 30 days (0 = “never,” 1 = “rarely,” 2 = “less than half the time,” and 3 = “more than half the time”). Questions 7 to 12 assessed the use of medications, work/school or social activity absenteeism, and headache interference in the past 30 days. A positive screen for migraine was defined by the presence of associated symptoms and high headache frequency or by high medication intake and absenteeism and interference.48
2.3.1.3. Fibromyalgia screenerParticipants were assessed for fibromyalgia using 6 items.54 The first question measured the Widespread Pain Index (WPI) by assessing the presence of pain in 19 body sites in the previous week (0 = “no” and 1 = “yes”). Questions 2 to 5 measured the Symptom Severity Index (SSI), which assessed fatigue severity, feeling unrefreshed on awakening, lack of concentration over the past week, and presence of headache, abdominal pain, and depression. The SSI yielded a score between 0 and 12. Question 6 confirmed a symptom duration of more than 3 months. A total score of 13 or above on the summed WPI and SSI was considered a positive screen for fibromyalgia.76
2.3.2. REDCap assessmentParticipants completed the following social outcome battery through REDCap. Although this was the parent study, we also collected additional measures assessing psychological functioning, fatigue, and sleep for exploratory analyses that are outside the scope of this study.
2.3.2.1. DemographicsParticipants self-reported their age, marital status, race, annual household income, and current use of medication (yes/no).
2.3.2.2. MedicationFor descriptive purposes, participants were asked to report their current prescription medications, along with the reason for which they were prescribed, and the doses for each medication.
2.3.2.3. Pain intensityThe average pain intensity was assessed by a single item asking participants as follows: “please rate your pain by marking the box with the number that best describes your pain on the AVERAGE” using a scale of 0 = “no pain” to 10 = “worst pain imaginable.” This single item was drawn from the Brief Pain Inventory, which is widely used and well-validated for assessing pain intensity in populations with chronic pain.16
2.3.2.4. Social outcomesAll social outcomes assessed for this study were from the PROMIS/NIH Toolbox measures, which are validated in individuals with chronic conditions.17,18,35 Sample items of each measure are summarized in Table 1. When different versions of the same scale were available, we used the longer version to maximize reliability. We chose one of each of the short-form measures available except for companionship because it seemed to closely overlap with social isolation/loneliness and instrumental support because several of the items did not seem appropriate for a young adult population.
2.3.2.4.1. Social isolationThe social isolation measure consisted of 8 items rated on a scale of 1 = “never” to 5 = “always,” with higher scores indicating greater perceived social isolation. A total score was calculated by summing all items. The value of Cronbach alpha (α) is 0.93.6 This measure has been used to assess social isolation in young adults in the United States.60
2.3.2.4.2. Family relationshipThe pediatric family relationship measure consisted of 8 items rated on a scale of 1 = “never” to 5 = “always,” with higher scores indicating greater support from family relationships. A total score was calculated by summing all items (α = 0.94). An adult version of this instrument was unavailable. However, previous work has shown that family relationships are a critical component of quality of life for young adults with chronic health conditions,61 and as such, we wanted to assess whether family relationships differed between the chronic pain categories assessed in this study.
2.3.2.4.3. Informational supportThe informational support measure consisted of 8 items rated on a scale of 1 = “never” to 5 = “always,” with higher scores indicating greater perceived informational support. A total score was calculated by summing all items (α = 0.91).
2.3.2.4.4. FriendshipThe friendship measure consisted of 8 items rated on a scale of 1 = “never” to 5 = “always,” with higher scores indicating greater friendship support. A total score was calculated by summing all items (α = 0.90). This measure has been used to assess perceptions of friendship in young adults.47
2.3.2.4.5. Satisfaction with social roles and activitiesThe satisfaction with social role measure consisted of 8 items rated on a scale of 1 = “not at all” to 5 = “very much,” with higher scores indicating greater satisfaction with social roles. A total score was calculated by summing all items (α = 0.92). This scale has been used to assess satisfaction with social roles in young adults with chronic health conditions.45
2.3.2.4.6. Emotional supportThe emotional support measure consisted of 8 items rated on a scale of 1 = “never” to 5 = “always,” with higher scores indicating greater perceived emotional support. A total score was calculated by summing all items (α = 0.96). This measure has been used to assess emotional support in young adults in the United States.66
2.3.2.4.7. HostilityThe hostility measure consists of 8 items rated on a scale of 1 = “never” to 5 = “always,” with higher scores indicating greater hostility. A total score was calculated by summing all items (α = 0.92). This measure has previously been used to assess perceived hostility in young adults with and without chronic health conditions.49
2.4. Statistical analysisBefore analyses, variables were checked for missing information and outliers (±3 SD, from the mean). Missing data were left missing and removed from analyses on a case-wise basis. When outliers were identified, analyses were run with and without the outlier. If removing the outlier changed the results substantively, models with and without the outlier are reported further. If removing the outlier did not change the results, then outliers were retained to maximize power.
Aim 1 was to test whether young women with chronic pain differed from healthy controls regarding social outcomes. The 3 chronic pain groups (TMD, fibromyalgia, and migraine) were combined and coded 1 for the chronic pain group and 0 for the pain-free controls. Comparisons between the chronic pain and pain-free groups in terms of social functioning were performed with independent t tests. Because the control group was smaller than the pain group, we ran Levene test to see whether variances were similar between groups. Results revealed equal variances on all variables except for satisfaction with social roles and activities. However, the interpretation did not change when adjusting for the unequal variances between groups for that variable, so results presented are for models assuming equal variances between groups.
Aim 2 was to compare social functioning between young women experiencing TMD, fibromyalgia, and chronic migraine. Analysis of variance was used to compare the 3 groups, with Tukey post hoc tests. Models were then rerun using ANCOVA to control for pain intensity as a covariate. Effect size comparisons between the groups were computed using Cohen D.
Aim 3 was to compare social functioning between those with none vs only 1 vs 2 vs all 3 chronic pain conditions. To do this, we created a new variable coded 0 for healthy controls, 1 for those with only 1 chronic pain condition as determined by a positive screener, 2 for those who screened positive for any 2 chronic pain conditions, and 3 for those who screened positive for all 3 conditions. ANCOVA was used to compare the 4 groups, and significant relationships were explored with Tukey post hoc tests. Models were run with and without controlling for pain intensity as a covariate. Analysis of variances were used to compare age and income between those with different number of pain conditions.
For all analyses, the P value was set at < 0.05. Data were analyzed with SPSS (IBM SPSS Statistics Macintosh, Version 27.000, IBM Corp, Armonk, NY).
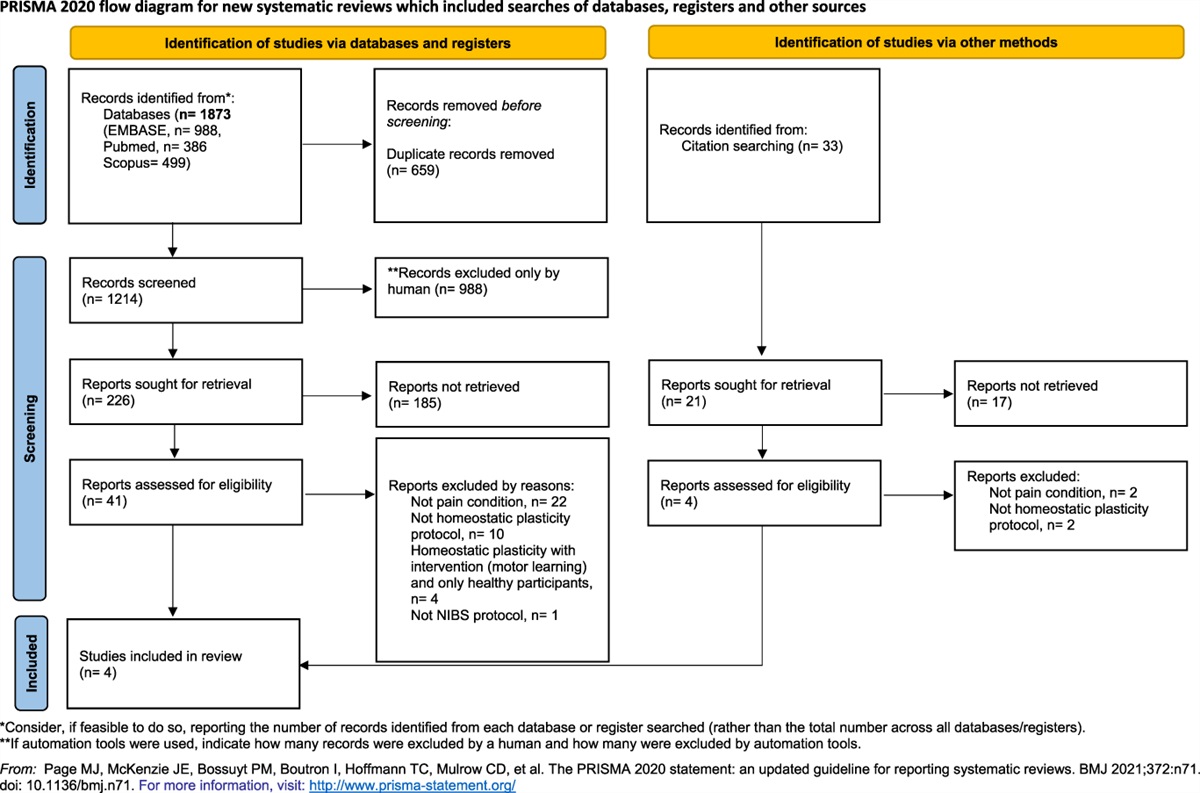
3. ResultsSeveral hundred people were notified of the study on ResearchMatch. Of them, 155 expressed expressing interest in participating in the study. One hundred ten underwent a phone screening and were deemed eligible. Six did not start or complete the online questionnaires and were thus excluded. Thus, the final sample consisted of 104 people for analysis. Twenty-six were in the TMD group, 25 in the fibromyalgia group, 25 in the migraine group, and 28 in the pain-free group. Demographic characteristics are summarized in Table 2.
Table 2 - Demographic and social functioning differences between young women with temporomandibular disorder, fibromyalgia, and migraine and pain-free controls. Pain-free group (N = 28) Chronic pain group P* P† P‡ Cohen D comparing pain-free group with chronic pain group (combined) Total (N = 76) TMD (N = 26) Fibromyalgia (N = 25) Migraine (N = 25) Age (y), mean ± SD 24.00 ± 3.24 24.74 ± 3.38 23.73 ± 3.38 25.56 ± 3.78 24.96 ± 2.79 Marital status (%) In a relationship, not married 5 (17.85%) 23 (30.27%) 11 (42.31%) 3 (12.00%) 9 (36.00%) Married 4 (14.29%) 11 (14.47%) 4 (15.38%) 3 (12.00%) 4 (16.00%) Divorced 0 (0.0%) 2 (2.63%) 0 (0.0%) 0 (0.0%) 2 (8.00%) Single 19 (67.86%) 40 (52.63%) 11 (42.31%) 19 (76.00%) 10 (40.00%) Race (%) African American 1 (3.57%) 0 (0.00%) 0 (0.00%) 0 (0.00%) 0 (0.00%) Caucasian 27 (96.43%) 76 (100%) 26 (100%) 25 (100%) 25 (100%) Income (%) Less than $19,999 1 (3.57%) 9 (11.84%) 5 (19.23%) 2 (8.00%) 2 (8.00%) $20,000–$39,999 5 (17.86%) 16 (21.05%) 6 (23.08%) 7 (28.00%) 3 (12.00%) $40,000–$59,999 8 (28.57%) 15 (19.74%) 1 (3.85%) 7 (28.00%) 7 (28.00%) $60,000–$79,999 4 (14.29%) 8 (10.52%) 2 (7.69%) 3 (12.00%) 3 (12.00%) $80,000–$99,999 1 (3.57%) 6 (7.89%) 1 (3.85%) 3 (12.00%) 2 (8.00%) $100,000–$149,999 3 (10.71%) 11 (14.49%) 4 (15.38%) 2 (8.00%) 5 (20.00%) Higher than $150,000 4 (14.29%) 3 (3.95%) 2 (7.69%) 0 (0.0%) 1 (4.00%) Do not know 2 (7.14%) 8 (10.52%) 5 (19.23%) 1 (4.00%) 2 (8.00%) Social functioning, mean (SD) Emotional support 34.64 (7.29) 34.01 (5.91) 33.77 (6.50) 33.96 (6.51) 34.32 (4.77) 0.65 0.95 0.72 Family relationships 31.89 (7.48) 29.07 (7.23) 29.19 (7.23) 29.04 (7.97) 28.96 (6.75) 0.08 0.99 0.95 Friendship 28.96 (7.29) 25.50 (7.53) 26.23 (8.52) 24.20 (6.64) 26.04 (7.40) 0.038 0.58 0.74 0.34 Informational support 33.82 (5.05) 32.38 (4.92) 32.73 (4.44) 32.16 (4.71) 32.24 (5.71) 0.19 0.91 0.76 Social isolation 17.89 (4.01) 22.39 (6.81) 23.12 (8.17) 21.28 (5.18) 22.76 (6.83) 0.002 0.60 0.37 0.81 Social roles 32.04 (4.62) 25.47 (6.88) 26.92 (7.38) 24.56 (5.68) 22.88 (7.43) <0.001 0.42 0.52 1.12 Hostility 14.04 (5.22) 15.80 (5.63) 16.77 (6.58) 16.16 (5.17) 14.44 (4.93) 0.16 0.32 0.38 Pain intensity, mean ± SD n/a 4.11 (2.01) 3.58 (1.91) 5.08 (1.47) 3.64 (2.27) n/a 0.010 n/aSignificant associations (P < 0.05) are bolded.
*Results of independent t test comparing pain-free group and chronic pain group combined (TMD + fibromyalgia + migraine).
†Results of ANOVA comparing the 3 chronic pain groups with each other.
‡Results of ANCOVA comparing the 3 chronic pain groups with each other, controlling for pain intensity.
TMD, temporomandibular disorders.
Prescription medications were reported by 46.43% of the healthy control group, 80.77% of the TMD group, 100% of the fibromyalgia group, and 82% of the migraine group. The most common prescription medications across all groups included birth control medication, antihistamines, and antidepressants. Medication data by group are summarized in Table 3.
Table 3 - Prescription medication use among young women with temporomandibular disorder, fibromyalgia, migraine, and pain-free controls. Pain-free group (N = 28) TMD group (N = 26) Fibromyalgia group (N = 25) Migraine group (N = 25) n (%) n (%) n (%) n (%) No prescription medications 15 (53.57%) 5 (19.23%) 0 (0.00%) 3 (12.00%) Prescription medication type Birth control/hormone medication 8 (28.57%) 7 (26.92%) 6 (24.00%) 7 (28.00%) Allergy medication/antihistamines 3 (10.71%) 7 (26.92%) 10 (40.00%) 8 (32.00%) Antidepressants 6 (21.43%) 16 (61.54%) 15 (60.00%) 14 (56.00%) Stimulants 1 (3.57%) 4 (15.38%) 5 (20.0%) 3 (12.00%) Muscle relaxants 0 (0.00%) 5 (19.23%) 1 (4.00%) 1 (4.00%) Antiseizure/nerve medications 0 (0.00%) 3 (11.54%) 9 (36.00%) 2 (8.00%) Cardiovascular medications, including alpha agonists and beta blockers 0 (0.00%) 2 (7.69%) 3 (12.00%) 2 (8.00%) Migraine medications, including triptans, biologics, and injections 0 (0.00%) 5 (19.23%) 1 (4.00%) 9 (36.00%) Diabetes medication 0 (0.00%) 2 (7.69%) 2 (8.00%) 0 (0.00%) Immunosuppressants 0 (0.00%) 0 (0.00%) 2 (8.00%) 0 (0.00%) Steroid medications 0 (0.00%) 0 (0.00%) 1 (4.00%) 0 (0.00%) Thyroid medication 0 (0.00%) 5 (19.23%) 3 (12.00%) 2 (8.00%) Prescription NSAIDS 0 (0.00%) 1 (3.85%) 5 (20.0%) 1 (4.00%) Antacids/proton-pump inhibitors and other GI medications 0 (0.00%) 3 (11.54%) 6 (24.00%) 2 (8.00%) Other prescription medication 0 (0.00%) 3 (11.54%) 4 (4.00%) 1 (4.00%) Mean number of prescription medications per person 0.71 (SD = 0.85) 3.69 (SD = 3.90) 4.84 (SD = 3.79) 3.00 (SD = 2.38)All 3 chronic pain groups combined reported significantly worse functioning than pain-free controls on friendship (P = 0.038, Fig. 1A and Table 2), social isolation (P = 0.004, Fig. 1B and Table 2), and social roles (P < 0.001, Fig. 1C and Table 2), but did not differ on any other of the social constructs assessed.
 Figure 1.:
 Raw scores for friendship (A), social isolation (B), and satisfaction with social roles and activities (C) between the pain-free group and the chronic pain group combined (TMD, fibromyalgia, and migraine). TMD, temporomandibular disorder.
3.2. Difference between the chronic pain conditionsContrary to our hypothesis that young women with TMD would report worse social functioning than those with other chronic pain conditions, the 3 chronic pain conditions did not differ from one another on any social functioning variable (all P's > 0.05) (Table 2). Although the average pain intensity significantly differed between the groups (P = 0.010), with participants experiencing fibromyalgia facing significantly worse pain compared with the TMD (P = 0.021, 95% CI −2.80, −0.19) and migraine groups (P = 0.026, 95% CI 0.15, 2.73), the 3 groups remained similar on social functioning even after controlling for pain intensity as a covariate (Table 2).
3.3. Chronic overlapping pain conditionsOf the 76 participants with chronic pain, 32 (42.1%) reported only 1 pain condition, 26 (34.2%) reported 2 conditions, and 18 (23.7%) reported 3 pain conditions. Pain-free controls reported better family relationships (P = 0.018, 95% CI 0.81, 11.98; see Table 4) than those with 3 chronic overlapping pain conditions. They also reported less social isolation than those with 2 (P = 0.020, 95% CI −9.27, −0.56) or 3 (P < 0.001, 95% CI −12.10, −2.45) chronic overlapping pain conditions and more satisfaction with their social roles and activities than patients with 1 (P = 0.002, 95% CI 1.76, 10.43), 2 (P = <0.001, 95% CI 2.32, 11.44), or 3 (P = 0.003, 95% CI 1.86, 11.98) chronic pain conditions. Those who reported 1 chronic pain condition exhibited significantly better family relationships than those with 3 chronic pain conditions (P = 0.024, 95% CI 0.59, 11.47; see Fig. 2). Age and income were similar between those with 0, 1, 2, or 3 pain conditions (P > 0.05). The remaining social domains did not differ as a function of the number of conditions (P's > 0.05).
Table 4 - Comparison of social functioning between young women with 0, 1, 2, or 3 chronic pain conditions. Healthy controls (ie, zero pain conditions) (N = 28) 1 pain condition (N = 32) 2 pain conditions (N = 26) 3 pain conditions (N = 18) P comparing healthy controls with those with 1 pain condition P comparing healthy controls with those with 2 pain conditions P comparing healthy controls with those with 3 pain conditions P comparing 1 pain condition with 2 pain conditions P comparing 1 pain condition with 3 pain conditions P comparing 2 pain conditions with 3 pain conditions Social functioning
留言 (0)