Reagents and materials
Formononetin (purity ≥ 98.0%) was purchased from Yuanye (Shanghai, China). TNF-α (430904), IFN-γ (430804) and IL-12 (431005) ELISA kits and all flow antibodies were obtained from BioLegend (San Diego, CA, USA). The naive CD4 + T cell isolation (130-104-453) was purchased from Miltenyi Biotec (Auburn CA). anti-IL-4 (504122), anti-IFN-γ (505834), anti-CD28mAb (102116),anti-CD3mAb (100340),anti-CD4-FITC (116004), anti-CD8-PE/Dazzle™ 594 (100762), anti-CD3-APC (100236), anti-CD4-FITC (100510), anti-CD25-Brilliant Violet 421™ (102033), anti-Foxp3-Alexa Fluor 647 (320014) and anti-IL-17a-PE (506903) antibodies were obtained from BioLegend (San Diego, CA). mIL-2 (200-02-10) and hTGF-β1 (100-21) were obtained from PeproTech (USA). p-PI3K (4228 T), PI3K (4249 T), p-Akt (4060 T), Akt (4691 T), Foxp3 (14-5773-80) and β-Actin (8475S) antibodies were obtained from Cell Signaling Technology (Danvers, MA, USA) and Invitrogen (Carlsbad, CA, USA).
Animals
Female CByB6F1 mice (bodyweight: 21–26 g) as the experimental models was obtained from Beijing Vital River Laboratory Animal Technology Co., Ltd. Donor C57BL/6J mice was obtained from the Guangdong Medical Laboratory Animal Center.
Animal grouping and immune-mediated BMF model establishment
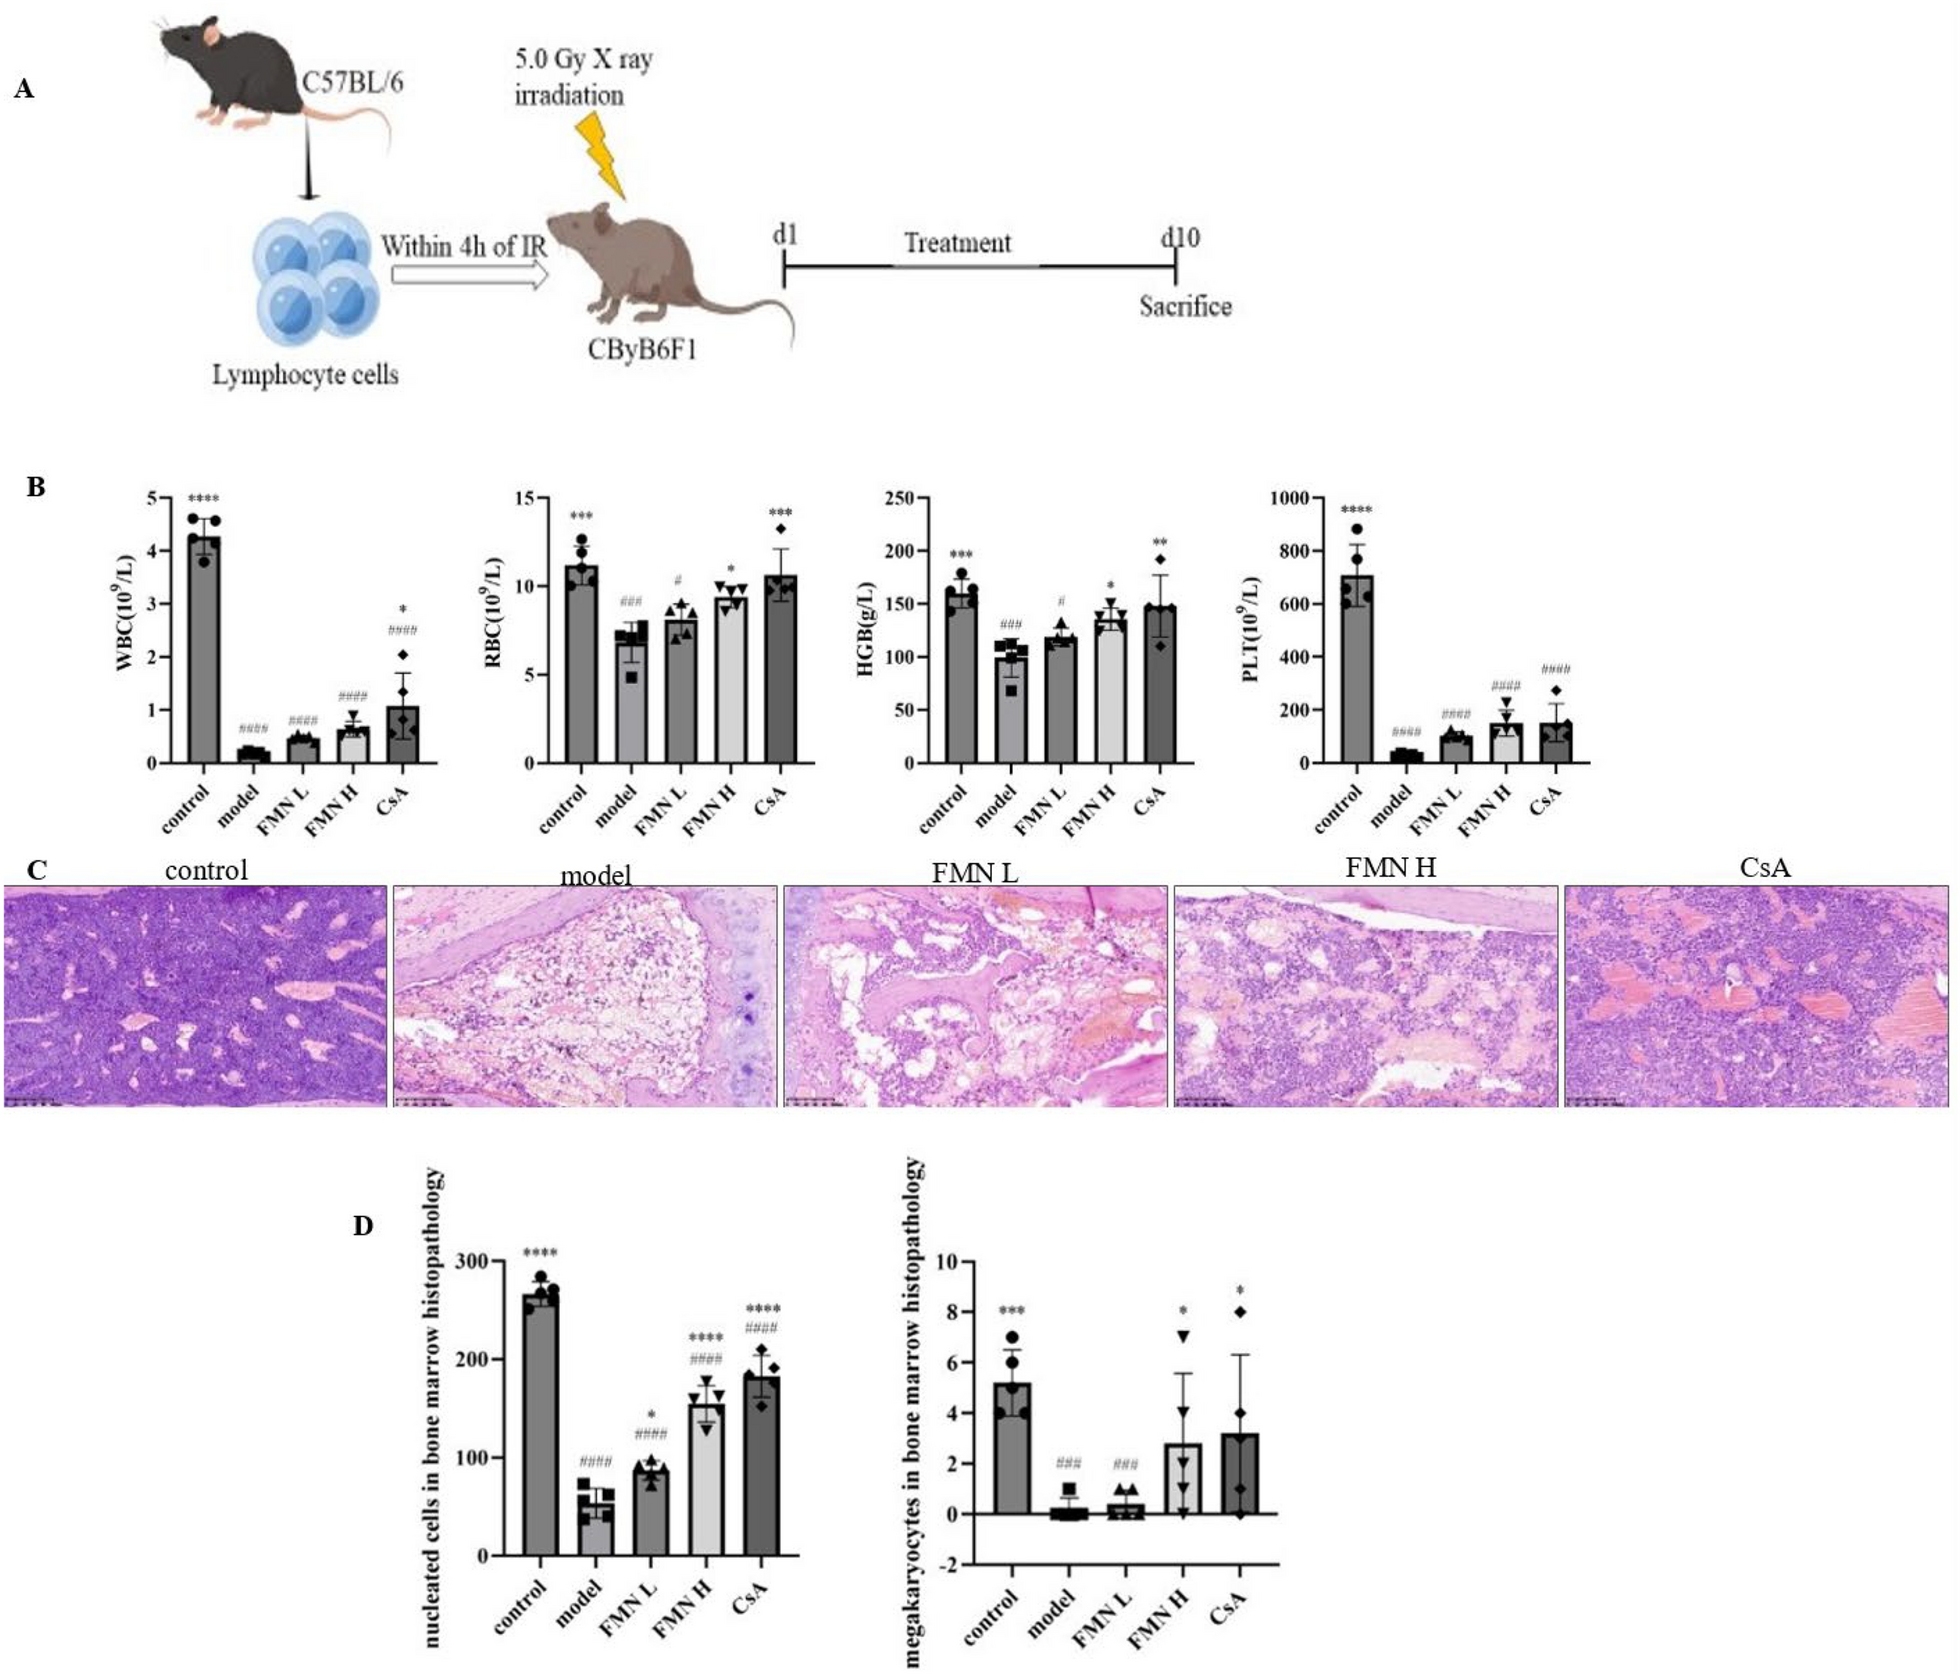
CByB6F1 mice (n = 30) were divided into the following five groups (6 mice/group): control, model, cyclosporine A (CsA), low-dose FMN (FMN-L), and high-dose FMN (FMN-H) groups. The thymus and lymph nodes were collected from donor C57BL/6J mice, homogenized, centrifuged, and resuspended to obtain the lymphocyte suspension by combining thymocytes and lymph node cells at a ratio of 1:2. Except for the control group, all other groups were established by the total body X-ray radiation, followed by intravenous injection of 0.2 mL of the lymphocyte suspension [26]. Drug administration started 24 h after modeling. Mice in the FMN-L or FMN-H group were orally at a dosage of 50 mg/kg or 100 mg/kg bodyweight/day FMN. Meanwhile, mice in the CsA group were intraperitoneally administered with CsA (25 mg/kg bodyweight/day). Mice in the control and model groups were orally administered with an equivalent volume of physiological saline. After 10th day of drug administration, the mice were euthanized to collect samples for further analysis.
Peripheral blood cell analysis
After 10th day of drug administration, peripheral blood samples were collected in EDTA anticoagulant tubes by enucleation of the eyeballs. The peripheral blood sample (100 μL) was subjected to automated hematology analysis to quantify the level of white blood cells (WBC), red blood cells (RBC), hemoglobin (HGB), and platelets (PLT).
Histopathological analysis
The sternum was dissected and fixed with 4% paraformaldehyde for 48 h. The femur was softened using and decalcifying solution, dehydrated using a gradient ethanol series, embedded in paraffin, sectioned, and stained with hematoxylin and eosin. The histopathological changes in each group were observed under an optical microscope. The number of nucleated cells and megakaryocytes in three random high-power fields (400 ×) of each slide was counted and take the average result for statistical analysis.
Flow cytometry analysis
The bone marrow and spleen cells were obtained from the mice and subjected to RBC, counting and processed to obtain the cell suspension. The cells were divided into three groups. The cells in the first group were incubated with Anti-CD4-FITC, anti-CD8-PE/Dazzle™ 594 and anti-CD3-APC antibodies for 30 min and fixed to detect the allocation of T cell subsets. The cells in the second group were incubated with anti-CD4-FITC and anti-CD25-Brilliant Violet 421™ antibodies, fixed, permeabilized, and stained with anti-Foxp3-Alexa Fluor 647 antibodies for 30 min to detect the percentage of Treg cells. Meanwhile, the cells in the third group were stimulated with a stimulant comprising phorbol myristate acetate, ionomycin, and monensin for 5 h, incubated with anti-CD4-FITC antibodies for a duration of 30 min, fixed, permeabilized, and stained with anti-IL-17a-PE antibodies to detect thepercentage of Th17 cells. A single antibody-positive tube was used for compensation adjustment. Flow cytometric analysis was performed using a FACSCalibur instrument, following the manufacturer’s instructions.
Naive CD4 + T cell sorting and polarization
The spleen and lymph nodes were isolated from C57BL/6J mice, homogenized, centrifuged, and resuspended to prepare the lymphocyte suspension. Naive CD4 + T cells were isolated by magnetic-activated cell sorting (MACS) in accordance with the manufacturer’s instructions from lymphocyte suspensions. Then, the naive CD4 + T cells were cultured in a 24-well plate at 4 × 10⁵ cells per well, and 10 ng/mL mIL-2, 10 ng/mL hTGF-β1, 5 µg/mL anti-IL-4, 5 µg/mL anti-IFN-γ and 2.5 µg/mL anti-CD28mAb were added to plates coated with 5 µg/mL anti-CD3mAb to promote the differentiation of Treg cells. After 3 days, Treg cell polarization was examined.
Serum analysis using enzyme-linked immunosorbent assay (ELISA)
The serum levels of IL-12, TNF-α, and IFN-γ in the immune-mediated BMF mice and the level of IL-10 in the cell supernatant were assessed by ELISA. The concentration of these cytokines was determined following the manufacturer’s instructions.
Western blotting
The remaining spleen cells were lysed using RIPA lysis buffer containing protease and phosphatase inhibitors. The sample lysates were, vortexed, and centrifuged. The protein concentrations were determined using the BCA protein quantification kit. The proteins were denatured using 5 × SDS buffer. Equal amounts (40 μg) of proteins were subjected to SDS–polyacrylamide gel electrophoresis. The resolved proteins were transferred to a PVDF membrane. The membranes were blocked with 5% non-fat dry milk in Tris-buffered saline containing Tween-20 (TBST) at room temperature for 2 h and incubated with the p-PI3K, PI3K, p-Akt, Akt, Foxp3 and β-Actin (1:1000) antibodies overnight at a 4 °C. After washing with TBST, the membranes were incubated with the secondary antibodies at room temperature for 1 h. The membranes were washed again with TBST. Immunoreactive bands were detected using ECL luminescence reagent. The grayscale values of the protein bands were determined using ImageJ software.
Immunohistochemistry analysis
The paraffin sections were dewaxed, dehydrated, and subjected to antigen retrieval. To block endogenous peroxidase, the sections were incubated with 3% hydrogen peroxide. The sections were incubated with BSA to block nonspecific binding. Next, the sections were placed in a humid chamber at 4 °C and incubated overnight with PI3K, Akt, and Foxp3 primary antibodies (all 1:250). All antibodies were obtained from Cell Signaling Technology (Danvers, MA, USA) and Invitrogen (Carlsbad, CA, USA). After washing with phosphate-buffered saline, the sections were incubated with secondary antibodies at room temperature for 30 min. Immunoreactive signals were detected using diaminobenzidine (DAB), and the sections were counterstained with hematoxylin. The sections were dehydrated and mounted on glass slides for microscopic analysis. The protein expression levels were independently evaluated by two researchers. The number of Foxp3-positive cells in three random high-power fields (400 ×) of each slide was counted and take the average result for statistical analysis. PI3K and Akt were mainly localized to the cytoplasm. The immunofluorescence intensities of PI3K and Akt were semi-quantitatively analyzed using ImageJ software. The sections without primary antibody but incubated with the same concentration of secondary antibody were used as the negative control.
Statistical analysis
All statistical analyses were performed using SPSS 26.0 software. The experimental data are presented as mean ± standard error of mean. Means between groups were compared using one-way analysis of variance for normally distributed data or nonparametric tests for non-normally distributed data. Graphing was performed using GraphPad Prism 9 software. p < 0.05 was considered as a statistically significant difference.


留言 (0)