
記住我


The fragmentation behaviors of SAA were investigated by employing UPLC–Qtof-MS/MS. The deprotonated ion ([M–H]−) of SAA was observed at m/z 493.11, corresponding to the elemental composition as C26H22O10. After converting HR-m/z to elemental compositions, the fragment ions in MS2 spectrum were assigned as m/z 313.07 [M–H–C9H8O4]−, 295.06 [M–H–C9H10O5]−, 269.08 [M–H–C10H8O6]−, 203.04 [M–H–C9H8O4–C6H6O2]−, 197.05 [M–H–C17H12O5]−, 185.02 [M–H–C9H10O5–C6H6O2]−, 179.03 [M–H–C17H14O6]−, 159.05 [M–H–C10H8O6–C6H6O2]−, 135.04 [M–H–C18H14O8]−, and 109.03 [M–H–C20H16O8]− (Additional file 1: Fig. S1A). Referring to the chemical structure of SAA, the dissociations around the ester bond were regarded as the primary contributions towards the entire mass fragmentation pattern. Similar to the nomenclature rule of peptides, a nomenclature rule was proposed for fragment ions related to the ester bond dissociation, including a−, b−, c−, x−, y−, and z− [22]. Based on the mathematical relationships between complementary ions (such as a− and x−, b− and y−, as well as c− and z−), along with the unique mass differences between a− and b− (CO, 25.98 Da), b− and c− (H2O, 18.01 Da) [33], the featured ions m/z 269.08, 295.06, 313.07, 197.05, and 179.03 were assigned as a−, b−, c−, y−, and z−, respectively. The fragmentation pathways of SAA are proposed in Additional file 1: Fig. S1B, which provide references for the follow-up identification of in vivo metabolites.
Metabolite identification for SAA by applying ester bond dissociation patternAfter carefully comparing each homogenized biological sample with the respective drug-free sample, a total of 29 metabolites (M1–M29) were detected. Thereof, five ones (M17, M18, M20, M22, and M24), thirteen ones (M2–M5, M7, M11, M12, M14, M16, M25, M26, M28, and M29), and sixteen ones (M1, M5–M10, M13, M15, M19, M21, M23, and M26–M29) were distributed in plasma, urine, and feces, respectively. The detailed chromatographic and mass spectrometric information is summarized in Table 1, and representative chromatograms are illustrated in Fig. 2.
Fig. 2
Overlaid extracted ion current chromatograms of SAA-treated plasma (A), urine (B), and feces (C)
Among the metabolites, M1–M4 were derived from hydrolysis of SAA and identified as DSS, SAF glucuronide, hydrogenated SAF, and SAF, respectively. M1 and M4 were identified by comparing with literature and reference substances [35, 36]. The M3 anion (tR, 19.73 min) existed at m/z 315.09 (C17H16O6), which was 2 Da greater than SAF anion. Additionally, typical fragment ions were observed at m/z 271.10 [M–H–CO2]−, 255.06 [M–H–C2H4O2]−, 135.05 [M–H–C9H8O4]−, and 109.02 [M–H–C11H10O4]−; therefore, M3 was finally identified as hydrogenated SAF. The deprotonated ion ([M–H]−) of M2 (tR, 18.15 min) was observed at m/z 489.11, corresponding to a molecular formula as C23H22O12, which was 176 Da (C6H8O6) greater than SAF anion. The fragment ions observed after a neutral loss of 176 Da were consistent with those of SAF, confirming the identification of M2 as a glucuronidation product of SAF.
All other metabolites (M5–M29) were direct derivatives of SAA, and the metabolism regions, either SAF-unit or DSS-unit, were judged based on MS2 spectral information and the ester bond dissociation pattern. The presence of substitution at SAF-unit was determined by calculating the mass difference between c−, b−, and a− ions of metabolites and the corresponding ions of SAA, and similarly, the substitution site at DSS-unit was determined by the mass difference between z− and y− ions of metabolites and their relevant ions of SAA.
Deprotonated ions of M5 (tR, 20.54 min), M7 (tR, 21.52 min), and M8 (tR, 21.94 min) were observed at m/z 669.15, suggesting the molecular formula as C32H30O16 for each. Compared to SAA (molecular formula: C26H22O10), glucuronidation should be responsible for GluA (C6H8O6, 176 Da) fortification. In addition, the signals at m/z 493.11 ([M–H–GluA]−) in MS2 spectra of M5, M7, and M8 further consolidated that these were glucuronidation products of SAA. Subsequent efforts were towards the identification of metabolism regions based on the pattern of ester bond dissociation. The b− (m/z 471.10) of M5 and M7 exhibited 176 Da greater than b− (m/z 295.06) of SAA, while c− (m/z 489.10) and a− (m/z 445.10) ions of M8 also showed a similar increase by 176 Da compared to c− (m/z 313.07) and a− (m/z 269.08) ions of SAA, indicating that glucuronidation occurred at the SAF-unit ([SAF-glucuronide]-[DSS]) for all three ones.
M10 (tR, 22.55 min), M12 (tR, 23.14 min), and M13 (tR, 23.32 min) were all assigned as SAA sulfate (molecular formula: C26H22O13S) attributing to the signals at m/z 573.07 ([M–H]−) in MS1 spectra and m/z 493.11 ([M–H–SO3]−) in MS2 spectra. The c− (m/z 393.04 [M–H–C9H8O4]−) of M10 and M13 showed 80 Da greater than c− of SAA, indicating that sulfation sites might located at the SAF-unit ([SAF-sulfate]-[DSS]). Nevertheless, because the MS2 spectrum of M12 contained few characteristic ions, the conjugation region was not confirmed in the current study.
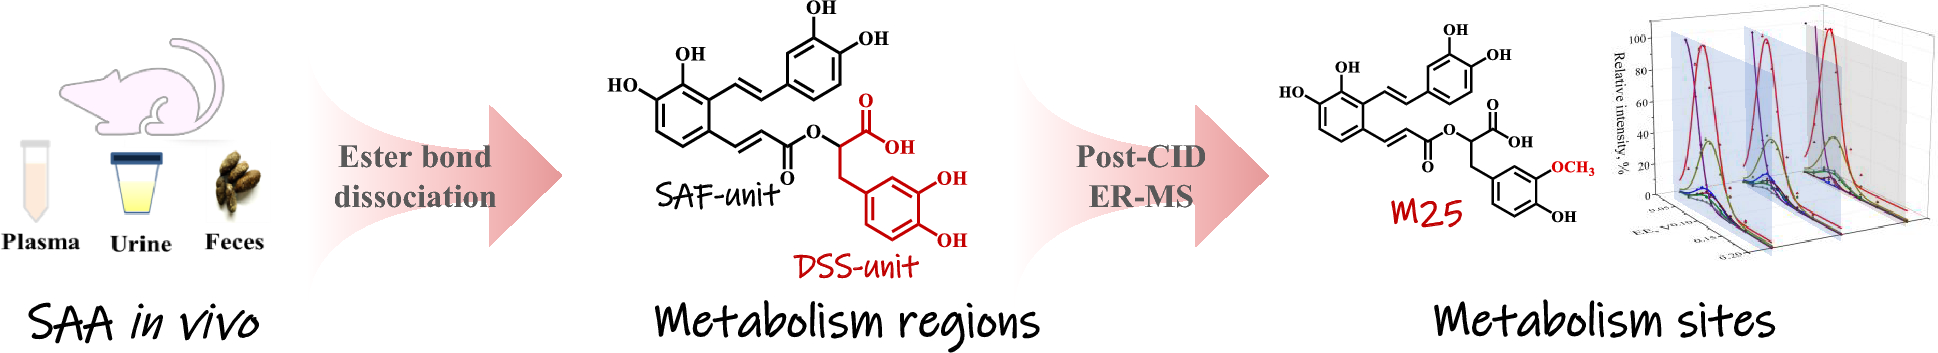
Three isomers, M23 (tR, 25.61 min), M25 (tR, 25.78 min), and M26 (tR, 25.96 min), were all annotated as the methylation products of SAA, because their deprotonated ions at m/z 507.13 ([M–H]−, C27H24O10) were 14 Da (CH2) greater than SAA anion. Thereof, the featured ions c− (m/z 327.09 [M–H–C9H8O4]−) and b− (m/z 309.07 [M–H–C9H10O5]−) of M23 and M26 exhibited a mass increase of 14 Da compared to c− and b− ions of SAA, respectively. Meanwhile, the featured ions y− (m/z 197.05 [M–H–C18H14O5]−) and z− (m/z 179.03 [M–H–C18H16O6]−) of M23 and M26 were consistent with those observed in SAA. The above demonstrated that methylation region was located at SAF-unit ([methyl-SAF]-[DSS]). In addition, m/z 294.06 ([M–H–C9H10O5–CH3·]−·) of M26 was generated by methyl radical cleavage (CH3·) of b−, further confirming the deduction about methylation region. While y− (m/z 211.06) and z− (m/z 193.05) of M25 were found to be 14 Da greater than their counterparts of SAA, this proved that its methylation site was at the DSS-unit ([SAF]-[methyl-DSS]).
M11 (tR, 22.75 min) and M14 (tR, 23.68 min) shared identical precursor ions at m/z 683.16, and the molecular formula was consequently calculated as C33H32O16, implying that either could be the product of methylation plus glucuronidation of SAA. The fragment ions at m/z 507.10 in MS2 spectra were generated by the natural loss of 176 Da. M11 and M14 possessed almost identical fragment ions to M5 ([SAF-glucuronide]-[DSS]), including m/z 471.10 (b−), 313.07 (c−–176 Da), and 295.06 (b−–176 Da), suggesting that glucuronidation site of M11 and M14 was located at the SAF-unit. Subsequently, based on the complementarity of b− and y− ion, the mass of y− was presumed to be m/z 211.06, which was consistent with [M–H]− of monomethylated DSS, indicating that the methylation site was at the DSS-unit. Together, M11 and M14 were identified as [methyl-DSS]-[SAF-glucuronide].
In the case of a pair of isomers, M28 (tR, 26.73 min) and M29 (tR, 26.89 min), their empirical formulas were all suggested as C28H26O10 based on the deprotonated ions at m/z 521.14 ([M–H]−). Compared to SAA, di-methylation should be responsible for two CH2 (28 Da) fortification. The MS2 spectra of M28 and M29 exhibited an identical set of fragment ions, including c− (m/z 327.09), b− (m/z 309.08), y− (m/z 211.06), and z− (m/z 193.05). Thereof, c− and b− were identical with c− and b− of M23 and M26 ([methyl-SAF]-[DSS]), respectively; meanwhile, y− and z− corresponded to those of M25 ([SAF]-[methyl-DSS]). Hence, two methylation sites separately occurred at either unit of SAA, and finally, M28 and M29 were termed as [methyl-SAF]-[methyl-DSS].
The deprotonated ions ([M–H]–) of M16 (tR, 24.66 min), M17 (tR, 24.68 min), M18 (tR, 25.07 min), M20 (tR, 25.42 min), M22 (tR, 25.54 min), and M24 (tR, 25.70 min) occurred at m/z 697.18 (molecular formula: C34H34O16), indicating that they were resulted from fortifying two CH2 together with a glucuronyl group to SAA. In MS2 spectra of M16–M18, M20, and M24, the product ions at m/z 327.09, 309.08, 294.06, 211.07, and 193.05 corresponded to the featured ions of the di-methylation metabolites of SAA described above. Therefore, two methylation sites separately located at SAF-unit and DSS-unit, i.e., [methyl-SAF]-[methyl-DSS]-glucuronide. However, in the MS2 spectrum of M22, there was not enough characteristic fragment ions to support the determination of the methylation sites; therefore, M22 was tentatively identified as di-methyl-SAA glucuronide. Unfortunately, neutral loss of GluA was observed prior to ester bond dissociation in CID, resulting in the absence of featured fragment ions, and as a consequence, it was challenging to determine the glucuronidation site.
The deprotonated molecular ion ([M–H]–) of M21 (tR, 25.52 min) was observed at m/z 477.12 (C26H22O9), which was 16 Da less than SAA. Other featured ions in MS2 spectrum, such as c− (m/z 313.07) and b− (m/z 295.06) were consistent with the fragment ions of the prototype. Therefore, M21 was identified as the dehydroxylated derivative of SAA and dehydroxylation occurred on the DSS-unit ([SAF]-[DSS-dehydroxylated]).
M19 (tR, 25.32 min) possessed a [M–H]− signal as m/z 491.10 (molecular formula: C26H20O10), 2 Da less than SAA, indicating it might be dehydrogenation product of SAA. The metabolism site was determined to be at the SAF-unit by comparing the featured fragment ions of M19 and SAA, including c− (m/z 311.05 vs. 313.07), b− (m/z 293.05 vs. 295.06), a− (m/z 267.06 vs. 269.08), y− (m/z 197.05 vs. 197.05), and z− (m/z 179.04 vs. 179.04). Through referring the descriptions in the literature [17, 36, 37], M19 was definitely determined as salvianolic acid C (SAC).
M6 (tR, 20.91 min), M9 (tR, 22.42 min), and M15 (tR, 24.06 min) shared an identical [M–H]− ion at m/z 667.13 (C32H28O16), which was 176 Da greater than that of SAC, and their generation should be attribute to the glucuronidation for SAC. Meanwhile, in MS2 spectra of M6 and M15, the featured ions including b− (m/z 469.07) and c− (m/z 487.10), were 176 Da greater than the b− (m/z 293.05) and c− (m/z 311.05) of SAC, respectively, which reminded that the glucuronidation sites might locate at the SAF-unit ([tournefolic acid A-glucuronide]-[DSS]). Nevertheless, the MS2 spectrum of M9 displayed a characteristic ion of y− (m/z 355.07), indicating that the conjugation site on the DSS-unit ([tournefolic acid A]-[DSS-glucuronide]).
The [M–H]− ion of M27 was observed at m/z 475.10 with a retention time of 26.42 min, and the molecular formula thereafter came out as C26H20O9. M27 was 16 Da less than SAC, and as a result, dehydroxylation should be responsible for the metabolic process. Moreover, fragment ions c− (m/z 311.07) and b− (m/z 293.04) were detected in the MS2 spectrum, corresponding to c− and b− of SAC, implying that the metabolism region occurred at the DSS-unit. Consequently, M27 was tentatively identified as dehydroxylated SAC ([tournefolic acid A]-[DSS-dehydroxylated]).
Isomeric identification of methylation metabolitesThrough analyzing HR-MS/MS spectral information, the metabolites of SAA in vivo were tentatively annotated. Thereafter, based on the ester bond dissociation features, one step forward was achieved through placing the metabolism site(s) onto SAF-unit and/or DSS-unit. To further advance structural identification confidence, three isomeric metabolites of methylation, such as M23, M25, and M26, were employed as representatives to elaborate structural identification details. Noteworthily, to aid structural identification for SAA metabolites, the metabolites of SAF (F1–F30) and DSS (D1–D15) were first characterized carefully through matching with the information archived in the literature [38,39,40]. Attributing to the relatively simple structures, confirmative identification was usually achieved, and their identities together with key MS/MS spectral information were summarized in Additional file 1: Tables S1, S2.
According to the annotation of SAA methylation region mentioned above, M23 and M26 occurred at the SAF-unit, while M25 took place at the DSS-unit, but the specific metabolism site could not be determined, e.g., either the C-3-OH or C-4-OH of DSS. Based on the fact that the c− and y− ions produced by ester bond dissociation should show identical structures to those of the hydrolysis product anions, we thereby employed the post-CID ER-MS strategy. The strategy was performed to determine the structures of the c− and y− ions by comparing the FEER-MS3 spectra of c− and y− ions for esters with FEER-MS2 spectra of [M–H]– for candidate hydrolysis products. Therefore, the methylation metabolites (F28 and F29, as well as D14 and D15) of both SAF and DSS were involved.
Through programming online ER-MS to the constructed two ion transitions (m/z 507.13 > 211.06 for M25 and 507.13 > 327.09 for M23 and M26), the OCEs were −38.2 eV and −29.1 eV, respectively. When constructing Q1 > Q3 > QLIT ion transitions, OCE was defined in q2, and progressive EEs were implemented in LIT chamber to acquire the FEER-MS3 spectra. Meanwhile, [M–H]– of each candidate hydrolysis product was permitted to pass q2 cell without dissociation through defining low CE as −10 eV, and thereby acquiring the FEER-MS2 spectra of [M–H]– for candidate hydrolysis products.
FEER-MS3 spectra of m/z 507.13 > 211.06 for M25 together with m/z 211.06 > 211.06 for D14 and D15 are illustrated in Fig. 3A. FEER-MS3 spectrum of y− (m/z 211) for M25 involved the breakdown graphs of m/z 211 (EE50, −0.05626 V), 193 (OEE, −0.06746 V; RIIOEE, 100%), 178 (−0.07292 V; 3.87%), 165 (−0.07239 V; 12.46%), 150 (−0.07918 V; 10.25%), 149 (−0.07172 V; 7.51%), and 134 (−0.07870 V; 43.54%). The EE50 and OEEs of M25 did not exhibited consistency to D14 and D15, while RIIOEE values demonstrated the similarities and the differences. The RIIOEE values for each 2nd-generation fragment ion of M25 were consistent with those of D14 anion (m/z 193, 100%; m/z 178, 3.57%; m/z 165, 13.22%; m/z 150, 10.08%; m/z 149, 7.48% and m/z 134, 38.30%), but did not exhibit such agreement with the D15 anion (m/z 193, 100%; m/z 178, 10.29%; m/z 165, 1.61%; m/z 150, 4.77%; m/z 149, 8.42% and m/z 134, 32.97%). The detailed information and the RIIOEE-trend curves of M25, D14, and D15 are shown in Additional file 1: Table S3 and Fig. S2. The FEER-MS3 spectrum of y− for M25 matched well with the FEER-MS2 spectrum for D14 (3-methyl-DSS) anion. In conclusion, M25 was configured as 3″-methyl-SAA.
Fig. 3
FEER-MS3 spectra for monomethylated SAA metabolites compared with FEER-MS2 spectra for hydrolysis product anions. (A) Overlaid FEER-MS3 spectrum of m/z 211.06 for M25, along with FEER-MS2 spectra for D14 and D15 anions; (B) Overlaid FEER-MS3 spectra of m/z 327.09 for M23 and M26, along with FEER-MS2 spectra for F28 and F29 anions
In the same vein, M23, M26, F28, and F29 were also assayed using post-CID ER-MS strategy to produce FEER-MS3 and FEER-MS2 spectra (Fig. 3B). Great consistence occurred between FEER-MS3 spectrum of c− for M23 and FEER-MS2 spectrum for F28 anion, either of which was made up of the post-CID breakdown graphs of m/z 327 (EE50, −0.04542 V for M23 and −0.04541 V for F28), 268 (OEE and RIIOEE, −0.06916 V and 91.51% for M23 vs. −0.05896 V and 55.66% for F28), 159 (−0.05461 V and 100% for M23 vs. −0.04939 V and 100% for F28), 146 (−0.06836 V and 6.75% for M23 vs. −0.06971 V and 12.86% for F28), 123 (−0.04614 V and 26.11% for M23 vs. −0.04619 V and 26.12% for F28) and 108 (−0.06773 V and 18.58% for M23 vs. −0.06082 V and 25.38% for F28). Similarly, there exhibited a significant similarity between FEER-MS3 spectrum of y− for M26 and FEER-MS2 spectrum for F29 anion, either of which was composed of breakdown graphs of m/z 327 (−0.03645 V for M26 and − 0.03427 V for F29), 268 (−0.05664 V and 100% for M26 vs. −0.05594 V and 100% for F29), 159 (−0.06762 V and 8.71% for M26 vs. −0.07407 V and 6.00% for F29, 146 (−0.06419 V and 29.29% for M26 vs. −0.07071 V and 30.10% for F29), 123 (−0.05786 V and 0.08% for M26 vs. −0.07866 V and 0.60% for F29) and 108 (−0.04591 V and 1.28% for M26 vs. −0.04017 V and 1.08% for F29). The information above is listed in Additional file 1: Table S4 and trend curves of RIIOEE are shown in Additional file 1: Fig. S3. The OEE values of M23, M26, F28, and F29 exhibited no discernible distinction, but EE50 value for M23 closely resembled that of F28, while M26 consistently aligned with the F29. Finally, M23 was tentatively identified as 3'-methyl-SAA and M26 as either 2-methyl-SAA or 3-methyl-SAA.
Above all, FEER-MS3 and FEER-MS2 spectra matching is meaningful for structural annotation because RIIOEE feature is eligible to capturing diagnostic fragment ions and post CID ER-MS should be a credible strategy to identified fragment ions.
Noteworthily, the post-CID ER-MS strategy could be applicable for identifying any other metabolites, not limited to monomethylated metabolites. In theory, the acquisition of the FEER-MS3 spectrum of the concerned 1st-generation fragment ion can be achieved by employing the post-CID ER-MS strategy whenever the c–and z– ions generated from ester bond dissociation are detectable in the MS2 spectrum. However, glucuronidated and sulfonated substituents are susceptible to neutral loss under CID, and when they are fragmented preferentially over the ester bond, c− or y− ions are unavailable to acquire FEER-MS3 spectra. Subsequent attempts can be made to retain the glucuronosyl and sulfonyl by altering to other dissociation patterns, such as electron capture dissociation (ECD) and electron transfer dissociation (ETD). To some extent, it is extremely challenging to elucidate the exact structures of all metabolites for SAA. Therefore, the current study focused solely on discussing and analyzing methylation as a typical example, which effectively demonstrated the feasibility and practicality of this approach called FEER-MS3 and FEER-MS2 spectra matching.
Metabolism channels of SAA in ratsAfter the confidence-enhanced structural annotation for all metabolites (M1–M29), the metabolic pathways for SAA were proposed (Fig. 4). SAA underwent ester bond hydrolysis and further metabolism to produce M1–M4. SAA underwent glucuronidation, sulfation, methylation, or a combination of these to generate a series of metabolites (M5, M7, M8, M10–M14, M16–M18, M20, M22–M26, M28, and M29). SAA could directly undergo dihydroxylation to produce M21. SAA was able to give birth to SAC (M19) via oxidation, and subsequently to generate M27, M6, M9, and M15 through dehydroxylation and glucuronidation. The absence of SAA in plasma indicated that extensive metabolism occurred. All five metabolites detected in plasma were di-methylation plus glucuronidation products. The lower number of metabolites in rat plasma may be attributed to the lower bioconversion activity or the significantly low oral bioavailability and short plasma elimination half-life of SAA in rats [9]. SAC resulting from SAA dehydrogenation and further metabolites were only detected in feces, but not excreted via urine, presumably because feces and urine were closely related biliary and renal excretion, respectively.
Fig. 4
The proposed metabolism channels of salvianolic acid A (SAA) in vivo. Blue: metabolism sites at SAF-unit; Red: metabolism sites at DSS-unit; Purple: metabolism sites at both SAF and DSS, one on each side
留言 (0)