
記住我
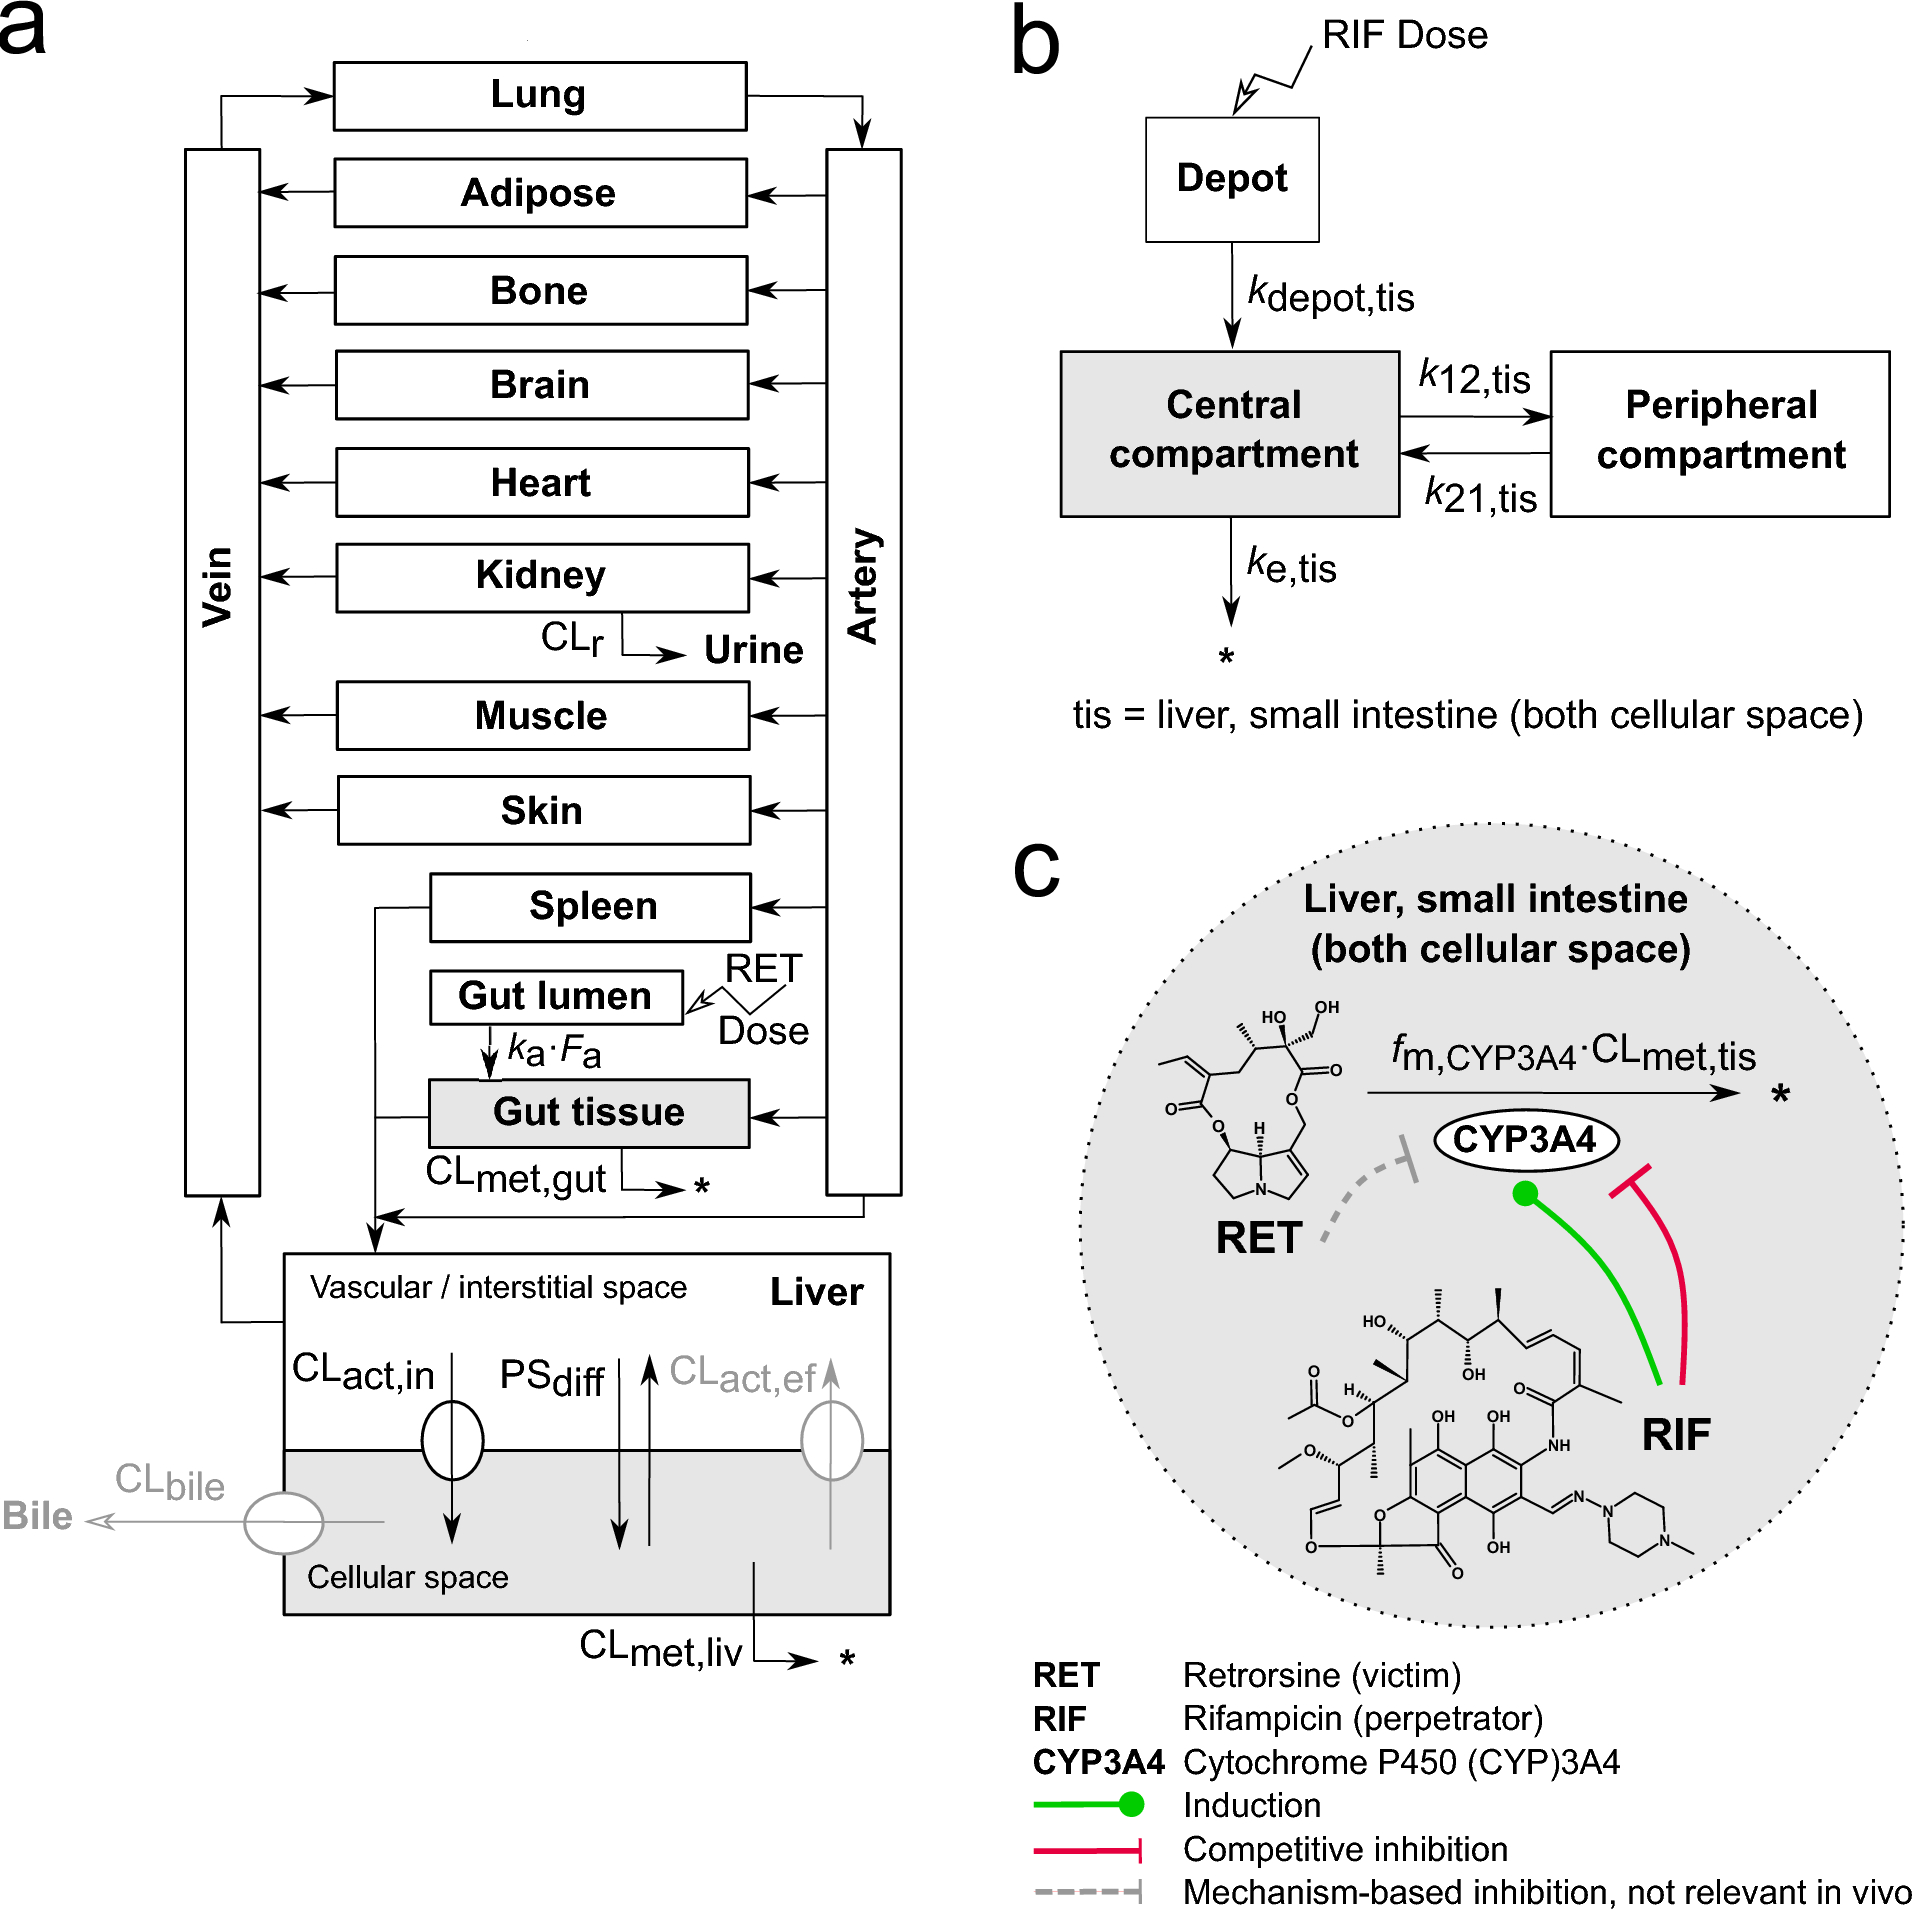

The PBTK model structure (Fig. 1a) was adopted from our previously published mouse and rat PBTK model of retrorsine (Lehmann et al. 2023). Based on the substrate affinity of retrorsine toward the previously described hepatic uptake transporters, the extended clearance model of the liver was integrated considering hepatic transport in addition to hepatic metabolism (Patilea-Vrana and Unadkat 2016; Schweinoch 2014; Sirianni and Pang 1997).
Anatomy- and physiology-related model parameters, such as tissue volumes V\(_}\) and blood flows Q\(_}\), were updated from rodents to the standard male human of 73 kg body weight with average age of 35 years (ICRP 2002). Tissue distribution of retrorsine was described via predicted tissue-to-plasma partition coefficients K\(_}\) (Rodgers and Rowland 2006). Collection of physiological parameters as well as prediction of K\(_}\) was based on a pharmacometric modeling framework provided by Hartung and Huisinga (2019).
Biochemical parameters characterizing hepatic uptake and metabolism of retrorsine were determined experimentally and scaled via in vitro-to-in vivo extrapolation. Passive diffusion PS\(_}\) and transporter-mediated uptake CL\(_}\) into the liver cell were quantified from medium loss assays with cultivated HepaRG cells at non-physiological (4 \(^\circ\)C) and physiological (37 \(^\circ\)C) temperature, respectively. Measurements from medium loss assays were previously published by Enge et al. (2021). We described the time-dependent depletion of retrorsine in the incubation medium with a monoexponential model (Eq. S16). The rate constants \(\lambda _}\) and \(\lambda _}\), used for calculation of PS\(_}\) and CL\(_}\) (Eqs. S17–S20), were estimated using Markov Chain Monte Carlo (MCMC) analysis. Of note, CL\(_}\) describes the phenomenological uptake by all transporters of that retrorsine is a substrate including OCT1 and NTCP. Individual kinetics of distinct uptake transporters as well as saturation of transport were not included in the PBTK model. For a detailed protocol of the medium loss assay, see Supplementary Information (‘Culture of HepaRG cells’ and ‘Medium loss assay’).
Liver metabolic clearance CL\(_}\) was determined using human liver microsomes with different retrorsine concentrations to account for saturation of metabolism (for detailed protocol see Supplementary Information ‘Liver microsomal assay’). We described the time- and concentration-dependent depletion of retrorsine in liver microsomes by the end-product inhibition model (Eqs. S21–S24), which assumes irreversible inhibition of CYP enzymes by reactive dehydro-PA metabolites in vitro. The maximum reaction velocity \(V_}\), the Michaelis–Menten constant \(K_}\) and the concentration at half-maximal inhibition \(\text _\) of the end-product inhibition model were estimated using MCMC. This end-product inhibition of retrorsine is relevant in closed in vitro systems including liver microsomes as shown for CYP3A4 (Dai et al. 2010). However, in vivo it was assumed to be not relevant, because dynamic flows constantly remove reactive metabolites. This assumption was shown to be valid for mouse hepatic kinetics of retrorsine (Lehmann et al. 2023).
Active efflux clearance CL\(_}\) and biliary clearance CL\(_}\) were assumed negligible based on observations in rodents (see Lehmann et al. (2023)). Overall liver clearance CL\(_}\) of retrorsine was calculated according to the extended clearance model (Patilea-Vrana and Unadkat 2016):
$$\begin \text _}= \, \frac} \cdot f_} \cdot \text _} \cdot (\text _} + \text _})}} \cdot (\text _} + \text _} + \text _}) + f_} \cdot \text _} \cdot (\text _} + \text _}) } \end$$
(1)
with Q\(_}\) = hepatic blood flow, f\(_}\) = fraction unbound in plasma, CL\(_}\) = active influx clearance, CL\(_}\) = liver metabolic clearance (ratio of \(V_}\) to \(K_}\)), \(V_}\) = maximum metabolism reaction velocity, \(K_}\) = concentration at half-maximal metabolism reaction velocity, CL\(_}\) = biliary clearance, CL\(_}\) = active efflux clearance.
Included extrahepatic elimination routes were intestinal metabolism and renal excretion. Glomerular filtration was considered the predominant mechanism of renal clearance CL\(_}\) as suggested in rodents (Lehmann et al. 2023). Regarding intestinal metabolism, \(K_}\) and \(V_}\) were specified in accordance with a comparative analysis of hepatic and intestinal metabolic activity of CYP3A substrates in vitro (Galetin and Houston 2006). The intestinal Michaelis–Menten constant was assumed to be identical to that of hepatic metabolism (\(K_}=K_}\)). The maximum reaction velocity \(V_}\) was assumed to be smaller by factor 10 compared to \(V_}\) of hepatic metabolism and confirmed by sensitivity analysis indicating similar model predictions. In addition, we introduced a volume fraction of gut tissue \(F_}\) that represents the cellular space of the small intestine to confine retrorsine gut metabolism to the site of CYP3A4 expression (Eq. S8).
Oral uptake of retrorsine was modeled as first-order absorption process from the gut lumen to the gut tissue. The intestinal absorption rate constant \(k_}\) was estimated previously based on kinetic data from an oral dose study in mice (Lehmann et al. 2023). The fraction absorbed from the gut \(F_}\) was calculated previously making use of a correlation between Caco-2 cell permeability and human intestinal absorption, which was reported for a set of 93 diverse compounds (Lehmann et al., 2023; Skolnik et al., 2010).
The full system of ordinary differential equations of the PBTK model of retrorsine is given in Eqs. S1–S12 with all model parameters shown in Table S1.
Fig. 1
a Physiologically-based toxicokinetic (PBTK) model of retrorsine. The liver compartment was represented by the extended clearance model accounting for hepatic transport and metabolism. b Empirical 2-compartment model of rifampicin parametrized for liver (intracellular) and small intestine (intracellular), separately. c Retrorsine-rifampicin interaction mediated by CYP3A4 induction and competitive CYP3A4 inhibition by rifampicin. All parameters of the retrorsine-rifampicin interaction model are summarized in Tables S1–S2. The full system of ordinary differential equations is given in Eqs. S1–S15. CL\(_}\) Active uptake clearance; CL\(_}\) Active efflux clearance; CL\(_}\) Biliary clearance; CL\(_}\) Gut metabolic clearance; CL\(_}\) Liver metabolic clearance; CL\(_}\) Liver or gut metabolic clearance; CL\(_}\) Renal clearance; \(F_}\) Intestinal fraction absorbed; \(f_},}3A4}\) Fraction of retrorsine metabolized by CYP3A4; k12,tis Transition rate constant from central to peripheral compartment for rifampicin; k21,tis Transition rate constant from peripheral to central compartment for rifampicin; \(k_}\) Intestinal absorption rate constant; \(k_}\) Absorption rate constant from depot compartment for rifampicin; \(k_}\) Elimination rate constant for rifampicin; PS\(_}\) Passive influx diffusion flow rate; tis = liver cellular space or small intestine (both cellular space)
2-Compartment model of rifampicinFor prediction of rifampicin kinetics a previously published PBPK model was used (Hanke et al. 2018). The model was available in the Open Systems Pharmacology (OSP) Suite (https://www.open-systems-pharmacology.org/, accessed 3 April 2023) and was evaluated for the prediction of CYP3A4-mediated interactions. Rifampicin uptake transport by organic anion transporting polypeptide 1B1 (OATP1B1), metabolism by acrylacetamide deacetylase (AADAC), efflux transport by P-glycoprotein (P-gp) and glomerular filtration were included in the model. Furthermore, auto-induction of OATP1B1, AADAC and P-gp expression were considered.
The OSP Suite and the R framework (see Methods section ‘Software’) have a different compartmentalization of liver and gut. To obtain comparable rifampicin concentration-time profiles, rifampicin kinetics from the OSP Suite needed a scaled integration in the R framework of this study. More specific, the OSP Suite differentiated between vascular, interstitial and cellular space for both tissues. The presented R framework has for the liver a lumped vascular/interstitial separated from a cellular space. The gut tissue represents the vascular, interstitial and cellular space of both the large and the small intestine, all together. As the cellular space of the small intestine is the site of intestinal CYP3A4 expression, the intracellular small intestine concentrations of the OSP model were considered as the most relevant concentrations and therefore integrated in the R framework as gut tissue concentrations. The observed rifampicin concentrations of the cellular space of liver and small intestine were scaled with the corresponding tissue volumes (Table S1, liver cellular space, gut tissue) to account for minor volume differences between the OSP Suite/R software (i.e. liver cellular space 1.59 L vs. 1.30 L, gut tissue 1.13 L vs. 1.02 L). A 2-compartment disposition model with first-order absorption was fitted to the scaled concentration-time profiles of liver and small intestine (both intracellular), respectively (Fig. 1b and Eqs. S13–S15). The rate constants \(k_}\), k12,tis, kk21,tis and \(k_}\) were estimated via MCMC. Model evaluation plots and estimated parameters are provided as Supplementary Information (‘Evaluation of the 2-compartment model of rifampicin’, Fig. S1 and Table S2).
Modeling of the CYP3A4-mediated interactionTo predict the CYP3A4-mediated interaction, induction and simultaneous competitive inhibition of the enzyme by rifampicin, were integrated in the model (Fig. 1c, green and red arrows). CYP3A4 induction was modeled by addition of an induction process in the CYP3A4 turnover equation, exemplarily shown for the liver cellular space (subscript liv, superscript c):
$$\begin \begin \frac_}^}(t)}}t}&= \underbrace} }_\text \cdot \Big (1+ \underbrace}} \cdot \frac_}^}(t)}}^}}}_+ \frac_}^}(t)}}^}}} }_\text \Big ) - \underbrace} \cdot \text _}^}(t) }_\text \\ R_}&= k_} \cdot \text _}^} \end \end$$
(2)
with \(d\text _}^}(t)/dt\) = change of CYP3A4 amount in liver cellular space over time t, \(R_}\) = rate of CYP3A4 synthesis in absence of inducer (steady-state assumption), \(k_}\) = degradation rate constant, \(\text _}^}\) = CYP3A4 baseline amount, \(V_}^}\) = volume of the liver cellular space, \(E_}}\) = maximal induction effect of rifampicin in vivo, \(\text _\) = rifampicin concentration at half-maximal induction in vivo, \(\text _}^}(t)\) = rifampicin amount.
The induction process was characterized by \(\text _ = 0.340\,\upmu\)mol/L (corrected for protein binding) and \(E_}} = 9.00\) based on CYP3A4 induction in human primary hepatocytes (Hanke et al. 2018; Templeton et al. 2011; Shou et al. 2008).
Competitive inhibition of CYP3A4 by rifampicin was modeled by addition of an inhibitor process on the Michaelis–Menten constant \(K_}\) of the cellular retrorsine metabolism as follows:
$$\begin \begin \frac_}^} (t)}}t}&= \ldots - f_} \cdot \frac} \cdot \text _}^}(t)}} \cdot \Big (1+ \underbrace_}^}(t)}}^}} \cdot \frac} }_ } \\ } \end} \Big ) + f_}^} \cdot \frac_}^}(t)}}^}}} \cdot f_}^} \cdot \frac_}^}(t)}}^}} \end \end$$
(3)
with \(d\text _}^} (t)/}t\) = change of retrorsine amount in the liver cellular space over time t, \(f_}\) = fraction of retrorsine metabolized by CYP3A4, \(k_}\) = catalytic constant, \(\text _}^}(t)\) = CYP3A4 amount, \(K_}\) = retrorsine concentration at half-maximal reaction velocity, \(\text _}^}(t)\) = rifampicin amount, \(V_}^}\) = volume of liver cellular space, \(K_\) = rifampicin concentration at half-maximal inhibition, \(f_}^}\) = fraction unbound in liver cellular space.
The competitive inhibition process was parametrized by \(K_} = 18.5\,\upmu\)mol/L, as determined in human liver microsomes (Hanke et al. 2018; Kajosaari et al. 2005).
Equivalently to the liver, the interaction was implemented in the gut (Eqs. S8 and S12). The retrorsine PBTK model and the hepatic and intestinal rifampicin two-compartment model were linked and their ordinary differential equations were solved simultaneously. Mechanism-based inhibition of CYP3A4 by reactive dehydro-PA metabolites in vitro (Dai et al. 2010) (Fig. 1c, grey dashed arrow) was not integrated in the PBTK model since it was assumed to be not relevant in vivo (see Methods section ‘PBTK model of retrorsine’).
Fraction of retrorsine metabolized by CYP3A4The fraction of retrorsine metabolized by CYP3A4 \(f_}\) was derived from in vitro assays with individual human recombinant CYP supersomes (Ruan et al. 2014). Graphical data reporting the concentration of protein adducts formed from oxidation of retrorsine by individual CYP isoforms were extracted using the online tool WebPlotDigitizer (Rohatgi 2020). The following protein adduct concentrations (nM) were obtained: 34.2 (CYP1A1), 47.4 (CYP1A2), 451 (CYP2A6), 387 (CYP3A4), 292 (CYP3A5), 132 (CYP2B6), 71.1 (CYP2C9), 123 (CYP2C19), 153 (CYP2D6), 63.6 (CYP2E1). Protein adduct concentrations were scaled linearly with the abundance of hepatic CYP isoforms in vivo (pmol/mg): 10 (CYP1A1), 39 (CYP1A2), 27 (CYP2A6), 93 (CYP3A4), 17 (CYP3A5), 16 (CYP2B6), 61 (CYP2C9), 11 (CYP2C19), 12.6 (CYP2D6), 64.5 (CYP2E1) (Achour et al. 2014; Klomp et al. 2020). The resulting percentage of retrorsine-derived protein adducts formed by CYP3A4 among the sum of all scaled protein adducts was 52.7%. Under the assumption that the fraction of retrorsine metabolized by CYP3A4 is equal to the fraction of retrorsine-derived protein adducts formed by CYP3A4, \(f_}\) was set to 0.527. Integration of \(f_}\) into the PBTK model allowed the simulation of CYP3A4 metabolites of retrorsine. Accordingly, the fraction of non-CYP3A4 metabolites of retrorsine formed was modeled as 1-\(f_}\).
Simulated exposure scenariosIn the scenario ‘herbal tea’, the daily consumption of herbal tea with a retrorsine dose of 0.019 \(\upmu\)g/kg body weight/day was simulated for 5 weeks. In the scenario, ‘herbal tea + rifampicin’, the daily consumption of this herbal tea was combined with a 2-week daily therapeutic dose (start at day 4) of 600 mg rifampicin orally. Population median consumption of herbal tea was taken from Dusemund et al. (2018) (Table 5, ‘Herbal tea not specified’, Median intake). 600 mg of rifampicin per day correspond to the recommended therapeutic dose for the treatment of tuberculosis (van Ingen et al. 2011).
The retrorsine dose in both exposure scenarios was set equal to the total PA dose of published consumption data, since no PBTK models are available for all different types of PAs and PA N-oxides that can be found in herbal tea.
Sensitivity analysisA sensitivity analysis was performed to identify the influence of the interaction model parameters \(f_}\), \(\text _\), \(E_}}\) and \(K_}\) on the formation of hepatic and intestinal retrorsine CYP3A4 metabolites at five weeks of simulation. To test sensitivity, the four parameters were reduced by 10% and increased by 10%. The corresponding sensitivity coefficients were calculated as follows:
$$\begin } = \frac}} \end$$
(4)
with \(\Delta A\) = the difference between the resulting and original (\(A_\)) predicted cumulative concentration of CYP3A4 metabolites at 5 weeks of simulation, \(\Delta p\) = the difference between the resulting and initial (\(p_\)) parameter values.
SoftwareAll modeling activities were performed within the software R Version 4.3.2 (R Core Team 2023) and RStudio Version 2023.09.1.494 (Posit Team 2023). Parameter estimates of MCMC (R packages dfoptim, Varadhan et al. (2020) and FME, Soetaert and Petzoldt (2010)) were reported as mode and (95% credible interval) of the posterior distribution (R package bayestestR, Makowski et al. (2019)). Ordinary differential equations were solved using the R package rxode2 (Fidler et al. (2023)). Figures were generated by the R package ggplot2 (Wickham 2016) and finalized within InkScape (InkscapeProject 2020).
留言 (0)