
記住我
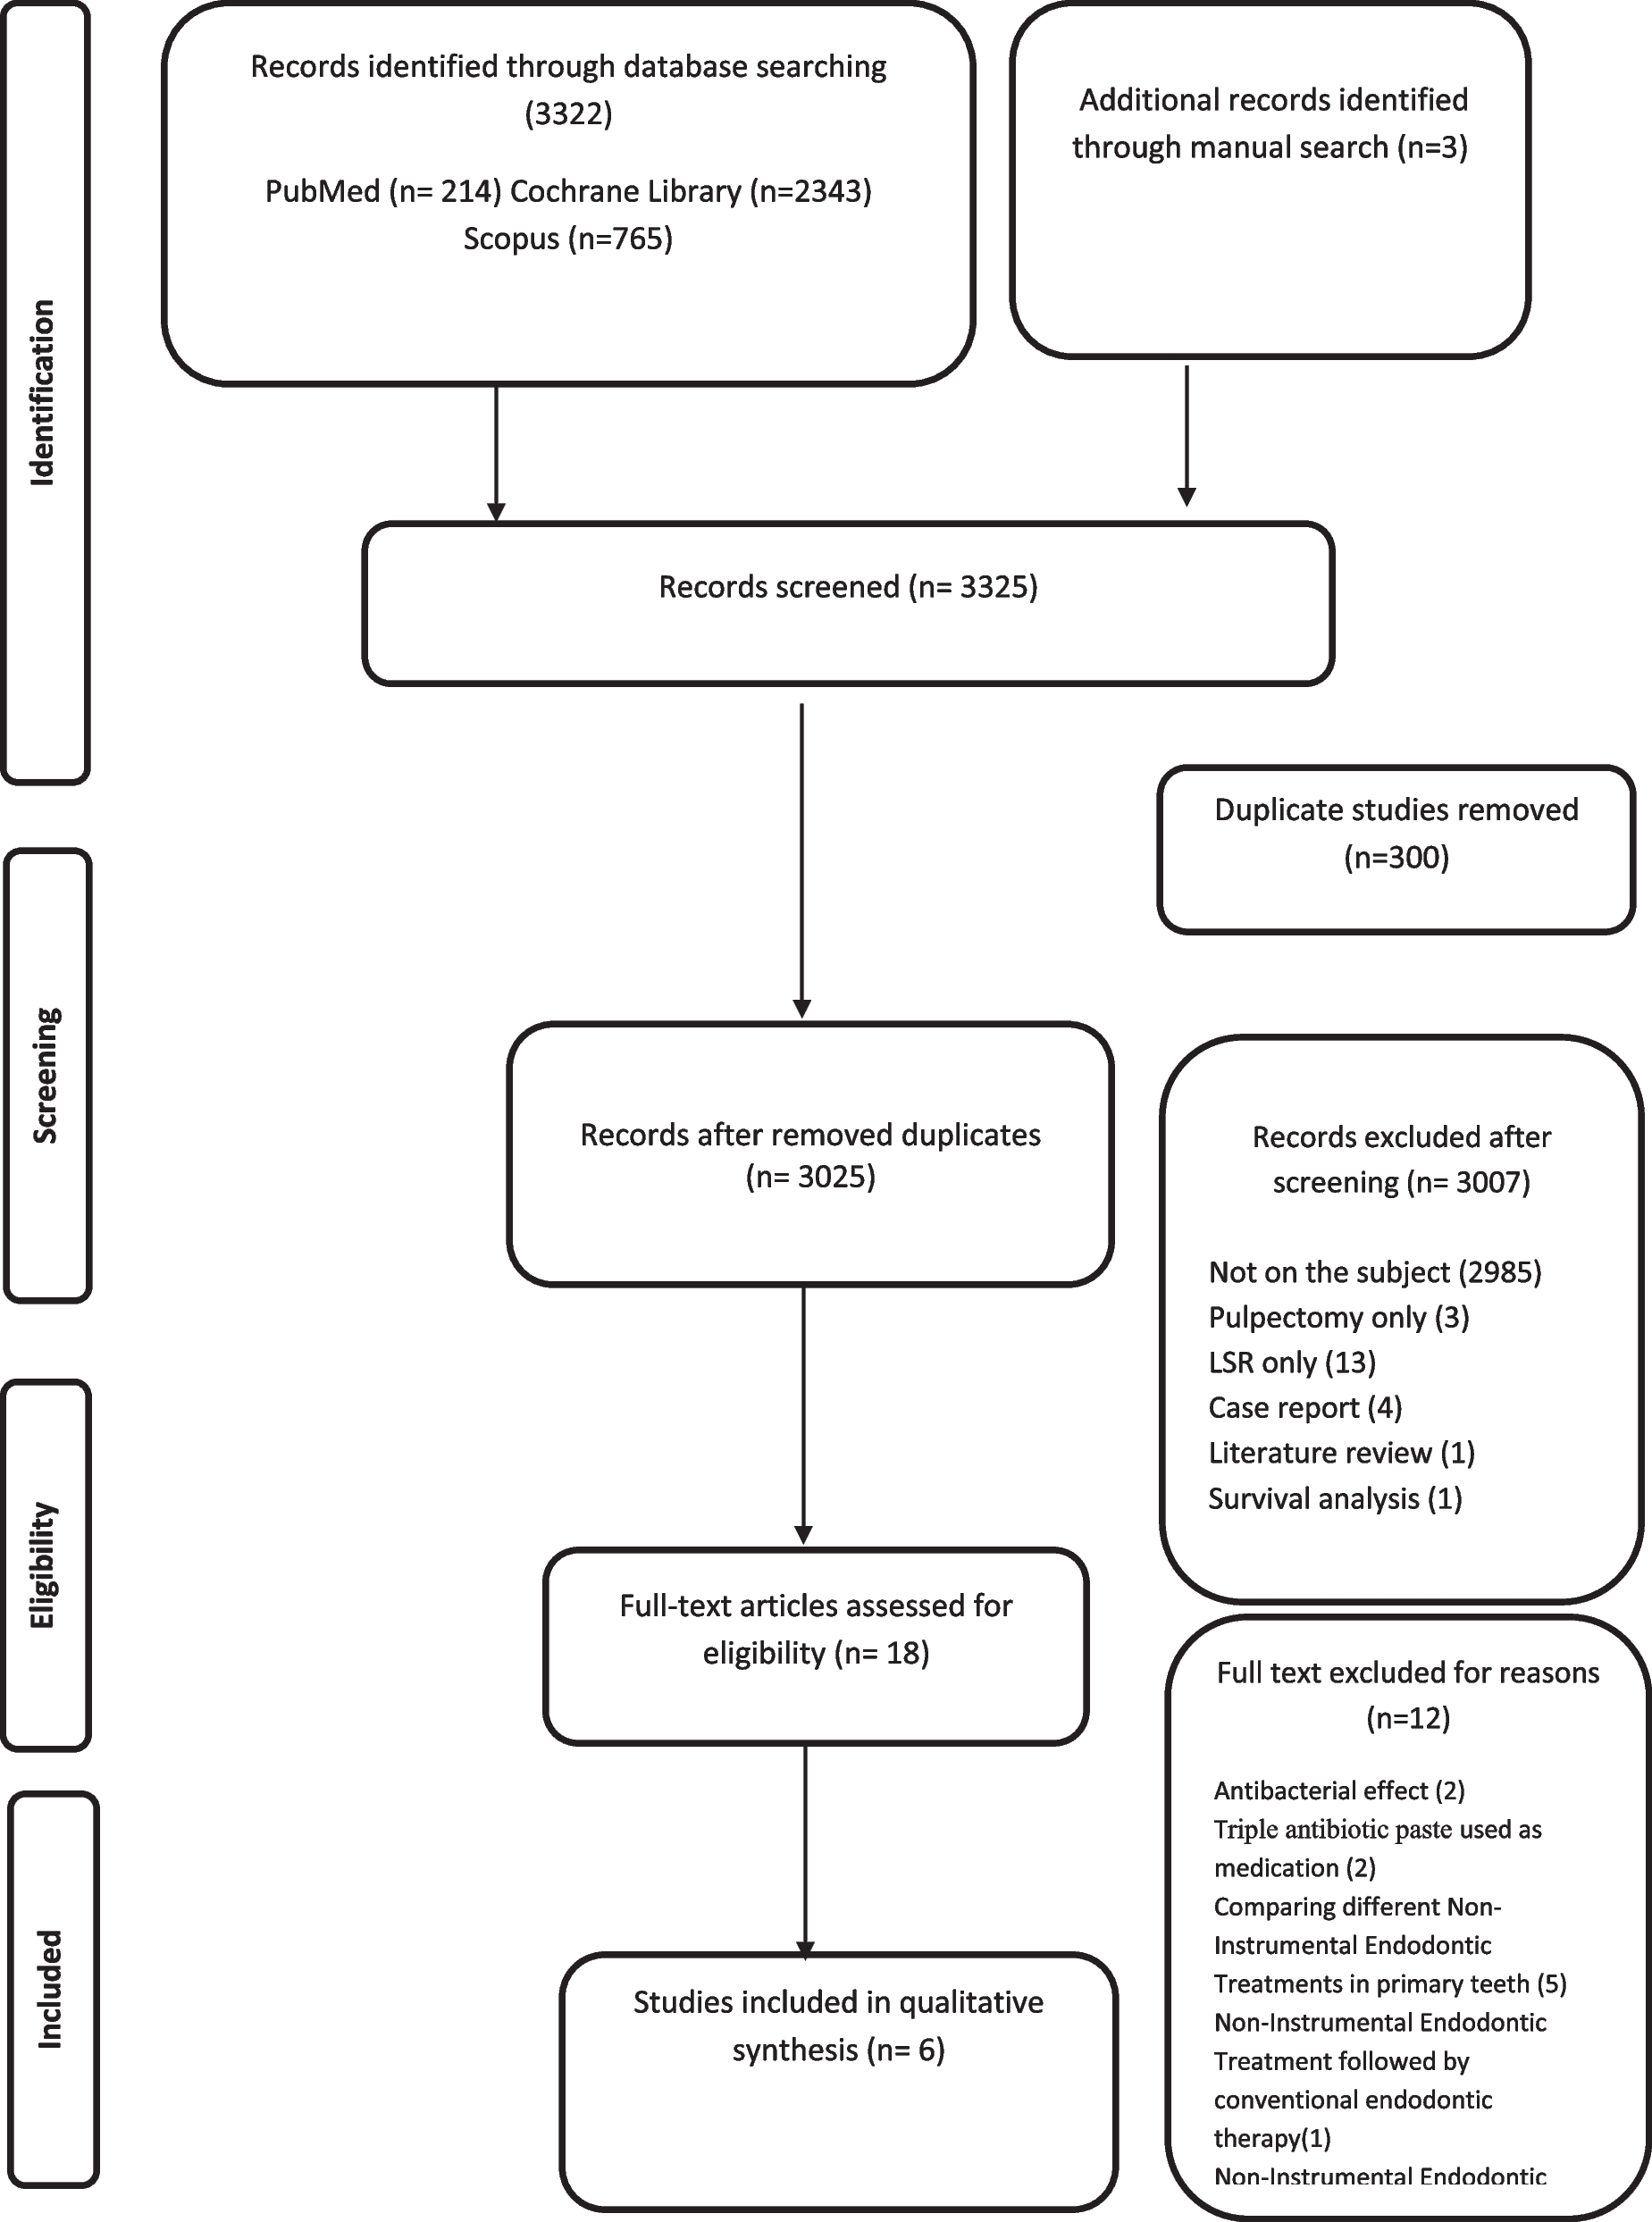

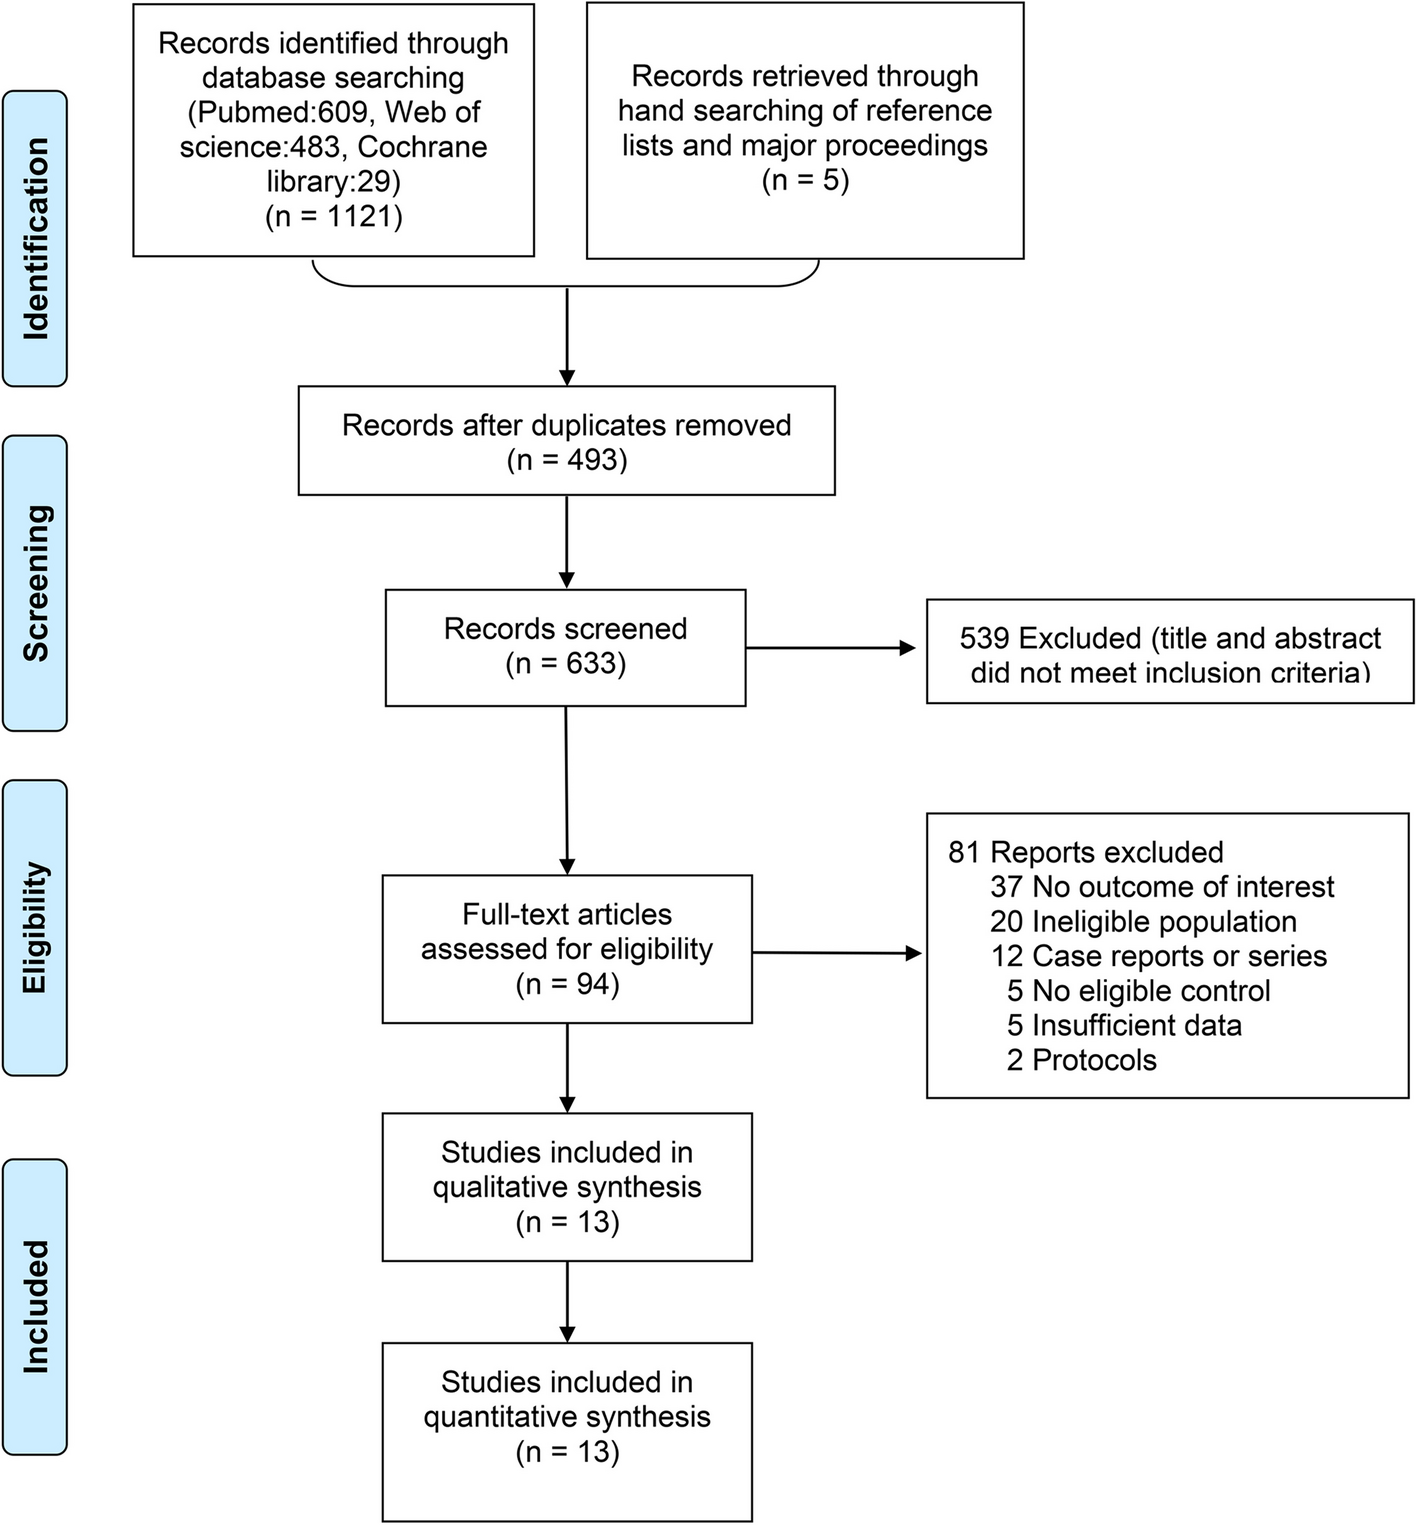


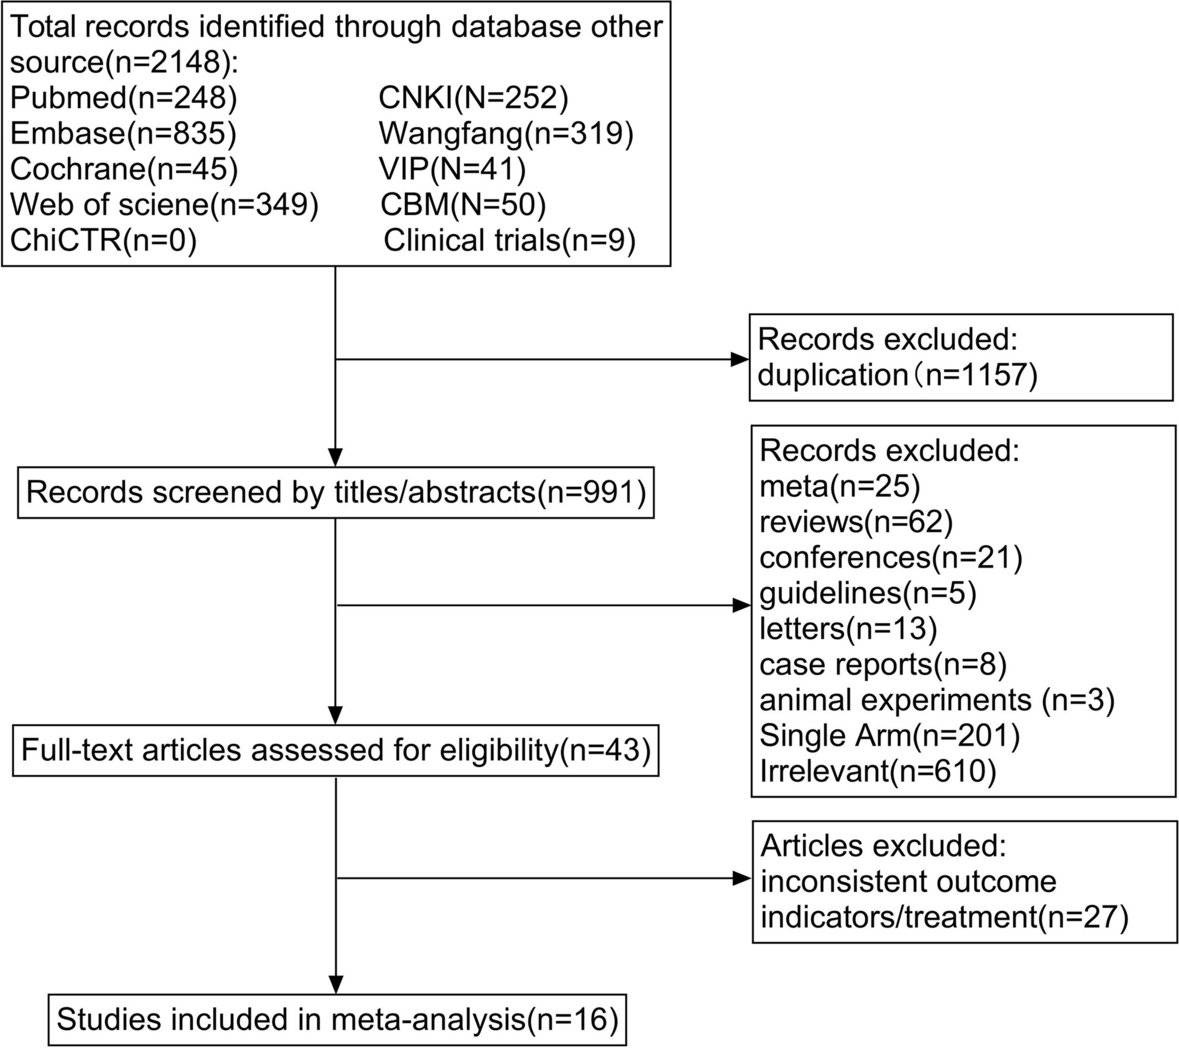
The PRISMA flow chart of the study selection is shown in Fig. 1. Based on the retrieval strategy, 7602 articles were obtained from the database, and five articles were supplemented by tracing references. Duplicates of 2701 articles were removed using Zotero software, and 4819 articles were excluded after screening titles and abstracts. Based on the eligibility criteria, 87 articles were potentially relevant to our systematic review. After the full-text evaluation, 69 articles were excluded (Additional file 2.list of the excluded full-text).
Fig. 1
PRISMA flow chart for study selection
Study characteristicsOverall, 18 RCTs with 1357 patients were included. The included studies were published between 2005 and 2023. The characteristics of the studies are presented in Table 1, and the characteristics of the NIBS specific parameters are presented in Table 2. These studies were conducted in Germany (n = 4); Brazil (n = 2); France (n = 1); China (n = 7); Russia (n = 1); Turkey (n = 1); India (n = 1); and Italy (n = 1). Seven studies used tDCS + medication, and eleven studies used rTMS + medication. The number of NIBS sessions varied, whereas the duration of the therapy ranged from a single application to 8 weeks. The most common treatment period was two weeks. The parameters of the neural stimulation settings varied considerably between studies. The frequencies employed ranged from 5 to 20 Hz. The intensity can be expressed as a Tesla (MT; 80–120%) motor threshold.
Table 1 Characteristics of the included studiesTable 2 Characteristics of NIBS treatmentBias risk of included studiesOf the studies, only eight [15, 16, 21, 29, 32,33,34, 37] provided clear descriptions of the methods employed for randomization and allocation concealment. Eleven studies [15, 16, 29, 30, 33, 34, 37, 39,40,41,42] reported loss of follow-up, with the rate of incomplete data ranging from 3.0% to 35%. The primary reasons for losses to follow-up typically included patient mortality, intolerable pain, and refusal to persist with the intervention. Seven studies [15, 16, 29, 32,33,34, 37] were at low risk of reporting bias, and the study protocol of these studies could be retrieved. A summary of this is shown in Fig. 2.
Fig. 2
Results of bias risk evaluation of included studies
Overall effects of NIBS treatments for depressionDepression scoreAll studies reported pre- and post-intervention depression scores (Fig. 3). Because there was significant heterogeneity among the included articles (I2 = 91.0%, p < 0.01), the results were pooled using a random effects model. The post-intervention reduction in depression levels was greater in the NIBS plus medication group than in the medication alone group [SMD = -1.01, 95%CI (-1.55,-0.48), I2 = 91.0%, p < 0.01]. Subgroup analyses were performed based on the type of intervention (i.e., tDCS + medication or rTMS + medication). The meta-analysis results showed that compared with medication alone, both rTMS combined with antidepressants [SMD = -1.37, 95%CI (-2.24,-0.50), I2 = 94.0%, p < 0.01] and tDCS combined with pharmacotherapy [SMD = -0.55, 95%CI (-0.95,-0.16), I2 = 77%, p = 0.01)] reduced depression scores, with statistically significant differences.
Fig. 3
Forest plot of depression scores
Anxiety scoreTwo RCTs [16, 30] containing six useful datasets reported the effect of interventions on anxiety symptoms (Fig. 4). A fixed-effects model was adopted, considering I2 < 50%. There was no discernible difference in the anxiety symptoms between the intervention and control groups [MD = -1.42, 95% CI (-3.22, 0.39), I2 = 22%, p = 0.12].
Fig. 4
Forest plot of anxiety score
The quantification of the neurotransmitters levelsThe quantification of the neurotransmitter levels of 5-HT, DA, and GABA plays a regulatory role in the cognition and emotion of cells. Three studies [34,35,36] (all used rTMS) reported changes of 5-HT, and two studies [35, 36] reported changes of DA and GABA after intervention (Fig. 5), which showed a significant increase of the levels of 5-HT, DA, and GABA (SMD = 0.85, 95% CI (0.24, 1.64), I2 = 87%, p < 0.01), (SMD = 1.78, 95% CI (1.51, 2.05), I2 = 0%, p < 0.01), and (SMD = 1.47, 95% CI (1.21, 1.72), I2 = 0%, p < 0.01) separately.
Fig. 5
Forest plot of levels of neurotransmitters
Response rates of depressionTwelve studies [15, 16, 21, 30, 31, 33, 35, 37, 39, 40, 42, 43] (seven rTMS and five tDCS) reported response rates (Fig. 6). Heterogeneity between these studies was significant (I2 = 60%, p < 0.01), therefore a random-effect model was used. Subgroup analysis results showed that antidepressants combined with rTMS improved the clinical response rate in patients with depression compared to controls [OR = 3.42, 95%CI (1.61, 7.27), I2 = 53%, p < 0.01]; however, no significant corresponding results were obtained for tDCS [1.97, 95%CI (0.96, 4.03), I2 = 67%, p > 0.05].
Fig. 6
Forest plot of response rate
Remission rate of depressionTen studies [15, 16, 30, 31, 33, 37,38,39, 42, 43] evaluated the response rates (Fig. 7). Significant heterogeneity was observed among the studies (I2 = 54%, p = 0.02). Among the five trials involving rTMS combined with medication therapy, substantial effect sizes were observed [OR = 3.89, 95% CI (2.14, 7.07), I2 = 0%, p < 0.01]. In contrast, the five trials exploring tDCS combined with medication therapy reported nonsignificant effect sizes [OR = 1.31, 95% CI (0.85, 2.02), I2 = 45%, p = 0.22].
Fig. 7
Forest plot of remission rate
Drop-out rateTen RCTs [15, 16, 30, 33, 34, 37, 39,40,41,42] reported dropout rates (Fig. 8). A fix-effect model was adapted because the heterogeneity was not significant (I2 = 0%, p = 0.53). The combined effect size [OR = 0.96, 95%CI (0.63,1.46), I2 = 0%, p = 0.53] indicated that the drop-out rates did not differ.
Fig. 8
Forest plot of droup-out rate
Follow-up timeAs shown in Fig. 9, three RCTs [15, 36, 37] reported depression scores two weeks after intervention [SMD = -0.66, 95%CI (-1.40, 0.09), I2 = 80.0%, p = 0.05], and two RCTs [39, 41] reported depression scores three weeks after intervention [SMD = -1.25, 95%CI (-3.80, 1.30), I2 = 98.0%, p > 0.05]. One RCT [16] reported depression scores at three months and six months after intervention [SMD = -0.07, 95%CI (-0.39, 0.25), p > 0.05] and [SMD = -0.32, 95%CI (-0.01, 0.64), p > 0.05], respectively. These findings indicate that the combination has limited long-term efficacy in alleviating symptoms of depression.
Fig. 9
Forest plot of Follow-up time
Sensitivity analysisGiven the high heterogeneity of the included studies, we conducted sensitivity analyses of all results, and the results did not change after excluding each study (Additional file 4: Sensitivity Analysis). In summary, the outcomes obtained from the included trials were robust.
Publication biasPublication bias was assessed using funnel plots and Egger's test (Additional file 5: Publication bias). Egger’s test of depression scores, remission rate, and dropout rate was not significant (p = 0.13, p = 0.16, and p = 0.24, respectively). However, Egger’s test of the response rate suggested potential publication bias (p < 0.01); five trials were missing after a "trim-and-fill" analysis. The funnel graph would have been more symmetrical if these five trials had been incorporated into the meta-analysis. The filled pooled estimate [OR = 0.81, 95% CI (1.51, 2.59), I2 = 59%, p < 0.01] based on the 18 trials was similar to the initial effect size. Biases in other outcomes were not considered due to the limited number of included studies.
Meta-regression resultsThe meta-regression analysis indicated no significant association between the clinical parameters (such as the type of NIBS, the severity of depression, and the antidepressant class) and demographic factors (including the sample size, age, and percentage of females) with rates of remission or dropout. The details are shown in Additional file 6: Meta-regression analyses. A stepwise regression analysis was conducted to explore the relationship between the HAMD score and several independent variables (Table 3), revealing that the impact of the depression score was influenced by two factors: the use of tricyclic antidepressant medications (TCAs) and the sex of the participants (p = 0.01 and p = 0.03, respectively). Sample size demonstrated an influence on the response rate (p = 0.01). For other outcomes, the limited availability of studies precluded the application of meta-regression models.
Table 3 Meta-regression results
留言 (0)