
記住我


The protocol of this review was prepared following the Preferred Reporting Items for Systematic Reviews and Meta-Analysis Protocols (PRISMA-P) 2015 statement and Cochrane systematic review methodology [50, 51]. The protocol is registered on the International Prospective Register of Systematic Reviews (number CRD42022367111).
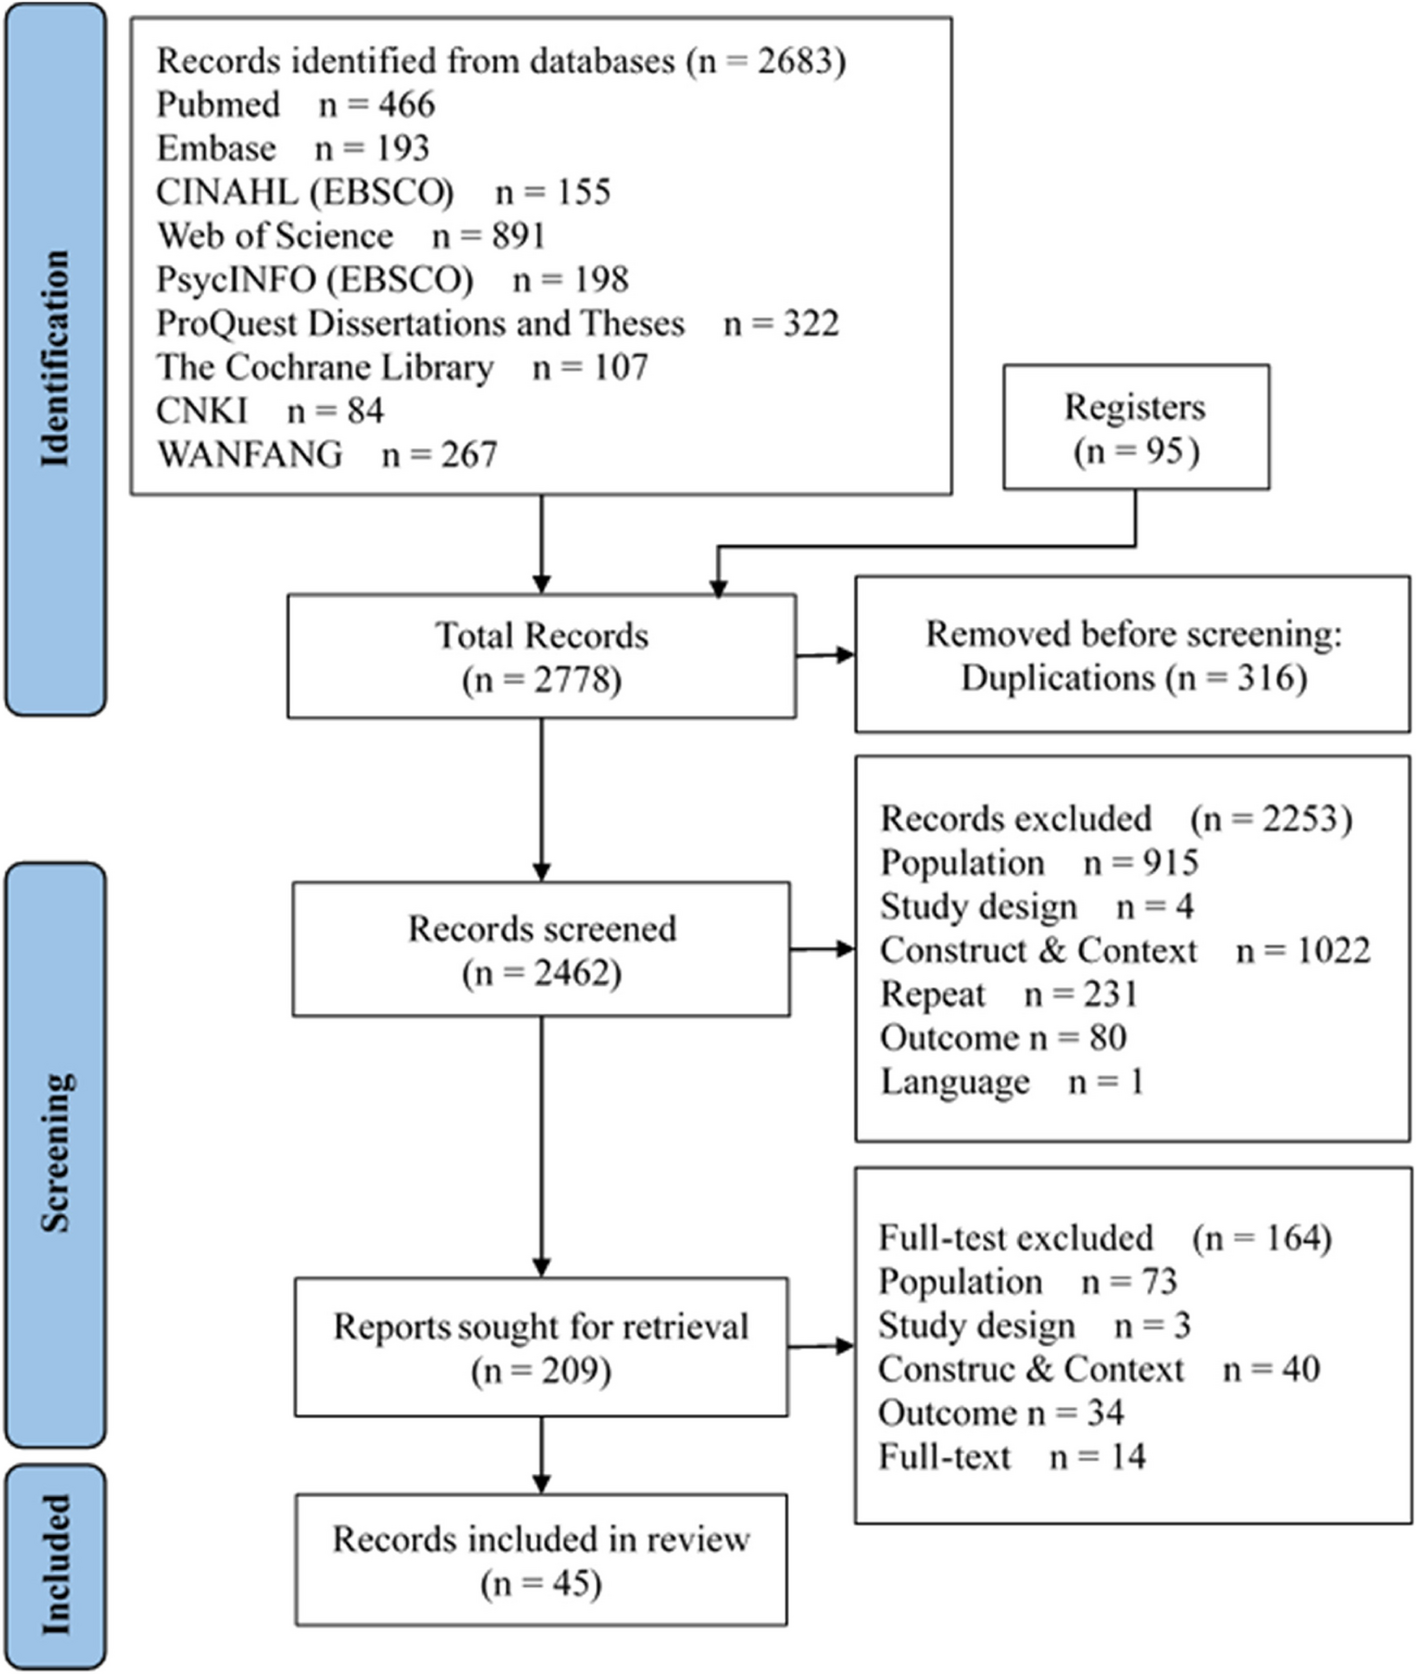
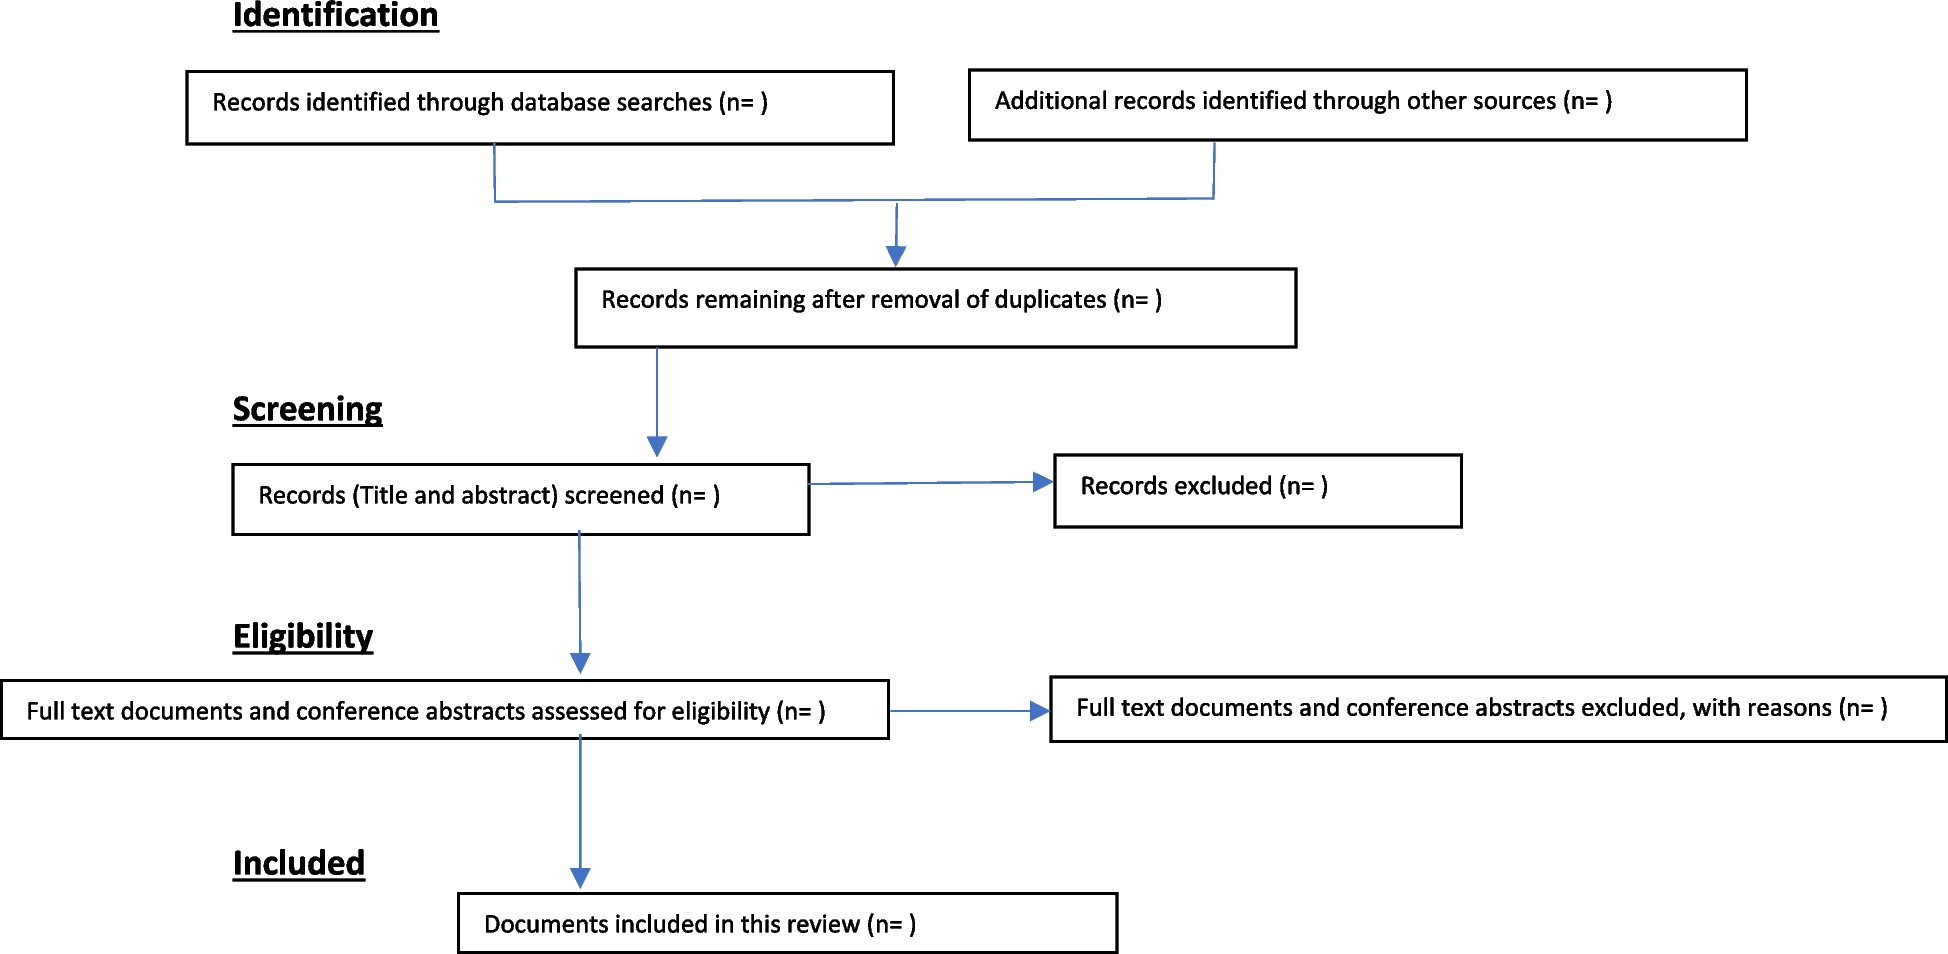
Figure 1 presents the planned flow chart of the systematic review and meta-analysis with a summary of the selection process.
Fig. 1
Flow chart diagram of the search strategy of the systematic review
Eligibility criteriaEligibility criteria follows the PICO framework regarding population, intervention, comparator, outcome, and study type.
PopulationThe study will include participants with a mean age of 60 years or older and a minimum age of 50 years. It will include both healthy older adults and older adults diagnosed with various conditions such as mild cognitive impairment (MCI), Alzheimer’s disease (AD), or Parkinson disease (PD).
InterventionAny randomized controlled trial (RCT) focusing on the effects of any type of exercise will be screened for inclusion, including aerobic, resistance training, coordination training, and other exercise programs such as tai chi, qigong, dancing, and exergaming. Several main exercise characteristics (type, session duration, session intensity, session frequency, intervention duration) will be assessed.
ComparatorsComparators will include light exercise, stretching, meditation, relaxation, and/or passive control groups (waiting list, treatment as usual, and habitual activities).
OutcomesCognitive outcomes will include objectively assessed cognitive domains of EFs (inhibition, working memory, cognitive flexibility, and high-level EFs) and episodic memory. These cognitive domains should have been assessed at baseline and at the end of the intervention through well-validated cognitive tasks and psychological tests. Regarding EFs, the outcomes for assessing inhibitory control may include the Stroop task, Eriksen-Flanker test, Simon task, global–local task, go-no go task, random number generation task, saccade-antisaccade task, and stop-signal task (STT). To assess working memory, the tasks and tests may include the Corsi block-tapping test, reading span task (RST), operation span task (OSpan), backward verbal digit span task, visuospatial N-back task, or tone monitoring task. To assess cognitive flexibility, the instruments may include the Trial Making Test (TMT), the Alternative Uses Task (AUT), Brixton Spatial Anticipation Test (BSAT), Delis-Kaplan Executive Function System (D-KEFS, subtests: the Trail Making Test, the Color-Word Test, the Tower Test, the design fluency test, The Sorting Test), Remote Associates Test (RAT), Implicit Relational Assessment Procedure (IRAP), attentional set-shifting task (AST), or Wisconsin Card Sorting Test (WCST). Among the instruments to assess high-level executive functions are the Raven’s Colored Progressive Matrices (RCPM) and Tower of Hanoi (TOH). In the case of episodic memory, the assessment tools may include the Rey Auditory Verbal Learning Test (RAVLT), SEMantic Episodic Memory Test (SEMEP), Wechsler Memory Scale (WMS; only the subtests that assess episodic memory), Hopkins Verbal Learning Test (HVLR-R), language-based paradigms, or the 360° video for episodic memory assessment. All the indexes of performance used for each of these tasks will be carefully selected to be sure that they reflect the targeted cognitive function (e.g., interference score in the case of the Stroop task, the Ericksen task, and the Simon task).
Inclusion and exclusion criteriaThe inclusion criteria will be age (mean ≥ 60 with a minimum of 50 years), the practice of any type of physical exercise for at least 3 months, and provide outcomes including any EFs or episodic memory measure assessed at baseline (before physical training) and after training (post-training). If there were enough follow-up studies (e.g., 3 months, 6 months after training), they will be analyzed. Characteristics of exercise intervention such as frequency, intensity, type, and/or time of exercise (FITT) of the intervention program will have to be informed. Studies will be excluded if they do not meet the PICO conditions mentioned above, if they are not RCTs, if they do not have at least an active or passive control group, or if the written language is not English.
Research questionsThe present study is directed to answer six main research questions described below.
i.To what extent does exercise enhance EFs and episodic memory in old age (the global effect)?
ii.Do different types of chronic exercise (aerobic, resistance training, coordination training, and other exercise programs, such as Tai Chi or Qigong, dancing, or exergaming) have a different impact on EFs and episodic memory in older adults?
iii.Is the type of control group (active vs. passive) a moderator of the changes in the investigated cognitive domains?
iv.Is the effect of exercise different in healthy older adults and clinical older adults suffering neuropsychological disorders (MCI, PD, AD)?
v.Is age a moderator of the effect of exercise on the investigated components of cognition?
vi.Are duration and intensity of exercise moderators of the effect of regular exercise on cognitive aging?
Literature search strategyAn initial search will be conducted at MEDLINE, Embase, PsychINFO, Google Scholar, EBSCO, SportDiscuss, CINAHL, Science Direct Dissertations, Web of Science, and Cochrane Central Registered of Controlled Trials (CENTRAL). These databases were selected because they are the most important and widely used to assure that relevant articles were not missed and in consultation with experienced researchers and librarians. Table 1 shows the detailed search strategy for PsychINFO. In addition, systematic reviews and meta-analyses published on episodic memory and the different EFs processes will be screened to check if the articles included in these publications should be considered in the present review.
Table 1 Search strategy for PsychINFOInclusion will be restricted to articles written in English published in peer-reviewed journals and doctoral theses. Studies published in other language will not be included. English is the most widely used scientific language to publish intervention studies and the language used in most systematic reviews and meta-analytic studies. Articles published from the inception will be considered for inclusion. An additional final search in the different databases will be conducted at the end of the review process to include more recently published studies.
After carefully reading all the retrieved articles, the data will be extracted for conducting the meta-analyses.
Data extractionOnce the databases are searched, the retrieved articles will be exported in a Research Information Systems (RIS) format and imported into Rayyan [52], a web application created for article screening. The first step in Rayyan will consist of removing all the duplicates. Then, pairs of reviewers will work independently and blinded on screening articles based on title and abstract. Possible conflicts between the two independent reviewers will be solved by a third reviewer (J. M. R.). After completing the first selection stage by title and abstract, the next step will be retrieving the full articles corresponding to the included articles for careful reading. The idea is to extract in an Excel spreadsheet all the relevant information. The extracted data will include the following: (i) Characteristics: information regarding author(s), journal, publication year, and country; (ii) population: number of participants in each group, participants’ characteristics including mean age, sex, and clinical condition; (iii) interventions: including type of physical activity, intensity, session duration, total duration of the intervention, and adherence; and (iv) outcomes: in terms of tasks and psychological instruments used to assess memory and EFs, including sample size, means, and standard deviations at baseline and post-intervention and other possible time points corresponding (follow-up assessments) to the different (intervention and control) groups.
If a study will be relevant for our analysis but the data necessary to calculate the effect sizes will be missing or just the graphs were available, we will contact the corresponding author by email to ask for the relevant data. If the author does not respond, the missing data will be extracted from the graphs provided in the article using the online tool WebPlotDigitizer version 4.3.
In the case of RCTs with several time points, we will focus on the post-intervention at the end of the physical exercise training. If more time points or follow-up assessments were provided and enough articles contained assessments at 3 or 6 months after the end of the intervention program, the effects will also be considered. We will calculate Hedges’s g as the effect size.
Risk of biasThe risk of bias (RoB) of each included study will be evaluated using the Cochrane ROB 2 tool [50, 53, 54]. Biases are assessed across five areas including randomization, deviations from intended interventions, missing outcome data, outcome measurement, and selection of the reported results. The risk of bias of each study will be assessed based on a series of questions provided for each of the five areas and the possible answers in the following five categories: “yes,” “probably yes,” “no,” “probably no,” and “no information.” Finally, the risk of bias in each area will be assessed as “low risk of bias,” “some concerns,” or “high risk of bias.” Teams of two reviewers will independently assess the risk of bias in the included studies. A third independent reviewer will resolve possible disagreements.
Statistical analysisEffect sizes (ES) will be modelled using a three-level structure because it is a better approach than a two-level structure when there are several dependent effect sizes in each independent study but only if the heterogeneity of the sampling variance is substantial. In three-level meta-analytic models, three different sources of variance are modelled. The third level represents the variance of effect sizes between studies; the second level describes the variance of effect sizes of the experiments, or measurements nested within each study; and the first level describes the sample variance. In the present study, we will perform a multilevel random-effects analysis using restricted maximum likelihood estimation. This analytical solution was designed to account for the nonindependence among effect sizes. This is the preferred methodology when the sampling variability is not too high. Heterogeneity among effect sizes (I2) will be assessed using the omnibus homogeneity test (Q), 0–40% indicates negligible heterogeneity, 30–60% indicates moderate heterogeneity, and 50–90% suggests substantial heterogeneity. A large Q-value means that differences between effect sizes do not derive from a common population mean from the study samples but are accounted for by other reasons.
The statistical analysis will be performed using rma.mv function of the metaphor package (version 2.4) [55] within the R software environment (version 4.0.1; R Core Team, 2021) [56]. The analytical steps provided by Assink and Wibbelink [57] will be followed. Dot-plot figures will be depicted using Mathematica (version 10.4) with software developed specifically for the present study.
To avoid outliers or influential cases that could distort the results of the meta-analysis, outlier and influential case diagnostics will be performed using the influence function of the metaphor package. The influence function calculates the influence of deleting one case at a time on the model fit or the fitted/residual values. Statistical heterogeneity will be assessed using the I2 test.
After a systematic publication search, it might occur that some studies were missed due to publication bias. That is, intervention studies that did not obtain significant results are not published, either because the authors did not submit them to a journal for publication or because the editor rejected them. We will address this important issue using two complementary statistics. The first explores the relationship between the precision and the observed effect size of the studies (the funnel plot and the statistical test of its asymmetry known as Egger’s regression test) under the assumption that effect sizes drive publication bias. In a funnel plot, the effect sizes are plotted against the standard error. An asymmetric funnel plot would suggest that publication bias exists, for example, an underrepresentation of nonsignificant results and/or negative effects on the bottom left side of the funnel plot. To evaluate the statistical significance of the funnel plots, we will apply the Egger’s test [58]. This test analyzes in a linear regression whether the standardized effect sizes can predict study precision, defined as the inverse of the standard error. The main goal of this analysis is to find a significant regression intercept that differs significantly from zero which would indicate a significant funnel plot asymmetry. We will also use the trim-and-fill method [59, 60] to determine the number of effect sizes that would need to be imputed to restore the symmetry of the funnel plot.
The second statistics we are going to use to assess publication bias is the P-curve technique, which assumes that publication bias is driven primarily through p-values, not by effect sizes. This relatively new methodology is based on the shape of the histogram of p-values, which depends on the sample sizes of studies and the actual effect size of the data. The method determines if the data estimates an actual, non-spurious effect size.
Once we had all the required information regarding the types of interventions, comparators, outcomes, and the healthy or clinical conditions of the participants of the finally included studies, we would be able to provide information regarding search results, descriptive results corresponding to studies and participants’ characteristics, overall effect size, and moderator analyses.
留言 (0)