
記住我
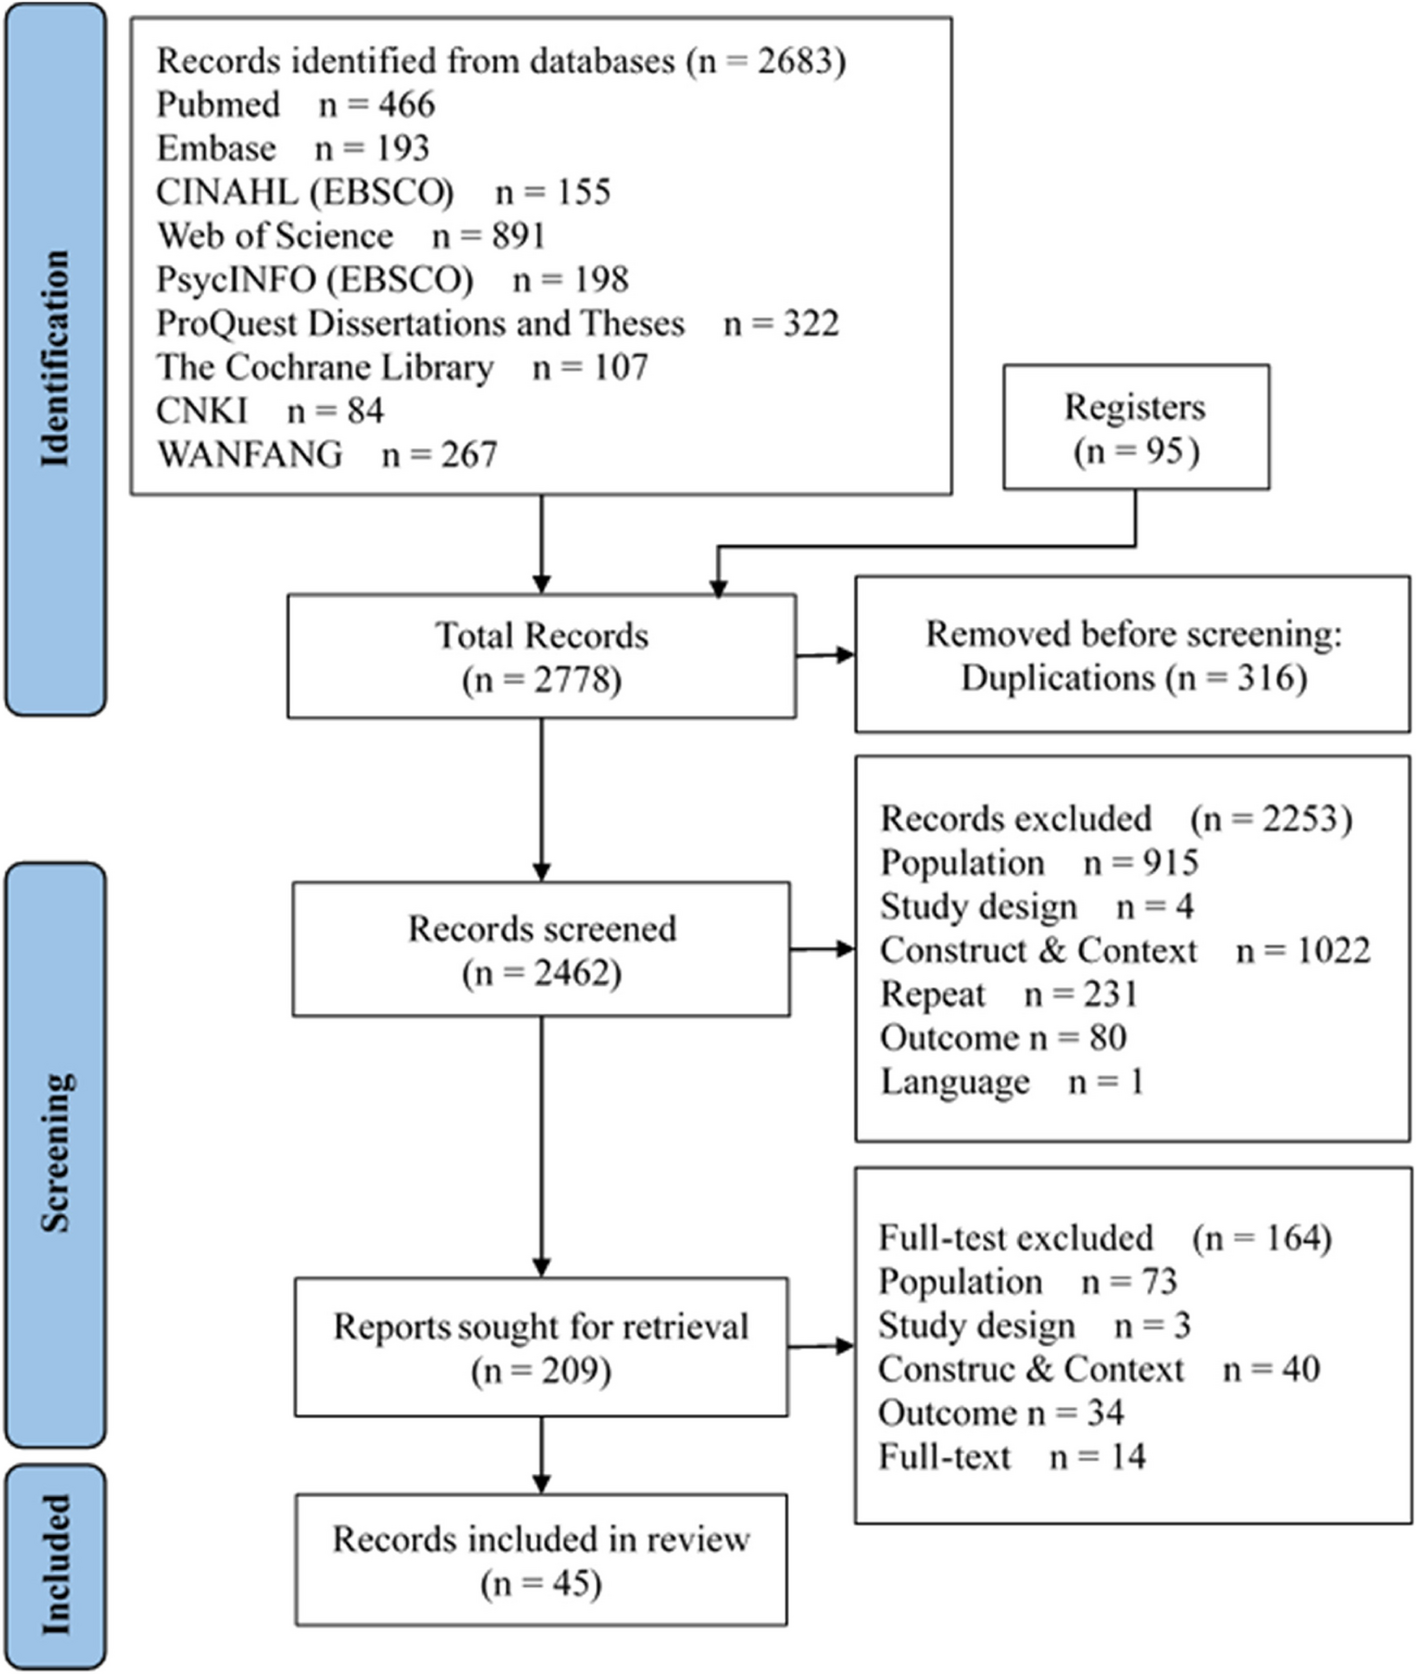


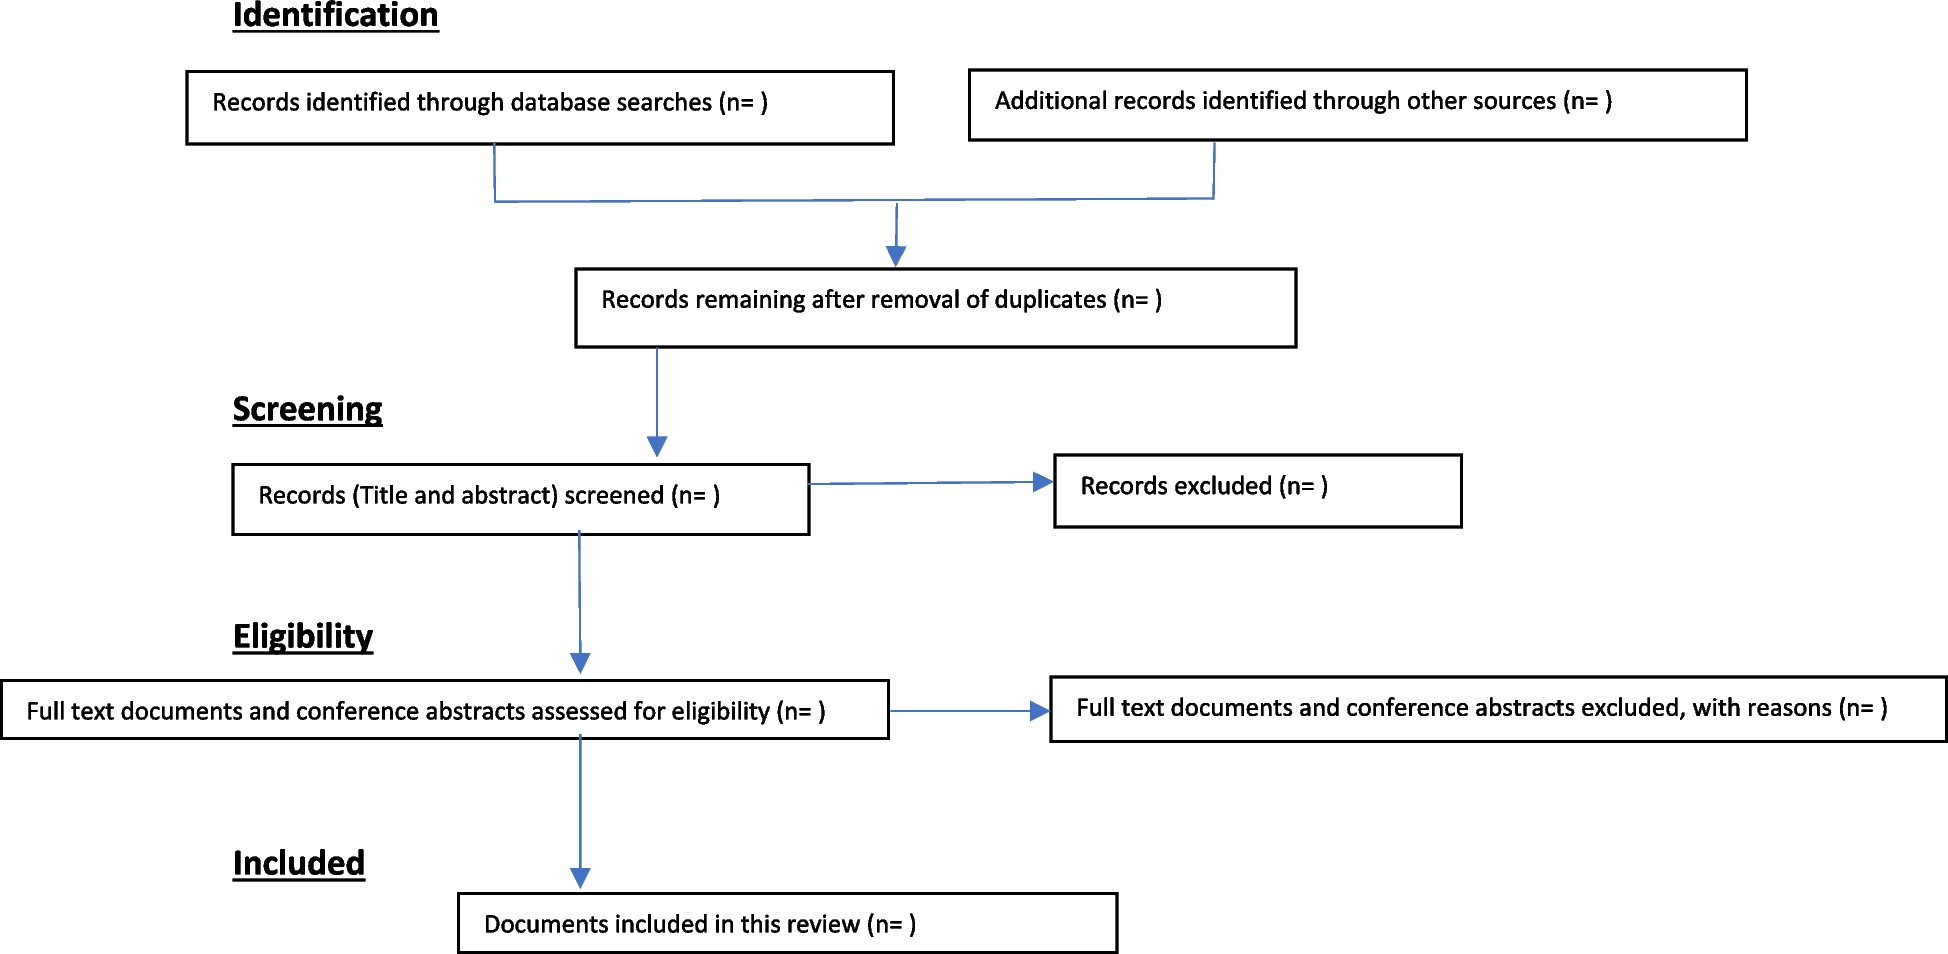


A total of 8963 records were identified using different databases including MEDLINE, PubMed, ScienceDirect, Scopus and Cochrane Library. In total, 2284 records were excluded because of duplication, the removal was conducted through both manual removal and using an automation tool known as Rayyan. Then 6564 records were excluded after the initial title and abstract screening due to unmet inclusion criteria. Of the remaining 115 records, the full-text articles were carefully read, and 14 records were excluded due to insufficient pCR data and inaccessibility. Finally, 101 studies fulfilled the eligibility criteria and were included in the systematic review and meta-analysis (Fig. 1).
Overview of included studiesAltogether, 19,708 Asian breast cancer patients were gathered from the 101 studies, with an average of 195 patients per study (Supplementary Table 4.1 in Additional file 4). The study population comprised 91 studies from Eastern Asia (China [8, 12, 34,35,36,37,38,39,40,41,42,43,44,45,46,47,48,49,50,51,52,53,54,55,56,57,58,59,60,61,62,63,64,65,66,67,68,69,70,71,72,73,74,75,76,77,78,79,80,81,82,83,84,85,86,87,88,89,90,91,92,93,94,95,96,97,98,99,100,101,102,103,104,105,106,107,108,109,110,111,112,113,114,115], Hong Kong [116, 117], Korea [118], and Japan [119,120,121,122]), 7 studies from Western Asia (Egypt [123], Iran [124], Turkey [125, 126], and Saudi Arabia [127,128,129]), 2 studies from Southeast Asia (Indonesia [130], Singapore and Malaysia [131]), and 1 study from South Asia (India [132]). The recruitment period for the patients enrolled in the studies ranged from 1991 to 2020. Most of the study cohorts followed hospital-based study design (76.2%) and clinical trials (14.9%), while 8.9% were not reported. 61.3% of the hospital-based study designs were conducted in unicenter, while 14.9% were in multicenter. Of the 101 studies, only 65 studies provided molecular subtype data (n=11361) - TNBC (29.2%), HER2E (20.7%), luminal B (13.2%), and luminal A (7.2%), while 1.6% were missing. Several studies did not categorise their luminal subtype into luminal A or B. Hence, they were reported as luminal-like (24.9%) in this study. Only 69 studies provided data on biomarkers, comprising the routinely analysed biomarkers—ER (25.1%), PR (25.1%), HR (5.7%), HER2 (27.4%), and Ki-67 (15.5%)—and several non-conventional biomarkers investigated specifically for the study including EGFR (11.0%), CK5/6 (8.0%), Tau (11.7%), Androgen Receptor (AR) (8.6%), PDL1 (3.6%), P-glycoprotein (P-gp) (3.3%), DNA topoisomerase II-alpha (TopoIIa) (3.2%), p53 (9.8%), and others (0.8–4.0%) (Supplementary Table 3.1 in Additional file 3). Meanwhile, 7 studies provided information on genetic variations and differential expression, where the common genetic variations reported were from TP53 (15.7%), PIK3CA (24.6%), MYC (5.8%), ERRB2 (5.8%), CCDN1 (5.8%), BRCA1 (15.7%), BRCA2 (15.7%), and others (10.9%).
All the patients in the studies received NAC, and 25.0% of patients received follow-up adjuvant therapy. Collectively, NAC taxane-anthracycline (TA), taxane-platinum (TP), and taxane-anthracycline-platinum (TAP) combination were mentioned in 41.5%, 18.6%, and 1.5% of the studies, respectively. Meanwhile, 18.3% were treated with NAC anthracycline-based chemotherapy, 14.0% were treated with NAC taxane-based chemotherapy, and 8 studies did not provide specific treatment information. Some patients were treated concomitantly with targeted therapy and endotherapy (23.0%). The definition of pCR used in the included studies was mostly not reported according to any guideline (71.3%), with only 28.7% reported pCR following the Miller-Payne grading (17.8%), Kuerer et al. (1.9%), RECIST (2.9%), and other grading systems (6.1%) including the Ribero classification, Japanese Breast Cancer Society v2007, USFDA guideline, WHO criteria, and pathological TNM system.
Furthermore, 33 of the included studies conducted the multivariate analysis. Most of the included variables used to adjust the multivariate analysis were the commonly reported biomarkers (ER, PR, HER2, and Ki-67), age, tumour size and grade, age at diagnosis, lymph node stage, histological grade, body mass index (BMI), chemotherapy regimens, chemotherapy cycles, and other biomarkers and genetic variations unique to the study.
Quality of the included studiesThe quality assessment of the studies was presented in Supplementary Tables 6.1 and 6.2 (Additional file 6). Fourteen (14) case-control studies and 87 cohort studies were included in our systematic review. NOS scores for the 87 cohort studies ranged from 5 to 9 stars, and NOS scores for the 14 case-control studies ranged from 4 to 9 stars. No study was excluded since all studies scored ≥4 stars.
A summary of the risk of bias assessed on each question using the NOS for cohort and case-control studies is shown in Supplementary Figures 6.1 and 6.2 (Additional file 6). We considered both breast cancer treatment and characterisation as the most important factors for adjustment in the comparability domain because our study eligibility criteria required adjustment for the involvement of somatic genetic polymorphisms or biomarkers or molecular subtypes in breast cancer treatment response. Following this consideration, only 33% (n=29/87) cohort studies earned a star for comparability regarding pCR and breast cancer treatment, while 94% (n=82/87) cohort studies earned a star regarding pCR and breast cancer characterisation. As for case-control studies, 79% (n=11/14) studies earned a star for comparability regarding pCR and breast cancer treatment, while 93% (n=13/14) studies earned a star regarding pCR and breast cancer characterisation. Notably, when both adjustment factors were combined, only 31% (n=27/87) cohort studies and 71% (n=10/14) case-control studies earned both stars in the comparability domain. Amongst the cohort studies, evaluation of the selection of the non-exposed cohort was the question with the lowest count of stars, with only 32% (n=28/87) of the studies having a low risk of bias. Meanwhile, amongst the case-control studies, apart from the first adjustment in the comparability domain, the lowest count of stars was for the question evaluating the selection of controls, with 79% (n=11/14) of studies showing a low risk of bias.
Association of breast cancer characterisation and treatment responseThe molecular subtypes classification of breast cancer, presence or absence of specific biomarkers, and genetic variations in the breast cancer diagnosis can be utilised to predict the pCR outcome in patients treated with specific chemotherapeutic agents. Five molecular subtypes, fourteen biomarkers, and eleven genetic variations were qualitatively evaluated for their predictive value in Asian breast cancer patients (Supplementary Table 4.2.2 in Additional file 4). Meanwhile, of the 101 studies, 60 studies provided data that could be used for meta-analysis (Figs. 2, 3, 4, 5, 6 and 7 in the manuscript and Supplementary Figures 7.1– 7.8 in Additional file 7). All the qualitative and meta-analyses results are presented by the molecular classification, biomarkers, and genetic characterisation of Asian breast cancer patients. Additionally, meta-analysis results using the Mantel-Haenszel method listed under each breast cancer characteristic are grouped according to the chemotherapeutic agents. Meta-analysis results using the inverse-variance method are presented separately since it is pooling the reported association data, for which they are presented by the breast cancer characteristics as well.
Fig. 2
Pooled pCR outcome of TA-treated Asian breast cancer patients according to molecular subtypes. Forest plots describing the random effect ORs and 95% CIs from studies assessing the association of pCR outcome in NAC TA-treated breast cancer patients between (A) HER2E and luminal-like; (B) HER2E and luminal A; (C) HER2E and luminal B; (D) HER2E and luminal, combined; and (E) TNBC and luminal-like; (F) TNBC and luminal A; (G) TNBC and luminal B; and (H) TNBC and luminal, combined. I2 and p-value for X2 of heterogeneity are reported for each group analysis
Fig. 3
Pooled pCR outcome of TP-treated Asian breast cancer patients according to molecular subtypes. Forest plots describing the random effect ORs and 95% CIs from studies assessing the association of pCR outcome in NAC TP-treated Asian breast cancer patients between (A) HER2E and luminal-like; (B) HER2E and luminal A; (C) HER2E and luminal B; (D) HER2E and luminal, combined; (E) Luminal B and luminal A; (F) TNBC and luminal A; (G) TNBC and luminal B. I2 and p-value for X2 of heterogeneity are reported for each group analysis
Fig. 4
Pooled pCR outcome of NAC-treated Asian breast cancer patients according to molecular subtypes and biomarkers. Forest plots describing the random effect ORs and 95% CIs from studies assessing the association of pCR outcome in (A) NAC TP-treated Asian breast cancer patients between TNBC and luminal, combined; (B) between Asian TNBC patients treated with NAC TP and TA; Asian breast cancer patients treated with anthracycline-based chemotherapy with (C) ER; (D) PR; and (E) HER2 biomarkers; (F) Asian breast cancer patients treated with taxane-based chemotherapy and HR biomarker; (G) Asian breast cancer patients treated with TA and ER biomarker. I2 and p-value for X2 of heterogeneity are reported for each group analysis
Fig. 5
Pooled pCR outcome of TA-treated Asian breast cancer patients according to biomarkers. Forest plots describing the random effect ORs and 95% CIs from studies assessing the association of pCR outcome in NAC TA-treated breast cancer patients in biomarkers (A) PR; (B) HR; (C) HER2; (D) nm23-H1; and (E) CK5/6. I2 and p-value for X2 of heterogeneity are reported for each group analysis
Fig. 6
Pooled pCR outcome of NAC-treated Asian breast cancer patients according to biomarkers. Forest plots describing the random effect ORs and 95% CIs from studies assessing the association of pCR outcome in (A) NAC TA-treated breast cancer patients in biomarkers Ki-67; NAC TP-treated breast cancer patients in biomarkers (B) ER; (C) PR; (D) HR; and (E) Ki-67. I2 and p-value for X2 of heterogeneity are reported for each group analysis
Fig. 7
Pooled pCR outcome of NAC-treated Asian patients according to biomarkers and gene
留言 (0)