
記住我
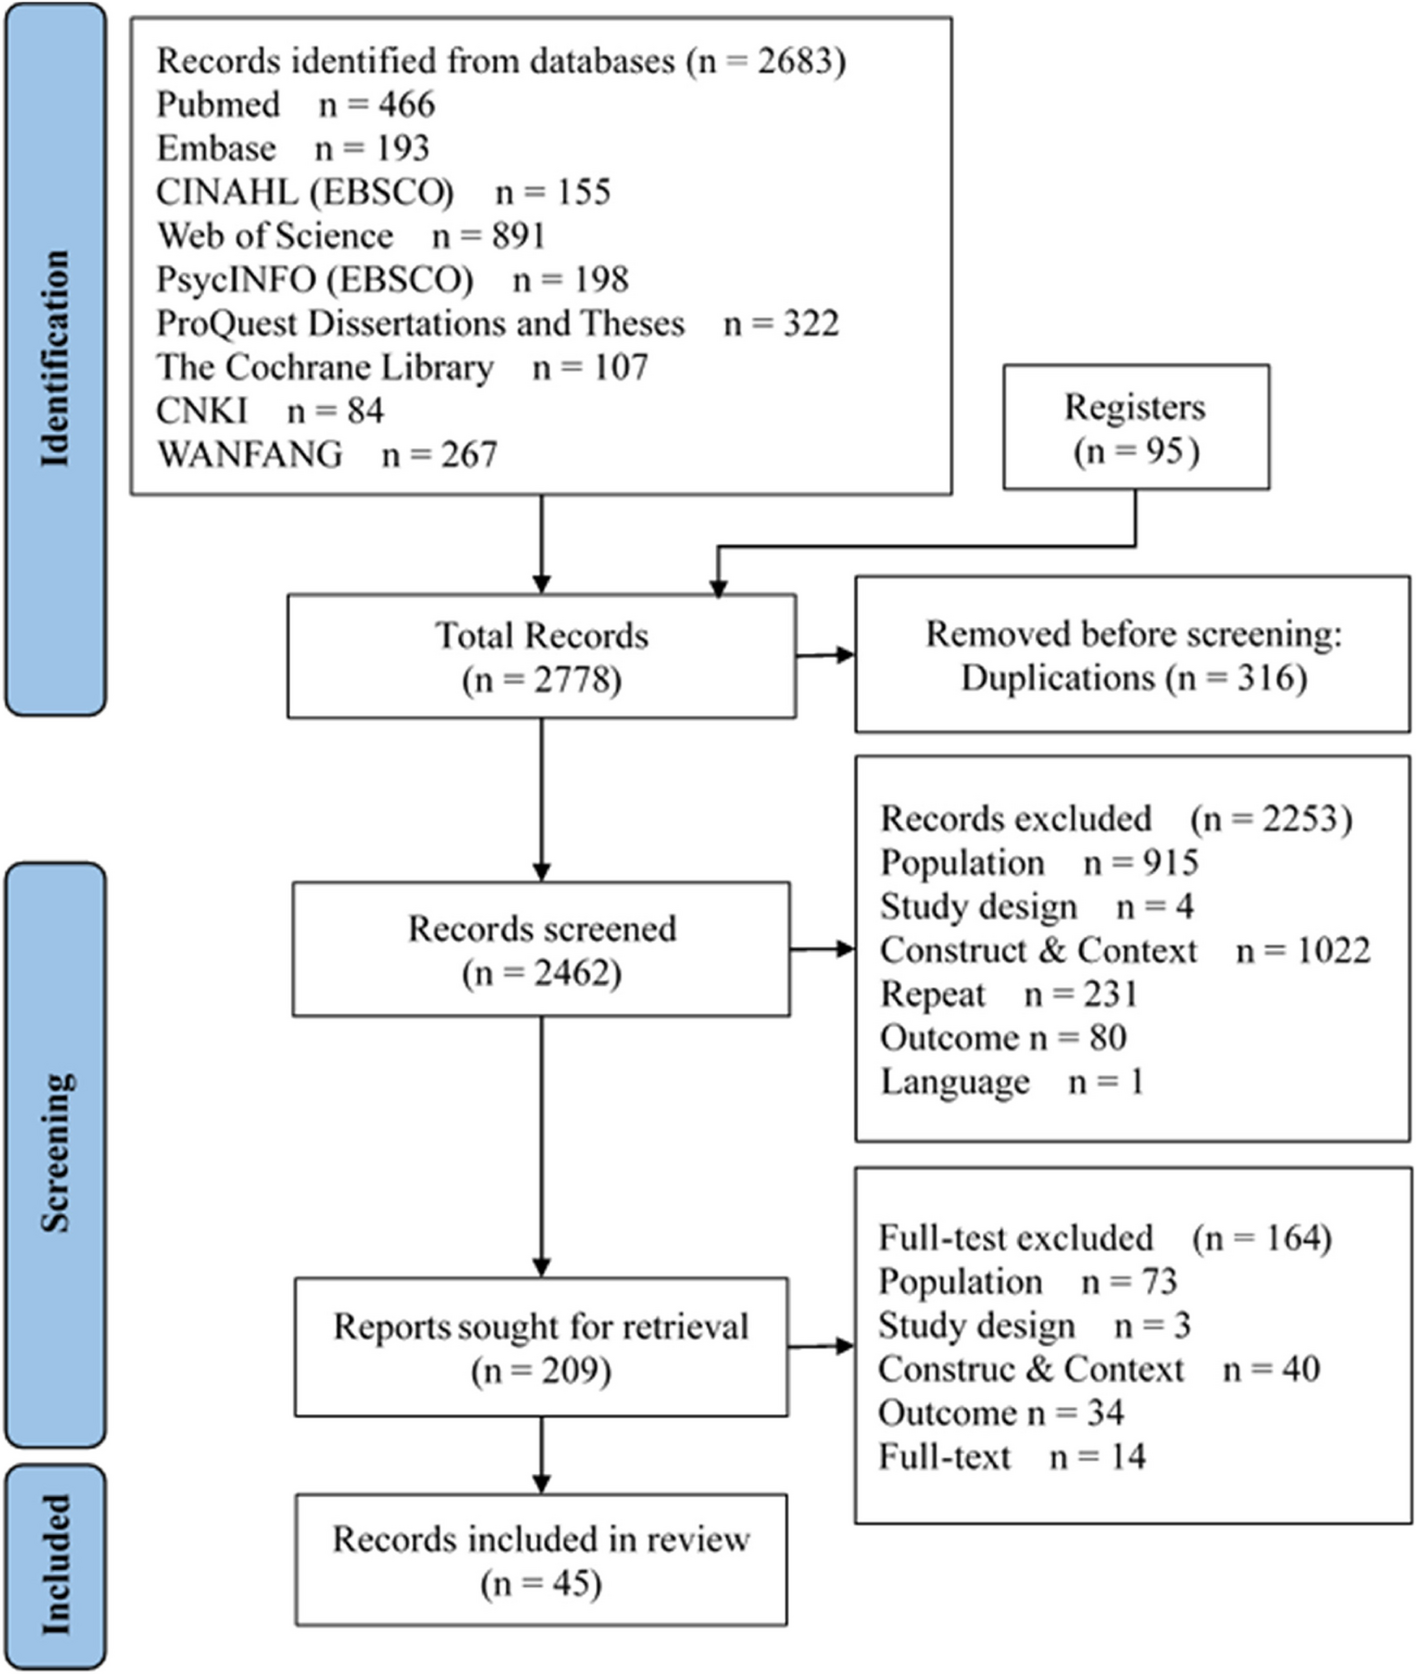


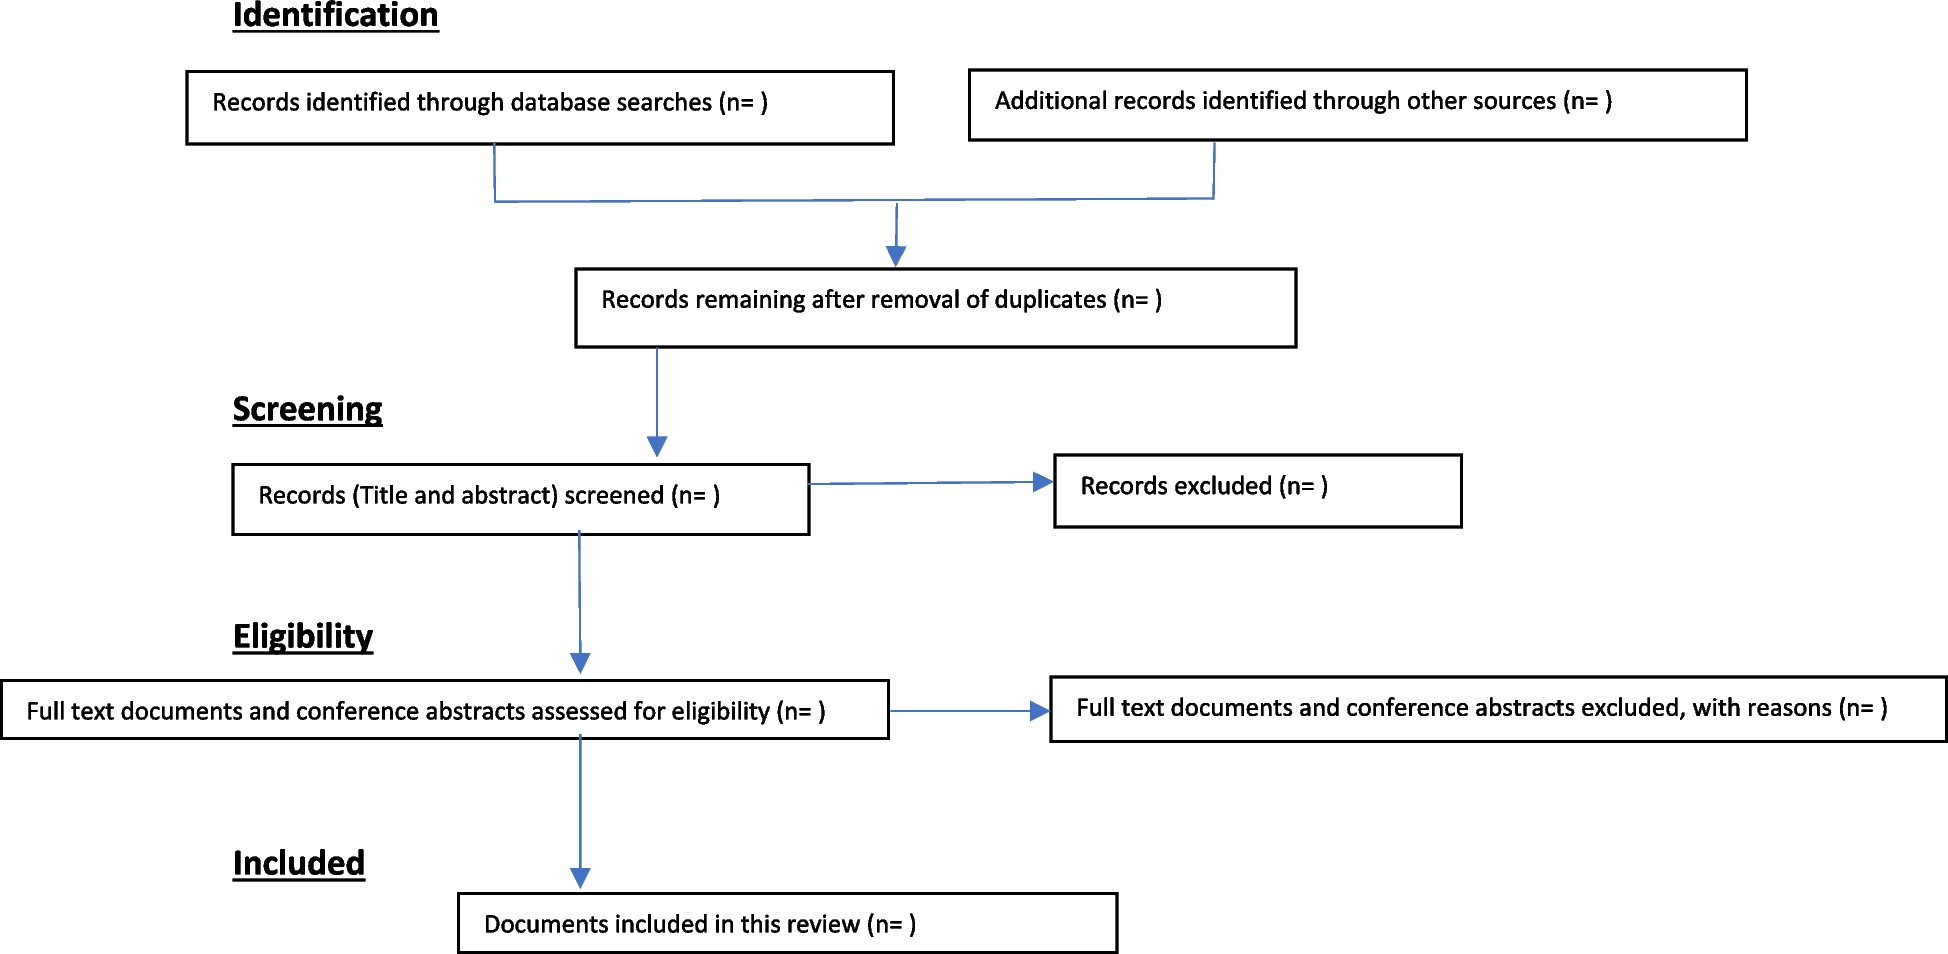


Two thousand one hundred forty-eight records were obtained from the preliminary search. One thousand one hundred fifty-seven duplicate records were excluded before the screening. Nine hundred forty-eight records were eliminated by reading titles/abstracts, and 43 records were included in the full-text evaluation. Twenty-seven articles were excluded because of inconsistent outcomes or treatment and 16 studies were finally selected. The retrieval process and results are shown in Fig. 1.
Fig. 1
Flow diagram of the literature search
Literature characteristics and quality evaluationThis meta-analysis included 16 studies [8, 26,27,28,29,30,31,32,33,34,35,36,37,38,39,40] with a total of 2148 patients. Three of the studies enrolled patients ≥ 18 years of age, one study only enrolled elderly patients, seven studies only enrolled children, and five studies did not set age limits. The general characteristics of the included studies are given in Table 1. Among the 16 included articles, the quality evaluation results of 13 cohort studies were shown in Supplementary Table S1, of which 4 studies had a NOS score of 8, 7 studies had a score of 7, and 2 study had a score of 6, all meeting the study criteria. The Cochrane risk of bias assessment of the three RCTs was low risk of bias and high quality. The results are given in Supplementary Figure S1.
Table 1 The general characteristics of the included studiesResults of meta-analysisOverall response rate (ORR)Fifteen studies compared the ORR difference between IST combined with EPAG and IST for SAA treatment.
Ten out of fifteen studies described the ORR at 3 months. The results of the meta-analysis shown in Fig. 2, which indicated that IST combined with EPAG could improve the 3 months ORR of SAA patients (pooled OR = 2.10, 95% CI 1.58–2.79, p < 0.00001). There was no heterogeneity among these studies (p = 0.52, I2 = 0%).
Fig. 2
Overall response rate (ORR) at 3 months. EPAG: eltrombopag, IST: immunosuppressive therapy, CI: confidence interval
All studies described the ORR at 6 months. The results of meta-analysis showed in Fig. 3, which indicated that IST combined with EPAG could improve the 6 months ORR of SAA patients (pooled OR = 2.13, 95% CI 1.60–2.83, p < 0.00001). There was no heterogeneity among these studies (p = 0.12, I2 = 31%).
Fig. 3
Overall response rate (ORR) at 6 months. EPAG: eltrombopag, IST: immunosuppressive therapy, CI: confidence interval
Seven out of 15 studies described the ORR at 12 months. The results of the meta-analysis shown in Fig. 4, which indicated that EPAG added to IST had no effect on 12 months ORR of SAA patients (pooled OR = 1.13, 95% CI 0.75–1.72, p = 0.55). There was no heterogeneity among these studies (p = 0.33, I2 = 12%).
Fig. 4
Overall response rate (ORR) at 12 months. EPAG: eltrombopag, IST: immunosuppressive therapy, CI: confidence interval
Complete response rate (CRR)Fourteen studies compared the CRR difference between IST combined with EPAG and IST for SAA treatment.
Nine out of 14 studies described the CRR at 3 months. The results of the meta-analysis shown in Fig. 5, indicated that IST combined with EPAG could improve the 3 months CRR of SAA patients (pooled OR = 2.73, 95% CI 1.83–4.09, p < 0.00001). There was no heterogeneity among these studies (p = 0.89, I2 = 0%).
Fig. 5
Complete response rate (CRR) at 3 months. EPAG: eltrombopag, IST: immunosuppressive therapy, CI: confidence interval
All studies described the CRR at 6 months. The results of meta-analysis showed in Fig. 6, which indicated that IST combined with EPAG could improve the 6 months CRR of SAA patients (pooled OR = 2.76, 95% CI 2.08–3.67, p < 0.00001). There was no heterogeneity among these studies (p = 0.17, I2 = 26%).
Fig. 6
Complete response rate (CRR) at 6 months. EPAG: eltrombopag, IST: immunosuppressive therapy, CI: confidence interval
Seven out of 14 studies described the CRR at 12 months. The results of the meta-analysis shown in Fig. 7, indicated that IST combined with EPAG had no effect on 12 months CRR of SAA patients (pooled OR = 1.38, 95% CI 0.85–2.23, p = 0.19). There was no heterogeneity among these studies (p = 0.13, I2 = 39%).
Fig. 7
Complete response rate (CRR) at 12 months. EPAG: eltrombopag, IST: immunosuppressive therapy, CI: confidence interval
Overall survival rate (OSR)Thirteen studies compared the difference in OSR between IST combined with EPAG and IST for the treatment of SAA patients. The results of the meta-analysis shown in Fig. 8, which indicated that IST combined with EPAG could improve the overall survival rate of SAA patients (pooled OR = 1.70, 95% CI 1.15–2.51, p = 0.008). There was no heterogeneity among these studies (p = 0.41, I2 = 4%).
Fig. 8
Overall survival rate (OSR). EPAG: eltrombopag, IST: immunosuppressive therapy, CI: confidence interval
Event-free survival rate (EFSR)Seven studies compared the difference in EFSR between IST combined with EPAG and IST for the treatment of SAA patients. The results of the meta-analysis shown in Fig. 9, which indicated that IST combined with EPAG had no effect on the event-free survival rate of SAA patients (pooled OR = 1.40, 95% CI 0.93–2.13, p = 0.11). There was no heterogeneity among these studies (p = 0.22, I2 = 27%).
Fig. 9
Event-free survival rate (EFSR). EPAG: eltrombopag, IST: immunosuppressive therapy, CI: confidence interval
Clone evolution rateSeven studies compared the difference in clonal evolution rate between IST combined with EPAG and IST for the treatment of SAA patients. The results of the meta-analysis shown in Fig. 10, which indicated that IST combined with EPAG did not increase the incidence of clonal evolution rate of SAA patients (pooled OR = 0.68, 95% CI 0.46–1.00, p = 0.05). There was no heterogeneity among these studies (p = 0.60, I2 = 0%).
Fig. 10
Clone evolution rate. EPAG: eltrombopag, IST: immunosuppressive therapy, CI: confidence interval
Subgroup analysisSubgroup analysis of different study designsUsing ORR and CRR as indexes, subgroup analysis was performed according to the study design (Table 2). The subgroup analysis results of different study designs indicated that whether in the cohort study subgroup or RCT subgroup, IST combined with EPAG could improve the ORR and CRR at 3 and 6 months of SAA patients, but had no effect on 12 months CRR of SAA patients. The p values for the interactions were all greater than 0.05, suggesting that ORR and CRR were not influenced by the study design.
Table 2 Subgroup analysis of different study designsSubgroup analysis of different agesUsing ORR and CRR as indexes, subgroup analysis was also performed according to age (Table 3).
Table 3 Subgroup analysis of different agesThe results of < 18 years age subgroup analysis indicated that IST combined with EPAG could improve the ORR at 3 months and CRR at 3 and 6 months of SAA patients, but had no effect on 6 months and 12 months ORR and 12 months CRR.
The results of ≥ 18 years age subgroup analysis indicated that IST combined with EPAG could improve the ORR at 3 of SAA patients, and had no effect on 6 and 12 months, but could improve the CRR at 6 and 12 months of SAA patients. In addition, only 1 study met the inclusion criteria at 3 months CRR rendering the statistical analysis invalid.
The results of without age limit subgroup analysis indicated that IST combined with EPAG had no effect on 3 months ORR of SAA patients, but could improve the ORR at 6 months and CRR at 3 and 6 months of SAA patients. There were no eligible data for either ORR or CRR at 12 months.
The p values for the interactions were all greater than 0.05, suggesting that ORR and CRR were not influenced by the age of patients.
Subgroup analysis of different follow-up timeUsing OSR and EFSR as indexes, subgroup analysis was also performed according to age (Table 4).
Table 4 Subgroup analysis of different follow-up timeThe subgroup analysis results of different follow-up times indicated that IST combined with EPAG could improve the OSR and EFSR of SAA patients in both < 2 years and ≥ 2 years. The p values for the interactions were all greater than 0.05, suggesting that OSR and EFSR were not influenced by follow-up time.
Assessment of publication biasReview Manager 5.4.1 was used to evaluate results of 3 months ORR, 6 months ORR, and OSR for publication bias, and funnel plots were drawn as shown in Supplementary Figures S2, S3, and S4. No evidence of asymmetry was shown. Then, we further carried out Begg’s and Egger’s test, and the results suggested that there was no publication bias in this study (3 months ORR: Begg’s test p = 0.721, Egger’s test p = 0.832; 6 months ORR: Begg’s test p = 0.274, Egger's test p = 0.676; OSR: Begg’s test p = 0.583, Egger’s test p = 0.361).
留言 (0)