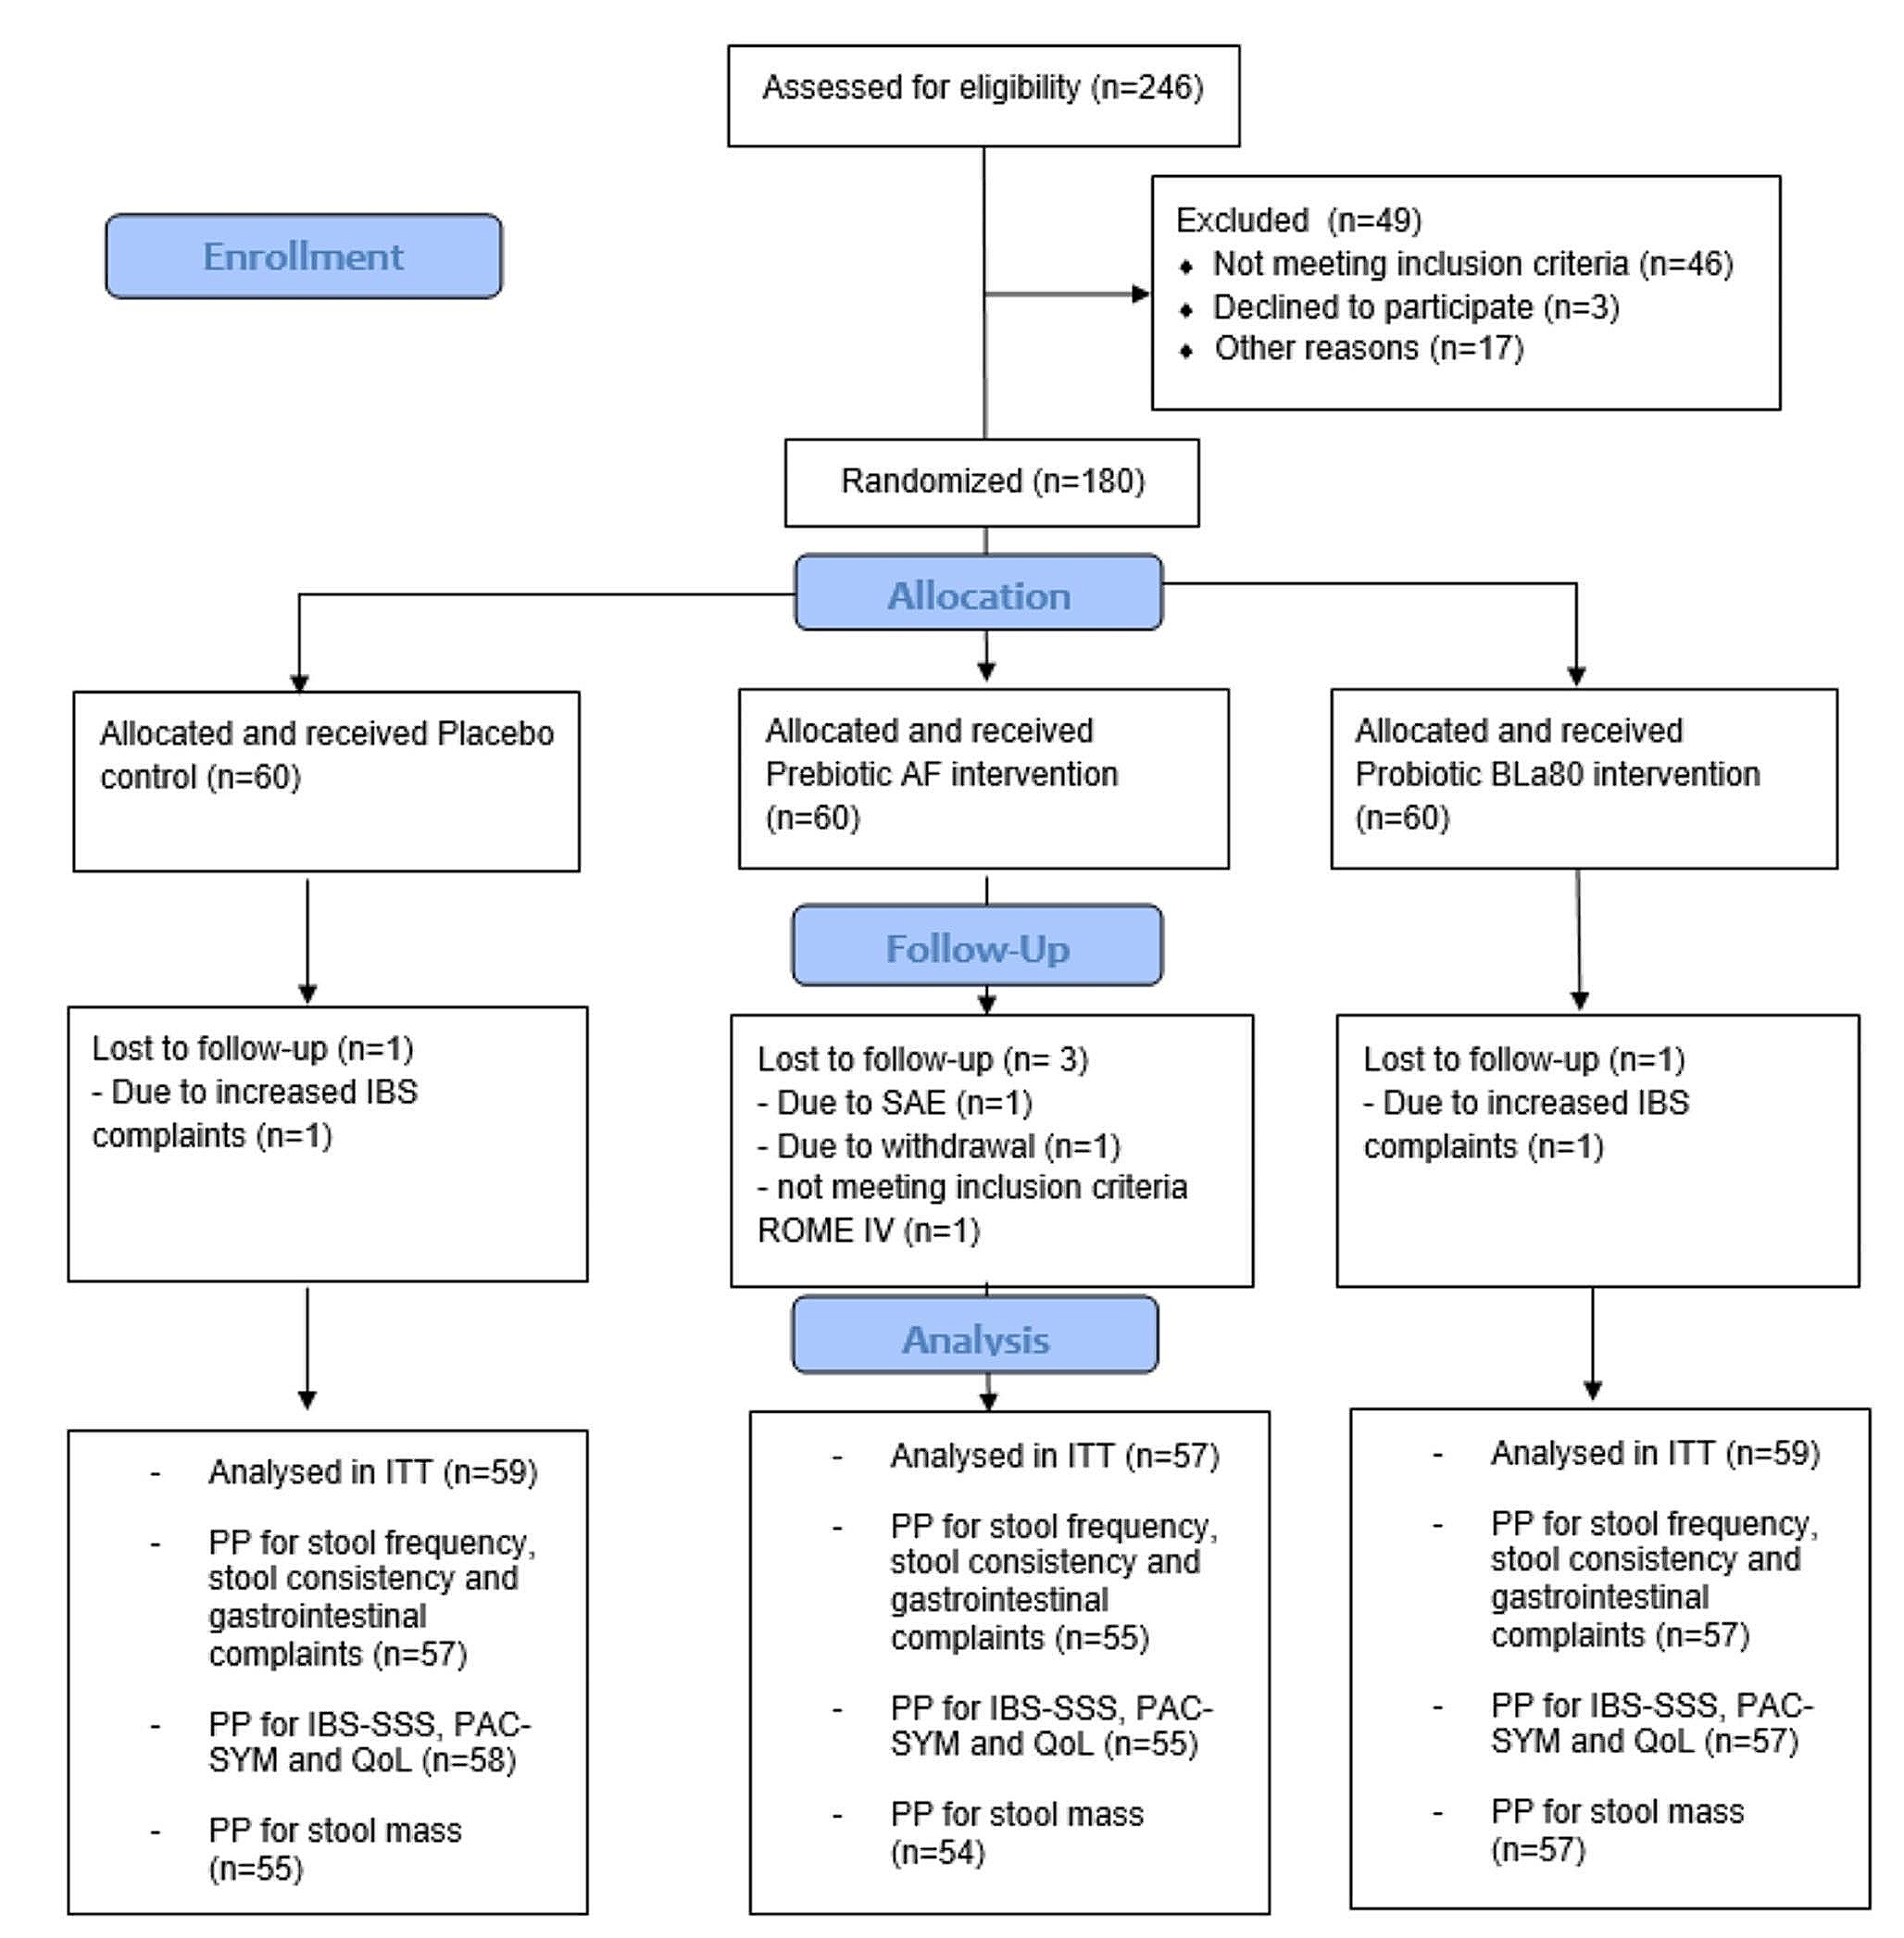
Study design
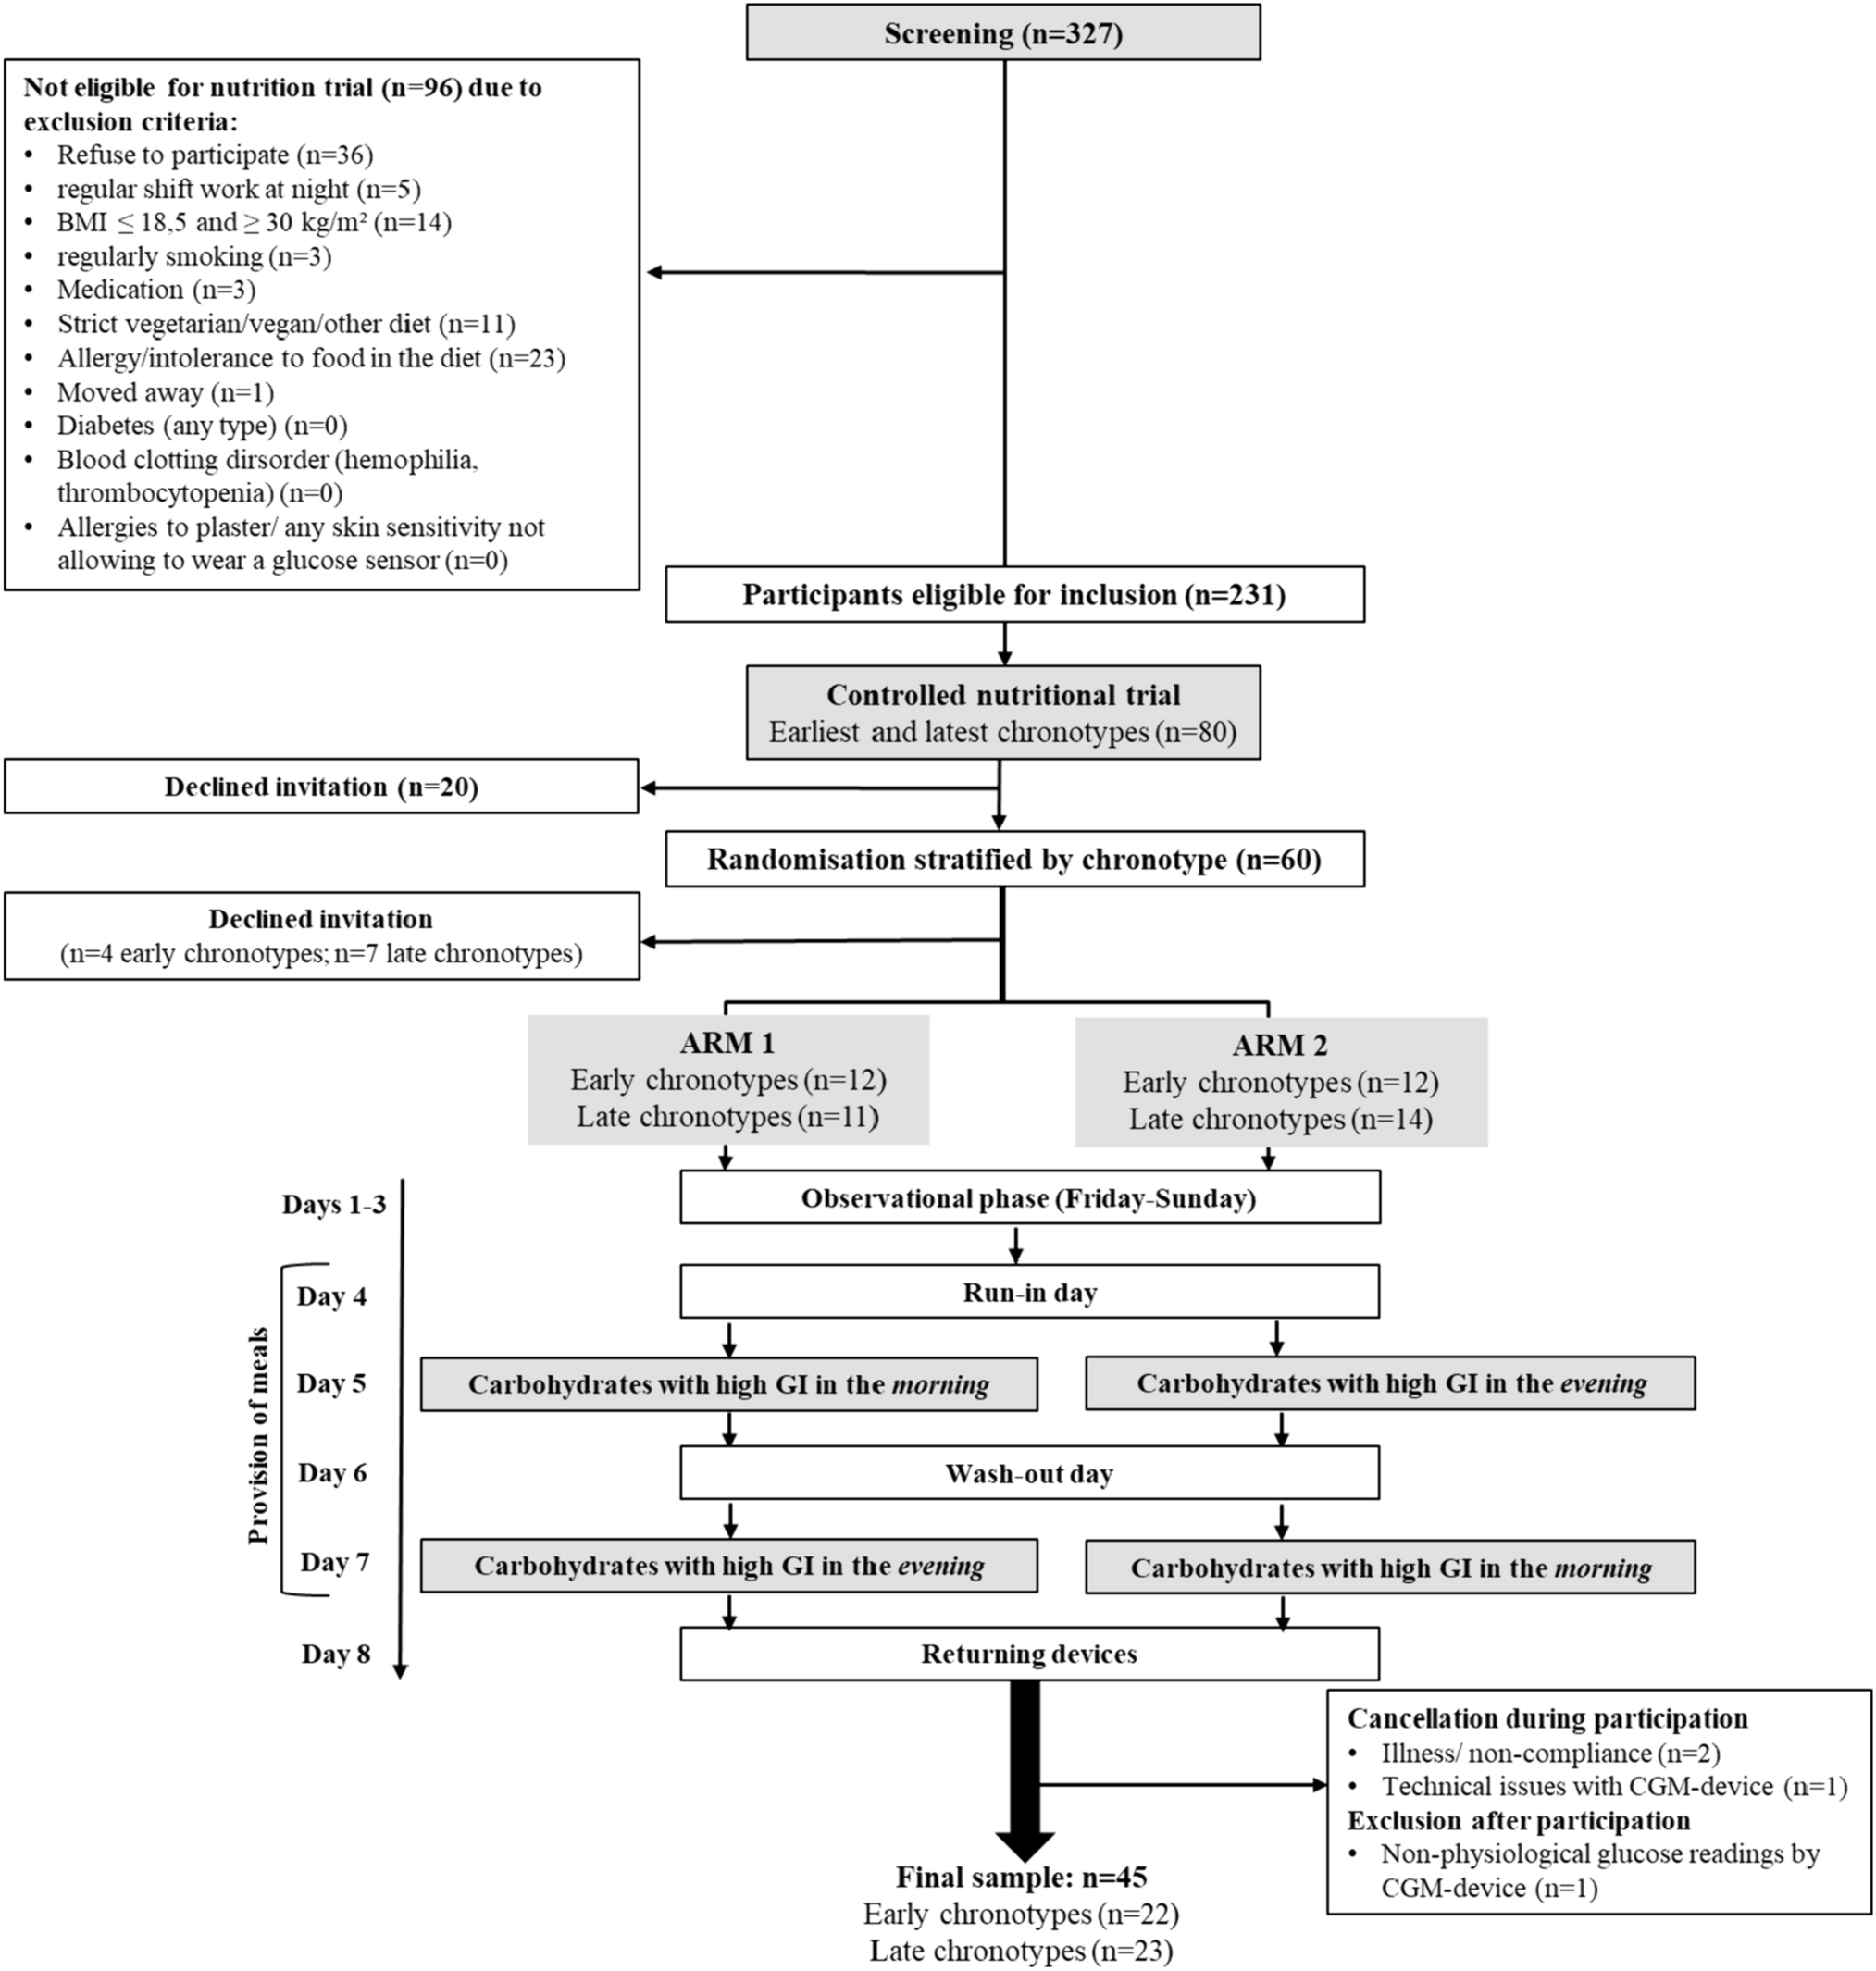
This study is an observational matched case–control study in 13–17-year-old adolescents with diagnosed pMDD and healthy controls. The adolescents were matched in a 1:1 ratio according to sex, age group (13 to < 16 and 16 to < 18 years) and education level. The sample size calculation for this study was performed with G*Power V3.1.9.2. A logistic model, where the Children’s Depression Rating Scale-Revised (CDRS-R) score for depression severity was coded as a dichotomous variable in a model with 10 covariates (residual R2 = 0.2) and one standard deviation (SD) increase of the continuous predictor generated an odds ratio (OR) of 1.5 and 2, was used as the basis for a power calculation. According to these power calculations, to detect medium to large effect sizes for a type-I error of 5% (alpha = 0.05) a sample size of 200 individuals with a 1:1 matching case–control ratio was sufficient (power > 80%, beta ≥ 20%). Up to a drop-out rate of 10%, these results seemed robust. To have a balanced sample, we aimed to include 102 cases and 102 controls, with equal representation of sex, age groups, and education level in cases and controls. In the first age group (13 to < 16 years), the aim was to include 50 adolescents (25 females and 25 males) for each the cases and the controls. In the second age group (16 to < 18 years), the aim was to recruit 52 adolescents (26 females and 26 males) for both, the cases and the controls. In the younger age group, all adolescents attended lower secondary school level (mandatory school years in Switzerland). For the older age group, adolescents were further matched based on their higher secondary school educational level (n = 26 from each level): (1) vocational education (apprenticeship), and (2) baccalaureate/vocational baccalaureate. In this case–control study, the recruitment of controls followed the mentioned recruitment strategy and the cases were then randomly selected to match the controls.
The ethics committee of the Canton of Zurich approved this study (BASEC-Nr. 2019-00717) and the study was registered at www.ClinicalTrials.gov (NCT04158869). The study was approved as an add-on study to the investigator-initiated clinical trial (SNSF 33IC30_166826, BASEC-Nr. 2016-02116). Written informed consent was obtained from all the caregivers and adolescents ≥ 14 years of age, and adolescents < 14 years of age gave their oral assent before any research-related assessments were conducted.
Participants and proceduresControl group
The Laboratory of Human Nutrition at ETH Zurich, Switzerland, recruited the healthy controls for this study. From the canton of Zurich and surrounding German-speaking cantons of Switzerland, healthy female and male controls were recruited from September 2019 until December 2020. Schools, leisure time clubs, and social media were sites for recruiting the controls. Inclusion criteria for controls were no present nor past primary diagnosed psychiatric disorder according to the Mini-International Neuropsychiatric Interview for Children and Adolescents (M.I.N.I. KID) [34]; age of 13 to < 18 years; and no use of chronic medication. Adolescents were not eligible as controls if they reported pre-existing neurological or medical conditions likely to be a risk factor for developing depressive symptoms; if they took n-3 PUFA supplements (providing > 600 mg combined EPA/DHA) for more than 4 weeks within the last 6 months; or if they were unable to follow the study procedures, for example, due to language barriers. Once consent was given and the participants enrolled into the study, they electronically completed questionnaires on REDCap® (Research Electronic Data Capture) within 2 weeks prior to the physical data assessment at ETH Zurich.
pMDD group
The cases in this study were randomly selected from the participants of the Omega-3 Fatty Acids as treatment for Paediatric Major Depressive Disorder Trial (Omega-3 pMDD) under the lead of the Psychiatric University Hospital Zurich to match the controls. The Omega-3 pMDD protocol has been published before [35]. The recruitment for the omega-3 pMDD study took place at seven different in- and outpatient service centres in five German-speaking cantons of Switzerland from May 2017 until June 2021. The information about the study reached the adolescents either via their clinician or via posters and flyers in one of the participating centres. When seeing the study on their own initiative, individuals contacted the study team themselves without the involvement of a clinician. Inclusion criteria for teenagers were age of 13 to < 18 years; and a main diagnosis of MDD according to DSM-IV criteria [36] of at least moderate severity defined by a CDRS-R total score of ≥ 40 [37]. Adolescents were not eligible if they had a lifetime diagnosis of schizophrenia, bipolar affective disorder, substance use dependency, mental retardation, or pervasive development disorder; or if they fulfilled the diagnostic criteria for an eating disorder within the last 6 months. In addition, cases were not eligible if they had pre-existing neurological or medical conditions, which were likely to cause their depressive symptoms. Furthermore, if cases were taking n-3 PUFA supplements (> 600 mg combined EPA/DHA) within the last 6 months; or if they or their families were unable to follow the study procedures, for example, due to language barriers, they were not eligible for the study. After consenting to the study, the screening interview was conducted with the adolescents and a parent separately. In this screening interview, inclusion and exclusion criteria were assessed using the Kiddie-Schedule for Affective Disorders and Schizophrenia (K-SADS) [38] for assessing the presence of MDD and the CDRS-R for assessing the severity of the depression. For this case–control study, only data (biological samples and CDRS-R scores) from the baseline assessment before randomisation was used.
Data collection
The study team made every possible effort to align the study procedures between controls and cases as much as possible.
Assessment of anthropometry and socio-demographic information
For the cases and the controls, weight (to the nearest 0.1 kg) and height (to the nearest 0.5 cm) were measured. Thereof, the body mass index (BMI) was calculated as body weight in kilograms (kg) over the person’s height in metres (m) squared (BMI = kg/m2). Further, BMI-for-age z-scores were calculated with the R package “anthroplus” which is provided by the WHO and uses the children’s and adolescent’s growth reference data [39]. BMI data were then age-dependently categorised into four categories: underweight, normal weight, overweight and obese according to the WHO’s reference values [40]. In adolescents, a z-score < -1 coincides with adult underweight (BMI < 18), while a z-score > + 1 coincides with adult overweight (BMI ≥ 25) and a z-score > + 2 with adult obesity (BMI ≥ 30). Socio-economic and demographic data were assessed by self-reporting questionnaires which the participants were asked to fill out together with one parent.
Assessment of depression severity
We used the CDRS-R to assess adolescents’ presence and severity of depression [37]. The CDRS-R, a semi-structured clinical interview which takes 15–20 min to administer, is one of the most frequently used rating scales for measuring the severity of depression and the change in depressive symptoms in children and adolescents with depression [41]. The validity of the scale has been established for children [42] and adolescents [41]. The interview allows a comprehensive assessment by providing the possibility of conducting it with the child, the parents, and/or teacher. It covers 17 depressive symptom areas which are rated on 5- to 7-point Likert rating scales. The depressive symptom domains are aligned with the DSM-IV criteria for childhood depression [43] and include sleep disturbance, excessive fatigue, suicidal ideation, and social withdrawal. Participants are asked about information on 14 items. Further, three non-verbal symptoms, such as depressed facial affect, are rated only by the interviewer. The interviewers were trained to conduct the interview. Based on the individual ratings, a total score is calculated, ranging between 17 and 113. For this study, scores from the interview conducted with the adolescent were used and a score of ≥ 40 was used as cutoff for pMDD [44].
Questionnaire on history of iron diagnosis and treatment
Participants were asked to fill out a questionnaire on the history of ID diagnosis and ID treatment in the form of oral iron supplementation or intravenous infusion. This questionnaire assessed the lifetime history of ID diagnosis and time point of ID treatment. To control for the confounding effect of iron treatment on iron status in this study, we defined treatment at or close to study inclusion as up to 1 year prior to inclusion, based on the estimated effect duration of iron supplementation of 1 year [45]. For cases and controls, this questionnaire was introduced after recruitment and data assessment had already started. Therefore, for some participants, this questionnaire was answered retrospectively to inclusion and completion of the study.
Biochemical analysis
Blood samples were collected into EDTA-coated tubes and serum tubes (BD Vacutainer). Haemoglobin (Hb) was measured in whole blood using a Sysmex XE_5000 analyzer (Sysmex Corporation). Serum tubes were let to stand for 60 min to allow clotting. Afterwards, the serum tubes were centrifuged, and the serum was then stored at −80 °C until further analysis.
We analysed iron status by measuring SF and soluble Transferrin Receptor (sTfR) and inflammation by measuring CRP and AGP using a multiplex immunoassay [46]. SF values were adjusted for inflammation using the BRINDA method using the R package “BRINDA”, applying “other” population groups as reference [30]. Iron deficiency was defined as inflammation-adjusted SF values < 15 µg/L and/or sTfR > 8.3 mg/L. Anaemia was defined according to the age- and sex-dependent WHO cutoff values for Hb [47, 48]. For all female participants as well as male participants between 12 and 14 years of age, anaemia was defined as Hb < 120 g/L. For male participants 15 years of age and above, anaemia was defined as Hb < 130 g/L. Iron deficiency anaemia (IDA) was defined as the combination of ID with anaemia. CRP > 5 mg/L and/or AGP > 1 g/L were used to define inflammation [49]. I-FABP concentrations were measured using a commercially available Enzyme-Linked Immunosorbent Assay (ELISA) (Hycult Biotech, Uden, The Netherlands).
Data management and statistical methods
For the controls, the data capture was done either electronically using REDCap® or on paper and later entered to the REDCap® system. When captured on paper, the data were entered by the assessing person and later double checked for entry errors by a second member of the study team. REDCap® is an electronic data capture tool hosted at ETH Zurich and provides a secure, web-based software platform designed for supporting data capture in research studies [50, 51]. For the cases, data were assessed on paper and then entered to the electronical data capture tool secuTRIAL by two individual persons. Afterwards, every data entry was checked by a third person for entry errors. Once cases and controls were matched, study data were managed using REDCap®.
Data processing and statistical analysis of data were performed using R Version 3.6.0 [52]. To test for outliers and normality, Q–Q plots, histograms, and the Shapiro–Wilk test were used. Normally distributed data and non-normally distributed data were expressed as mean (± SD) and as medians (Interquartile range, IQR), respectively. For comparing not normally distributed continuous data between cases and controls, Wilcoxon rank sum test was applied, and t-test for normally distributed data. Chi-square tests were applied to test for differences between cases and controls when the expected cell count was ≥ 5, and Fisher’s exact test when the expected cell count was < 5. For producing tables and calculating these differences, the R package “gtsummary” was used. This R package has been shown to produce reproducible summary tables within R [53]. To determine correlations between two non-normally distributed variables, Spearman’s correlation coefficient was calculated. Further, to assess associations of different iron status parameters with depression (CDRS score ≥ 40), multivariate logistic regression analysis was applied. In these models, we used the matching criteria sex, age, and education level, as well as BMI-for-age z-scores, antidepressant use, and AGP as covariates.

留言 (0)