
記住我


A total of 72 subjects were included in the study, with 41 in the obesity group and 31 in the normal. Table 1 provides a summary and comparison of the demographic and specific clinical data between the two groups. The results visualized that the body weight, height, BMI, triglycerides (TG), and uric acid (UA) in the obesity group were significantly higher compared to the normal group, while vitamin D was significantly lower. However, there were no substantial differences between the two groups in terms of gender, age, total cholesterol (TC), low-density lipoprotein (LDL), Ca2+, fasting glucose (Glu), thyroid stimulating hormone (TSH), and parathyroid hormone (PTH).
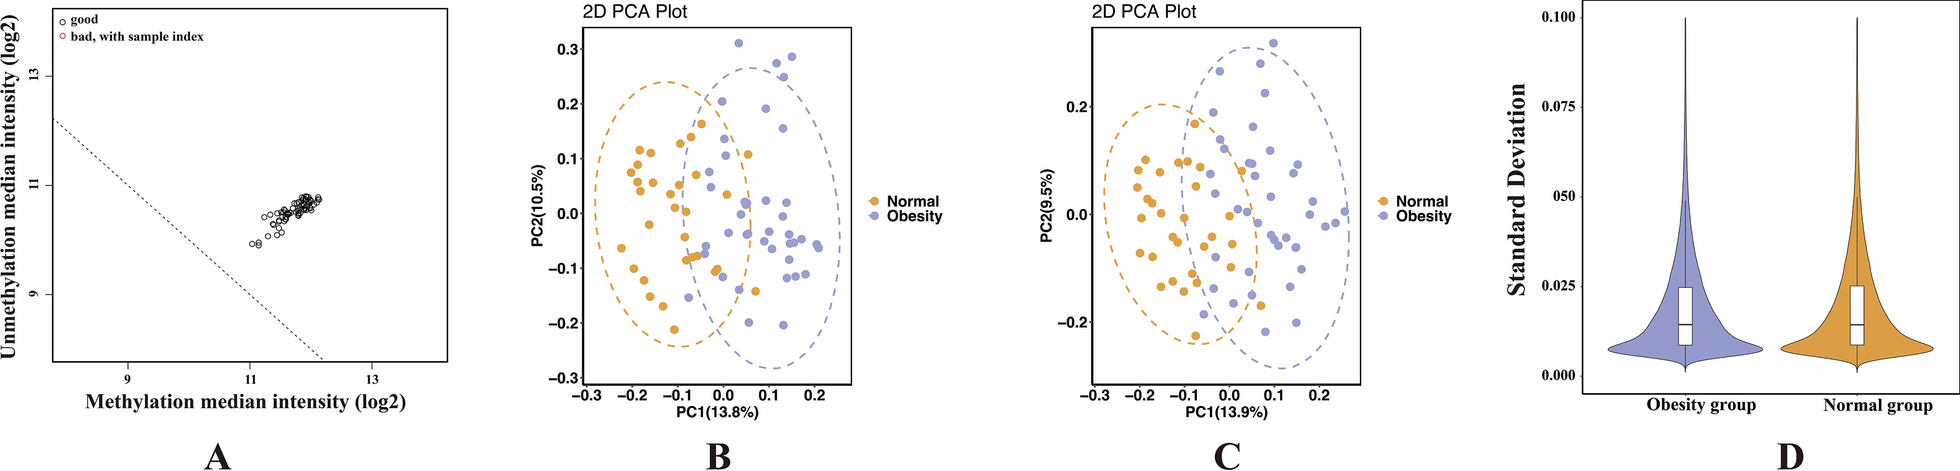
Table 1 Demographics and clinical features of two groupsQuality control results of samples and probesAfter normalizing the raw data, the quality of all enrolled samples was assessed. Figure 1A shows that all samples were satisfied with the quality control standards. The PCA analysis indicated incomplete separation between the two sample groups. However, upon introducing age and gender as covariates in PCA analyses, respectively, it was observed that the two groups could be better distinguished (Fig. 1B and C). This observation suggests that there are some DMS between the obesity and normal groups and, age and gender might be important factors influencing DNA methylation levels in childhood obesity. Figure 1D indicates a good internal consistency within the two groups.
Fig. 1
Quality control results of all samples and probes. A The horizontal axis represents the log2 of methylation median intensity, and the vertical axis represents the log2 of unmethylation median intensity. Each circle represents one sample, and the circles at the upper right of the dotted line meet the quality criterion. B and C represent PCA analysis results with age and gender as covariates, respectively. And the distance between circles reflects the degree of difference in methylation levels among the samples. D The violin plot displays the density and range of the standard deviation of methylation level in each group
DNA methylation in children with obesityA total of 865,721 methylated sites were identified in the two groups. The methylation levels in the obesity group and normal group displayed bimodal distribution (Fig. 2A). In comparison to the normal group, the number of unmethylated sites (0 < β ≤ 0.2) was greater in the obesity group, and the number of methylated sites (0.8 ≤ β ≤ 1) was lower (Fig. 2A). Importantly, the median β-value of the obesity group was lower than that of the normal group (p < 2e-16) (Fig. 2B), indicating a lower reduced genomic DNA methylation level in the obesity group compared to the normal group. Within the obesity group, the methylation level was lower in boys than in girls (p < 0.05) (Fig. 2C).
Fig. 2
Methylation level distribution. A displays the methylation density distribution plot, where the abscissa represents the β-value from 0 to 1, and the ordinate represents the frequency of a certain methylation level. B Methylation level distribution box plot. C Comparison of methylation levels between boys and girls in the obesity group
Among all the detected methylated sites, we identified 241 differential methylated sites (DMS), comprising 118 hypermethylated sites (delta β > 0.1, p-value < 0.05) and 123 hypomethylated sites (delta β < − 0.1, p-value < 0.05) (Fig. 3A), which were associated with 132 genes referred to as differential methylated genes (DMGs). Furthermore, the majority of DMS were found on autosome 6 (Fig. 3B).
Fig. 3
The characteristics of differentially methylated sites in obesity. A illustrates the volcano plot of the differentially methylated sites (DMS) based on the DNA methylation differences (delta β) and the significance of the difference (p-value). Red circles represent differentially hypermethylated sites and blue circles represent differentially hypomethylated sites. B The distribution plot showing the locations of DMS on the chromosomes. C The distribution of DMS across annotations regardless to the genes. DThe distribution of DMS concerning CpG islands
Distribution analysis of DMS in correlation with gene features and CpG island regionsTo explore the potential impact of DMS on gene expression, we conducted a comprehensive examination of their distribution. Among the 241 identified DMS, 155 were associated with gene features, including 78 hypermethylated sites and 77 hypomethylated sites, with 78 found in genic regions and the remaining in intergenic regions. Figure 3B illustrates the distribution of DMS in relation to their genomic locations. Notably, within the annotated region, the majority of DMS were situated in the gene body region (Fig. 3C). Interestingly, despite an equal count of differentially hypermethylated and hypomethylated sites in the promoter region (encompassing TSS1500, TSS200, 5'UTR, and first exon regions), there was a discernible elevation in methylation levels (mean delta β of DMS in the region was 0.0075) as opposed to low methylation (Fig. 3C) (Supplementary Table 2). Furthermore, there are a total of 79 DMS situated within CpG island (CGI) regions, consisting of 43 hypermethylated sites and 36 hypomethylated sites. Figure 3D shows the distribution of DMS in CGI regions, highlighting a notably elevated average methylation level within these genomic loci.
GO enrichment and KEGG pathway analysisTo gain deeper understand the functions of DMGs and the potential mechanistic pathways underlying the onset and progression of obesity, we performed GO enrichment and KEGG pathway analyses. GO enrichment analysis revealed associations with 74 out of the 241 DMGs, with the predominant clusters of GO terms encompassing binding, cell part, cell, cellular process, and organelle. Notably, the top 30 significantly enriched terms included functions such as ATPase activity and T-cell aggregation (Fig. 4A and B).
Fig. 4
Functional annotations of differentially methylated genes. A and C show the GO and KEGG classifications, respectively. The abscissa represents the number of genes, while the ordinate represents the categories of GO terms and KEGG pathways, respectively. B and D display the bubble plots of GO and KEGG enrichment analysis, respectively. The abscissa referring to the rich factors, and the ordinate representing the GO and KEGG items, respectively. The larger the rich factors and the smaller the p-value, the more significant the enrichment. A bigger bubble size indicates a higher number of enriched genes
According to the KEGG pathway classification, a total of 51 DMGs were matched to 118 KEGG pathways. The top 3 KEGG pathways were “Environmental Information Processing, Signal transduction”, “Human disease, Cancers: Overview”, and “Organismal System, Endocrine”. Furthermore, KEGG pathway enrichment analysis highlighted 14 pathways with significant enrichment, including Cell adhesion molecules, PI3K-AKT signaling pathway, and FoxO signaling pathway (Fig. 4C and D).
Identification of the characteristic DMGsAccording to our filter standards, just 2 DMS were recognized as characteristic: CpG-cg05831083 and CpG-cg14926485, corresponding to the genes TFAM and PIEZO1, respectively. And the methylation level of CpG-cg05831083 was significantly lower in the obesity group, while CpG-cg14926485 showed significantly higher (Fig. 5A and B).
Fig. 5
A and B depict the methylation levels of CpG-cg05831083 and CpG-cg14926485, respectively. The left side of the box plot shows the results from the Illumina 850k chip, while the right presents validation results from pyrosequencing. C and D illustrate the correlation between pyrosequencing and Illumina 850k chip results. “850k” refers to Illumina 850k chip, and “pyro” refers to pyrosequencing. “*” p-value < 0.05; “***” p-value < 0.001; “****” p-value < 0.0001. “r” represents the Pearson correlation coefficient
Pyrosequencing results of characteristic DMSTo validate the methylation levels of characteristic differentially methylated sites selected from Illumina 850K results, we randomly chose ten obesity cases and ten normal cases from two groups to for pyrosequencing. The results of pyrosequencing demonstrated a high degree of concordance in the methylation level of TFAM CpG-cg05831083 and PIEZO1 CpG-cg14926485 with Illumina 850K results (Fig. 5A and B). Although the observed differences in the methylation levels of CpG-cg05831083 and CpG-cg14926485 between the two groups in the pyrosequencing data were not statistically significant, possibly attributed to the limited sample size, the consistent trends observed reinforce the validity of our findings from another perspective. To further evaluate the reliability of the results, we conducted correlation analyses between Illumina 850K chip data and pyrosequencing data. The correlation analysis revealed a significant positive correlation between the methylation levels of CpG-cg05831083 (r = 0.50, p-value < 0.05) and CpG-cg14926485 (r = 0.62, p-value < 0.05) in pyrosequencing results and the corresponding Illumina 850K results (Fig. 5C and D). Considering age and gender as covariates, we were able to clearly distinguish between the normal and obese groups. Consequently, utilizing age and gender as covariates, we separately examined the expression levels of differentially methylated sites. The results indicate that the expression trends of the two differentially methylated sites in both groups align with those observed without covariates (Supplementary Fig. 1). This suggests that these two distinct methylated sites are minimally influenced by age and gender, possibly having little to no impact.
The AUC of characteristic DMSROC curve analysis based on methylation values reveals the potential value of TFAM CpG-cg05831083 and PIEZO1 CpG-cg14926485 in predicting childhood obesity, with the AUC values of 67.6% and 65.2%, respectively (Fig. 6A and B). Specifically, TFAM CpG-cg05831083 shows high specificity and low sensitivity, indicating its accuracy in excluding non-obese individuals but lower accuracy in identifying obese children. Conversely, PIEZO1 CpG-cg14926485 exhibits high sensitivity and low specificity, suggesting its accuracy in correctly identifying obesity. When considering both sites together, the AUC increases to 74%, with a significant enhancement in specificity to 96.8%, highlighting their synergistic effect (Fig. 6C).
Fig. 6
A and B respectively represent the area under ROC curves (AUC) values for CpG-cg05831083 and CpG-cg14926485. C represents the combined AUC when both are considered together
Overall, these findings suggest that methylation patterns of CpG-cg05831083 and CpG-cg14926485 could serve as potential biomarkers for childhood obesity, especially when considered jointly for improved predictive capability.
Correlations between characteristic DMS and clinical variablesThe methylation level of TFAM CpG-cg05831083 was remarkably positively related to Vitamin D (r = 0.2643, p-value < 0.05) and inversely correlated with BMI (r = − 0.2822, p-value < 0.05). However, the methylation level of PIEZO1 CpG-cg14926485 showed no significant association with collected clinical indicators (Fig. 7).
Fig. 7
The heatmap represents the correlation between characteristic differentially methylated sites and clinical variables. The blue squares depict negative correlations, while the red squares designate positive ones. The color intensity indicates the strength of the correlations. “r” represents the Pearson coefficient. “*” p-value < 0.05
留言 (0)