Cell culture and mechanical stretch
Primary mouse and human VSMCs (ATCC, Manassas, VA) were cultured in Dulbecco’s Modified Eagle’s Medium (DMEM) supplemented with 10% fetal bovine serum and 1% penicillin–streptomycin at 37 °C in a humidified atmosphere of 5% CO2 and 95% air. After reaching 80–90% confluence, VSMCs between passages 3–8 were used for experiments. In addition to mouse vascular smooth muscle cells, a human cell line (ATCC, Manassas, VA) was utilized for RNA interference and osteogenic differentiation experiments in order to translate and validate key findings across species. To apply mechanical stretch, VSMCs with the cell density of 2 × 10⁵ cells/well were seeded onto collagen type I pre-coated 6-well Bioflex® plates (Flexcell International Crop, Burlington, NC) in the presence of DMEM, 1% penicillin/streptomycin and 10% EVs deprived serum. EV-deprived serum was obtained by ultracentrifugation at 100,000 × g for 15 h, after which the supernatant was collected for use. To apply 10% equibiaxial mechanical stretch (0.5 Hz, 72 h) on cultured VSMCs, a Flexcell® FX-5000 T tension system (Flexcell International Corp.) was utilized. Non-stretched VSMCs seeded on 0.2% gelatin-coated tissue culture plastic plates were used to establish a common baseline for comparison between the groups exposed to different levels of stretch. To determine the viability of VSMCs following prescribed culture regimen, we used a commercially available assay kit (Abcam, Cambridge, United Kingdom). The live cell dye penetrates intact, live cells and produces a fluorescence signal (Ex/Em = 485/530 nm) following hydrolysis by active intracellular esterases. The fluorescent dead cell dye (Ex/Em = 495/635 nm) is impermeable to live cells but enters damaged cells and binds to nucleic acids. Following the addition of the dyes according to the manufacturer’s instructions, cells were imaged with a Zeiss Axioscope upright fluorescence microscope. Live and dead cells were counted using ImageJ and used to calculate overall viability.
The following specific inhibitors were used for the prescribed treatments: Dynasore (40 µM; APExBIO, Houston, TX) as GTPase inhibitor of dynamin, and Y-27632 dihydrochloride (10 µM; Biotechne, Bristol, United Kingdom) for RhoA kinase inhibition.
Osteogenic stimulation
In order to induce a pro-calcific phenotype, VSMCs were cultured in osteogenic media for 7 days prior to applying 10% mechanical stretch, in order to induce a pro-calcific phenotype. The osteogenic media consisted of complete control media supplemented with dexamethasone (10 nM; Sigma), L-ascorbic acid (100 μM; Sigma), and β-glycerolphosphate (10 mM; Sigma).
Western blot analysis
VSMCs lysates were prepared in ice-cold RIPA Buffer. EVs were isolated from the conditioned media of VSMCs via centrifugation at 1000 g for 5 min to remove cell debris followed by ultracentrifugation at 100,000 g for 60 min at 4 °C using an Optima Max-TL ultracentrifuge (Beckman Coulter, Brea, CA). Isolated EVs were lysed in protein lysis buffer. Following the BCA protein concentration assessment, equal amounts of the lysates were separated with 10% SDS–polyacrylamide gel electrophoresis and then transferred onto nitrocellulose membranes (Bio-Rad, Hercules, CA). Due to lack of appropriate loading control for the EVs, Ponceau S was used to confirm equal protein loading. Membranes were blocked for 1 h at room temperature in casein blocking buffer in TBST (Sigma-Aldrich, St. Louis, MO) and then 1–2 h at room temperature with primary antibodies for Caveolin-1 (1:500; Abcam, Cambridge, United Kingdom), Annexin V (1:500; Abcam, Cambridge, United Kingdom) or CD63 (1:500; Abcam, Cambridge, United Kingdom). Following washing, the species appropriate secondary antibody (1:10,000; LI-COR, Lincoln, NE) was added for 1 h at room temperature. Visualization was performed using an Odyssey®CLx (LI-COR, Lincoln, NE) and band densities were analyzed using Image Studio® (LI-COR).
Caveolae/lipid raft isolation
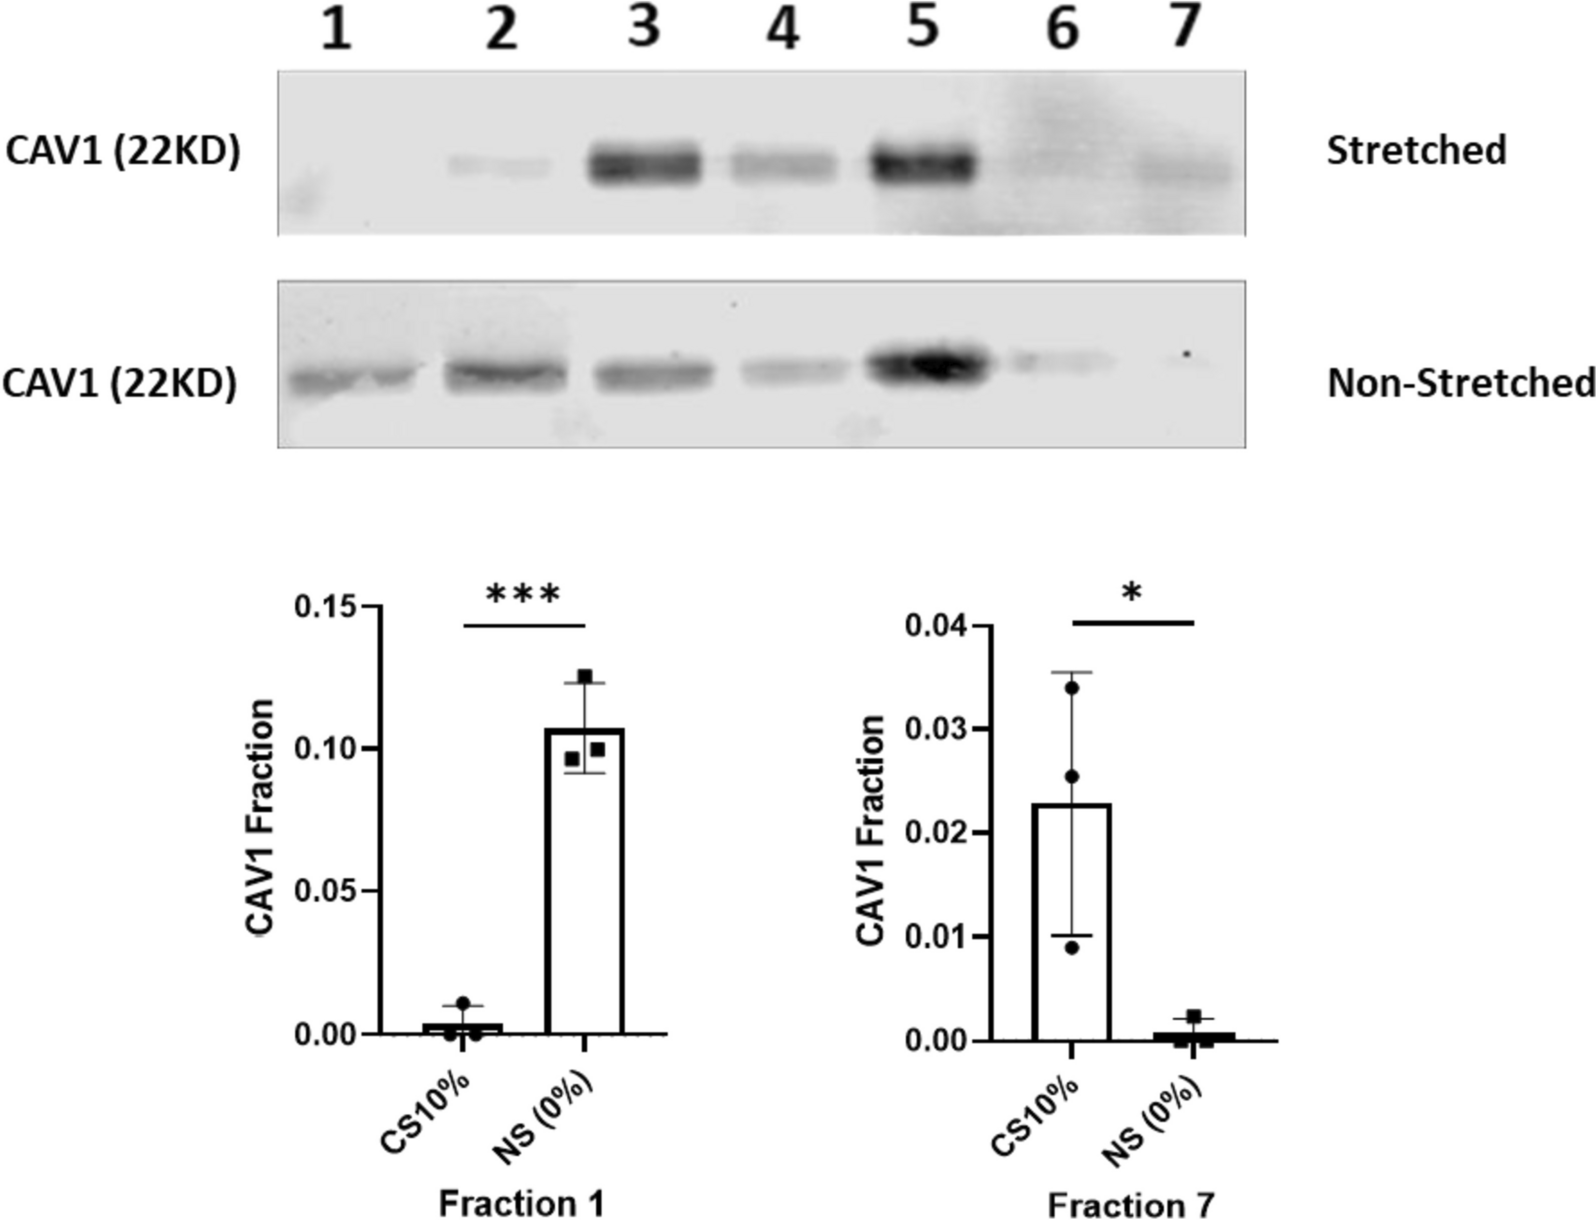
Isolation of detergent-resistant membranes enriched in caveolae and lipid rafts was performed using a caveolae/raft isolation kit (Sigma-Aldrich) according to the manufacturer's instructions. Briefly, cultured VSMCs were lysed in ice-cold lysis buffer containing 1% Triton X-100 and homogenized. The lysates were combined with an equal volume of 60% OptiPrep density gradient medium and overlaid with layers of 35% and 5% OptiPrep in gradient buffer. The samples were ultracentrifuged at 200,000 × g for 4 h at 4 °C to allow separation of detergent-soluble and insoluble fractions across the gradient. Detergent-resistant membranes enriched in caveolae/raft components floated to the 5–35% interface (1–7 fractions) and were collected. These buoyant membrane fractions were confirmed to be enriched in canonical lipid raft markers by immunoblotting of Cav-1.
Cellular cholesterol measurment
Cellular lipids and cholesterol were extracted from cultured VSMCs using an organic solvent-based method. Briefly, VSMCs were homogenized in a 3:2 hexane:isopropanol solution to lyse cell membranes and extract lipids. The homogenates were centrifuged to separate the aqueous and organic phases. The upper organic phase containing lipids was transferred to a clean microcentrifuge tube and dried under vacuum to recover total cellular lipids. Immediately prior to quantification, the dried lipids were resuspended in isopropanol. Total cholesterol content was measured employing Cholesterol E kit (Fujifilm Wako Diagnostics) enzymatic colorimetric assay kit according to the manufacturer's protocol.
Immunofluorescence analysis
VSMCs were fixed with 4% formalin for 10–15 min and permeabilized by 0.1% Triton X-100 (Fisher scientific, Waltham, MA) for 10 min. Non-specific binding sites were blocked with 0.1 mM glycine in 1% BSA for 30 min at room temperature. Next, cells were incubated with caveolin-1 primary antibody (1:200) for 2 h at room temperature, washed with 1X PBS, and incubated with secondary antibody Alexa Fluor® 594 (1:400; Abcam, Cambridge, United Kingdom) for 1 h at room temperature. Cells were co-stained with Phalloidin-iFluor™ 488 Conjugate (1:1000; Cayman chemical, Ann Arbor, MI) for 30 min. The stained cells were mounted in Permount™ Mounting Medium (Fisher scientific) and imaged using a laser scanning confocal microscope (Eclipse Ti, Nikon, Minato City, Tokyo, Japan).
RNA interference
To silence caveolin-1 expression, 50 nm siRNA against caveolin-1 (s2448, Life Technology) and non-targeting siRNA (ON-TARGET Non-Targeting Pool, Thermo Scientific) was transfected into VSMCs using (Thermo Scientific). Transfection was performed 48 h prior to mechanical stretch exposure.
Mineral formation assay
In order to measure the real-time mineral formation of EVs, we used an assay originally developed to study mineral formation from growth plate cartilage EVs [42]. For kinetic assay, 1% (v/v) of 300 mM NaH2PO4 (Sigma-Aldrich, St. Louis, MO) was added to 200 µl of EVs stock solution of each sample and suspensions were placed into 96 well plates and incubated at 37 °C in a Synergy HT microplate reader (Biotek, Winooski, VT) for 16 h. The absorbency reading was recorded at 340 nm at 1-min interval.
Collagen hydrogel experiments
Collagen hydrogels were prepared by mixing high-concentration rat tail collagen with DMEM in a 1:19 ratio and neutralizing the mixture to pH 7–8. The neutralized collagen solution was then added to chambered coverglass wells (LAB-TEK). The conditioned media of VSMCs, containing EVs, were added to the collagen network and incubated at 37 °C for the indicated time period. One day before imaging, a near-infrared-based bisphosphonate calcium tracer (OsteoSense 680, Perkin Elmer) was added to the hydrogels and incubated overnight at 37 °C. The resulting aggregation and calcification processes were imaged by fluorescence microscopy (Ziess AXIO). Quantitative image analysis of the captured fluorescence micrographs was performed using ImageJ software (NIH).
Alkaline phosphatase activity assay
Alkaline phosphatase (ALP) activity in cells and EVs was measured using a colorimetric assay kit (Abcam) according to the manufacturer’s protocol. Briefly, cell lysates were collected in the supplied buffer and centrifuged to remove insoluble material. The supernatants were added to a 96-well plate at a volume of 80 μL per well after dilution with the provided assay buffer. Diluted p-nitrophenyl phosphate (pNPP) substrate was then added to each sample well and the plate was incubated at 25 °C protected from light for 1 h to allow the enzymatic reaction to occur. The reaction was stopped by addition of a stop solution. Finally, the absorbance was measured at 405 nm using a microplate reader to quantify ALP activity.
Statistical analysis
Each experiment was performed for at least three biological replications, and all data were presented as mean ± SD. Student’s t-test was used to analyze two group comparisons. Multiple group comparisons were conducted by one-way ANOVA. All statistical tests were calculated using GraphPad Prism 9.00 (GraphPad Software). A P-value less than 0.05 was considered statistically significant.


留言 (0)