
記住我


AIDS is a chronic infectious disease caused by HIV infection. HIV destroys the human immune system, and without treatment, can eventually lead to the patient's death. Although antiretroviral therapy (ART) can partially restore the immune function of patients, not all people with HIV (PWH) achieve immune reconstruction [1]. This suggests that other factors apart from viral replication may contribute to the progression of HIV infection.
The human gut microbiota is composed of 500–1000 known species and 100 trillion bacteria, with a total number of genes over 100 times that of the host [2]. In recent years, several studies have demonstrated the correlation between HIV infection and changes in the gut microbiota and its metabolites [3–5]. Additional research has revealed that the intestinal mucosa is the primary site for the propagation of early HIV infection. Within 2–3 weeks of infection, HIV can rapidly and selectively deplete CD4+ T cells in the intestinal mucosa [6]. HIV infection can also induce a substantial amount of intestinal cell apoptosis, reduce tight junction protein expression, and increase intestinal permeability [7]. The loss of CD4+ T cells and the impairment of intestinal epithelial integrity lead to the translocation of bacteria and their metabolites from the intestinal lumen into the circulatory system [8]. This translocation can activate the host immune system, causing significant inflammation, which in turn promotes the depletion of CD4+ T cells, ultimately leading to accelerated disease progression [9]. As HIV infection progresses to the AIDS stage, patients with weakened immune systems are susceptible to various concurrent illnesses, including tuberculosis, Kaposi's sarcoma, and lymphoma, ultimately resulting in death. Therefore, identifying factors that contribute to the progression of HIV infection and implementing targeted treatment is crucial to improve the prognosis.
Machine learning is a major branch of artificial intelligence that aims to enable computer systems to acquire knowledge and experience from data using algorithms and models and utilize this knowledge and experience for autonomous learning, prediction, and decision-making. Machine learning models based on gut microbiota have been shown to identify microbial biomarkers associated with cardiovascular disease [10], inflammatory bowel disease [11], and other illnesses. However, few studies are using machine learning to identify intestinal microbiota biomarkers related to AIDS. In the context of HIV infection, the relationship between gut microbiota, host immunity, and metabolism still needs to be further explored.
Here, we explored the applicability of machine learning models in identifying key gut microbiota related to AIDS. Furthermore, we linked the key bacteria in the models with CD4+ T cell count, CD4+ T cell activation, plasma bacterial translocation, gut metabolites, and Kyoto Encyclopedia of Genes and Genomes (KEGG) functional pathways during the AIDS stage, to identify the potential mechanisms by which the gut microbiota and the human immune system interact.
Materials and methods Individual recruitment and sample collectionWe performed a cross-sectional study from July 2018 to December 2022, recruiting PWH from the Fourth People's Hospital of Nanning (Nanning, Guangxi, China) as research participants. We excluded individuals with the following factors that may affect gut microbiota: hypertension, diabetes, coronary heart disease, chronic kidney disease, and pregnancy. According to the Chinese guidelines for the diagnosis and treatment of HIV/AIDS [12], the individuals were divided into PWH in the AIDS and non-AIDS stages. We collected demographic information, clinical information, blood samples, and stool samples from the PWH. Blood samples were collected using blood collection vessels containing EDTA anticoagulants (BD Vacutainer, USA). Stool samples were collected using a tube containing stool DNA stabilizers (STRATEC stool collection tubes with stool DNA stabilizer, Germany), which can cleave and release DNA from stool microbiota and maintain DNA stability at room temperature for three months. In general, stool samples were transported to the laboratory under ice bath within 6 h of collection and then frozen at -80°C. On the day of sample collection, the plasma and peripheral blood mononuclear cells (PBMCs) were isolated by centrifugation and then cryopreserved at -80°C. Every 3 months, a batch of stool samples was transported using dry ice to the Majorbio BioPharm Technology Co., Ltd., Shanghai, China for 16S ribosomal RNA sequencing, and then to the Suzhou Bionovegene Co., Ltd., Jiangsu, China for metabolite testing in order to avoid technical and operational differences caused by multiple experiments. Before detection, frozen plasma and stool samples were slowly thawed on ice, while frozen PBMCs were quickly thawed in a 37°C water bath.
Gut microbiota 16S ribosomal RNA sequencing and analysisStool samples were extracted using the E.Z.N.A. soil DNA kit (Omega Bio-tek, Norcross, Georgia, USA). Then, 338F (5’-ACTCCTACGGGAGGCAGCAG-3’) and 806R (5’-GGACTACHVGGGTWTCTAAT-3’) were used for PCR amplification of 16S rRNA gene V3-V4 variable region. The amplified PCR products were recovered, purified, and quantified. NEXTFLEX Rapid DNA-Seq Kit was used to build the library. Illumina's Miseq PE300 platform was used for sequencing to obtain paired sequences. The Fastp software for quality control of the original sequencing data and then imported the sequences into QIIME 2 (version 2021.11) [13] for splicing and processing. We performed quality filtering of raw sequences by using the q2-demux plugin, followed by DADA2 [14] (via q2-dada2) for denoising and generation of amplicon sequence variants (ASV) table. We used the Silva-138 99% OTU reference sequences and the q2-feature-classifier [15] plugin for species annotation of ASV. On the basis of the microbial sequence and ASV table, we used PICRUSt2 [16] to predict KEGG functional pathways and generate a table of relative functional abundances.
We imported the generated ASV tables into R 4.2.2 software (R Foundation & R Development Core Team) and used the microeco package to normalize the features and to calculate microbial α-diversity and β-diversity. The α-diversity indexes include community richness indexes (observed, Chao1, and ACE), the community diversity and evenness indexes (Fisher, Shannon, Simpson, and Invsimpson), and the phylogenetic diversity index (PD). We used β diversity algorithms to analyze the composition structure of sample communities, including unweighted and weighted unifrac principal coordinate analysis (PCoA).
Detection and analysis of gut metabolites with liquid chromatography–mass spectrometryLiquid chromatography–mass spectrometry (LC-MS) with the UltiMate 3000 LC system (Thermo Fisher Scientific, Rockford, Illinois, USA) and the Q Active Focus mass spectrometer (Thermo Fisher Scientific) were used for stool metabolite detection. We converted the raw data into the mzXML format through the Proteowizard software (v3. 0.8789), and we used the xcms package in R for peak identification, filtering, and alignment to obtain the data matrix of different characteristic peaks with mass-to-nuclear ratio (m/z), the retention time, and intensity. We normalized the peak area of the data matrix in batches so that we could compare data of different orders of magnitude. Then, we deleted features in QC samples with a relative standard deviation less than 30%. Finally, we used the HumanMetabolome Database (http://www.hmdb.ca), LipidMaps (http://www.lipidmaps.org), Metlin (http://metlin.scripps.edu), massbank (http://www.massbank.jp/), mzclound (https://www.mzcloud.org), and BioNovoGene's standard database to annotate metabolites.
Detection of CD4+ T cell activation indicatorsAfter resuscitation and washing PBMCs, we used the Fc blocker to block the nonspecific binding of cell receptors and antibodies. We treated PBMCs with the following antibodies: PerCP-Cy5.5 mouse antihuman CD3, BB515 mouse antihuman CD4, APC mouse antihuman CD38, and PE mouse antihuman HLA-DR (all from BD Biosciences. Becton, Dickinson and Company, San Jose, California, USA). We determined the proportion of CD38 and HLA-DR expressed on CD4+ T cells by using the CytoFLEX apparatus (Beckman Coulter, Brea, California, USA).
Detection of plasma bacterial translocation indicatorsWe used commercially available ELISA to detect gut microbiota translocation indicators, namely EndoCAb IgG (Hycult Biotech, Uden, The Netherlands), sCD14 (R&D Systems, Inc., Minneapolis, Minnesota, USA), and EndoCAb IgM (Hycult Biotech) in the plasma of individuals. We conducted the experiments according to the standardized protocols provided by the manufacturers.
Machine learning strategy used to identify key gut microbiota associated with AIDSWe used the microbiological feature screening tool linear discriminant analysis effect size (LEfSe, linear discriminant analysis [LDA] score > 2, P < 0.05) in the microco package to identify the differential bacteria (ASV) between groups and then used the machine learning models for further screening. The caret package in R was used to build and evaluate machine learning models. We considered 12 models related to kernel learning (support vector machine [SVM] [17]), ensemble (random forest [RF] [18] and extreme gradient boosting [XGB] [19]), instance-based (k-nearest neighbor [KNN] [20]), regulation (logistic regression [LR] [21]), Bayesian (naiveBayes [NB] [22]), decision tree [DT] [23], neural networks [NNET] [24], rule system (single rule classification [SRC] [25]), dimensional reduction (mixture discriminant analysis [MDA] [26]), deep learning (stacked autoencoder deep neural network [SADNN] [27]), and regulation (sparse distance weighted discrimination [SDWD] [28]) algorithms to train the differential ASV table. We randomly divided the ASV tables into training and test datasets in a 7 : 3 ratio before training. We evaluated the training effects of different machine learning models by using 10-fold cross-validation, and we repeated the process 10 times to obtain optimal parametric modeling. We evaluated the performance of the models in the test dataset from three perspectives [29]: differentiation (area under the curve [AUC], sensitivity, and specificity), calibration (Brier score), and clinical practicability (decision curve analysis [DCA]). The varImp function was used to identify the top 15 important ASV features in the machine learning models.
Statistical analysisWe used LEfSe (LDA > 2, P < 0.05) to identify gut metabolites and KEGG functional pathways with statistical differences between groups. We used the UpSetR package in R to identify shared important ASV features in multiple machine learning models.
For data that meet normality, we described them using the mean ± standard deviation and analyzed using the Student's t test. For data that did not meet normality, we described them using median (interquartile range) and analyzed using the Mann--Whitney U test. For count data, we describe them using the number of cases and analyzed using the Chi-square test. For data that meet normality, we calculated the Pearson correlation coefficients between indicators. For data that did not meet normality, we calculated the Spearman correlation coefficients between indicators. For all analyses, we considered P value less than 0.05 to be statistically significant.
The above statistical analysis was performed by R 4.2.2 software (R Foundation & R Development Core Team). We plotted the correlation network of ASV features with immune indices, gut metabolites, and KEGG functional pathways by using Cytoscape 3.7.1 software (Cytoscape Consortium).
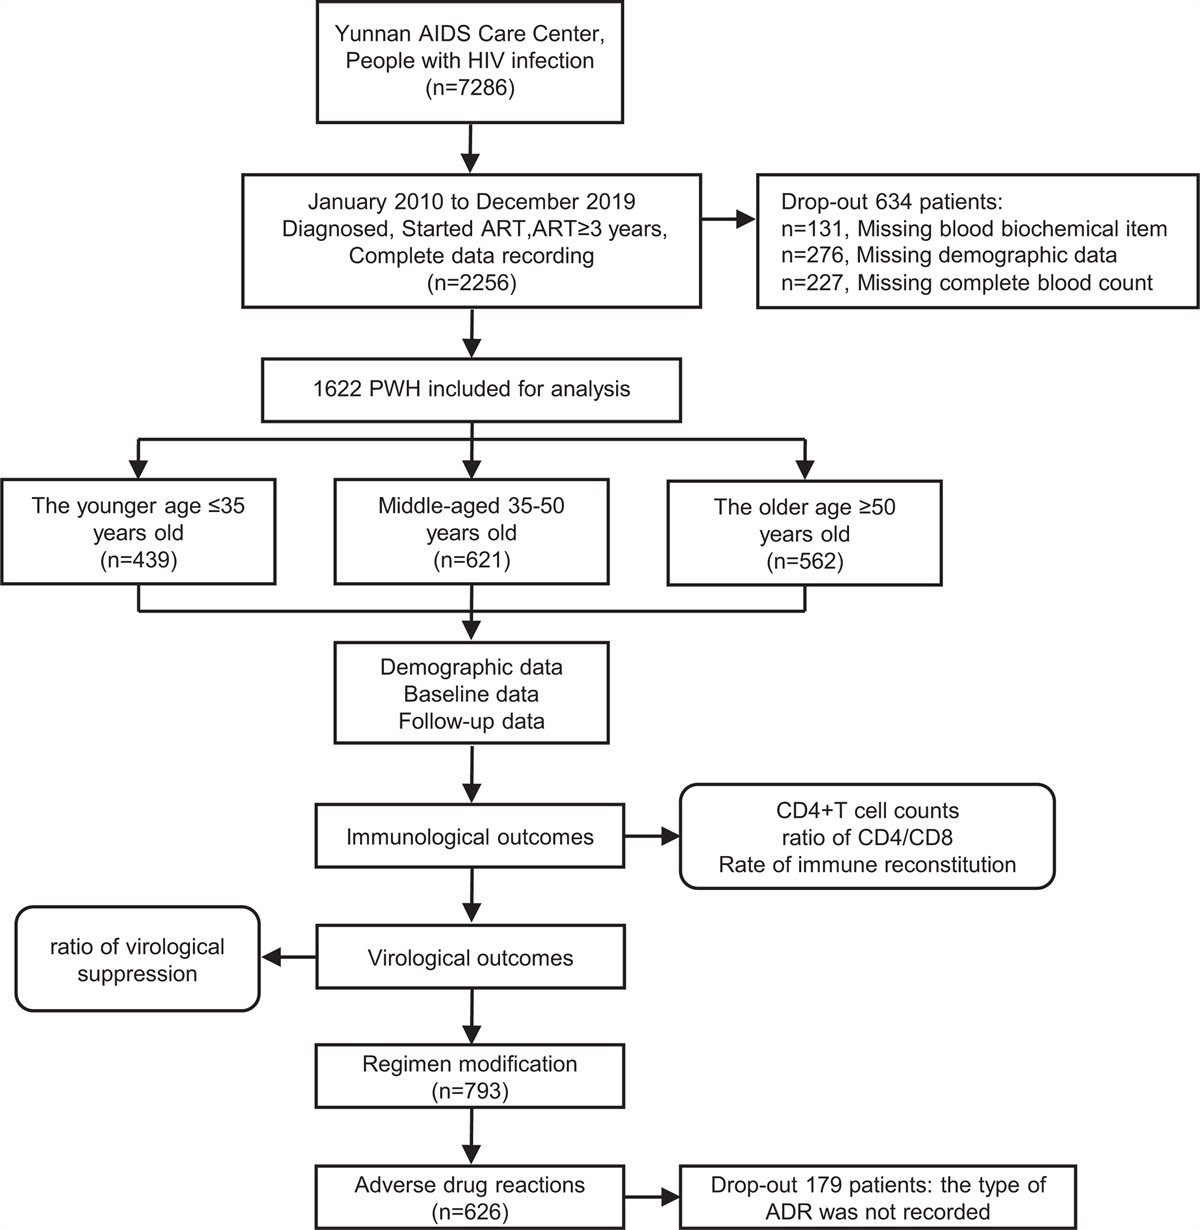
Results Significant differences in gut microbiota diversity between people with HIV in the AIDS and non-AIDS stageSupplementary Figure 1, https://links.lww.com/QAD/D76 shows the research process. We recruited 317 individuals, including 114 PWH in the AIDS stage and 203 PWH in the AIDS stage. There were significant differences in age, sex, sexual orientation (MSM or non-MSM), and the CD4+ T cell count between the groups (P < 0.05, Supplementary Table 1, https://links.lww.com/QAD/D77), but there was no significant difference in BMI (P = 0.06, Supplementary Table 1, https://links.lww.com/QAD/D77) and ART (P = 0.069, Supplementary Table 1, https://links.lww.com/QAD/D77). The total number of clean reads obtained from 16S rRNA sequencing was 32 062 422, with a median of 50 686 (44 664, 56 485). We obtained 7665 ASV features. The total feature frequency was 11 968 791, with a median of 38 254 (31 558, 44 379). At the ASV level, which represents the minimum taxonomic level of bacteria, the gut microbiota α-diversity of PWH in the AIDS stage was significantly lower than that of PWH in the non-AIDS stage (P < 0.05; Supplementary Table 1, https://links.lww.com/QAD/D77; Fig. 1a, b). In addition, there was a significant difference in β-diversity between the groups (P < 0.05; Fig. 1c, d).
 Fig. 1:
 The results of gut microbiota diversity analysis.
Machine learning models have high clinical practicality for identifying AIDS-related key gut microbiotaMachine learning models with superior performance help identify key gut microbiota. Constructing high performance machine learning models that can distinguish between PWH in the AIDS and non-AIDS stages is essential for effectively identifying AIDS-related key gut microbiota. First, we employed LEfSe to screen the ASV features of PWH in the AIDS and non-AIDS stages. We screened 141 different ASV according to LDA more than 2 and P value less than 0.05 (Supplementary Table 2, https://links.lww.com/QAD/D77). The modeling results based on the 141 different ASV showed that RF (AUC = 0.802, sensitivity = 0.922, specificity = 0.594, Brier score = 0.163), SDWD (AUC = 0.837, sensitivity = 0.828, specificity = 0.781, Brier score = 0.192), and DT (AUC = 0.743, sensitivity = 0.891, specificity = 0.531, Brier score = 0.174) were the top three models (Supplementary Table 3, https://links.lww.com/QAD/D77). Only the SDWD model had an AUC, sensitivity, and specificity greater than 0.7, and the specificity of 10 models was less than 0.7 (Supplementary Table 3, https://links.lww.com/QAD/D77). Therefore, we refined our modeling by using 87 ASV features with LDA more than 2.5 and P value less than 0.05. The AUC, sensitivity, and specificity of the RF, NB, and NNET models were greater than 0.7 (Supplementary Table 3, https://links.lww.com/QAD/D77). When we used 34 features with LDA more than 3 and P value less than 0.05 for modeling, the AUC, sensitivity, and specificity of the SVM, RF, LR, NB, DT, XGB, and SDWD models were greater than 0.7. The LR (AUC = 0.854, sensitivity = 0.813, specificity = 0.813, Brier score = 0.160), SVM (AUC = 0.825, sensitivity = 0.766, specificity = 0.844, Brier score = 0.167), and RF (AUC = 0.825, sensitivity = 0.750, specificity = 0.813, Brier score = 0.168) models showed the best classification performance (Table 1; Supplementary Table 3, https://links.lww.com/QAD/D77; Fig. 2a). The results graph of DCA shows that the areas of the LR, SVM, and RF models were higher than those of the other models (Fig. 2b). Further modeling with 10 ASV features with LDA more than 3.5 and P value less than 0.05 did not improve the performance of the models. Considering that too few features may result in insufficient model fitting, we did not continue the model exploration by reducing the number of features.
Table 1 - The classification performance of the machine learning models. AUC Sensitivity Specificity Brier scores Differential ASV with LDA > 3 and P < 0.05 were used for modeling SVM 0.825 0.766 0.844 0.167 RF 0.825 0.750 0.813 0.168 KNN 0.761 0.625 0.844 0.218 LR 0.854 0.813 0.813 0.160 NB 0.782 0.750 0.781 0.448 DT 0.785 0.750 0.719 0.176 NNET 0.728 0.656 0.688 0.189 XGB 0.811 0.797 0.719 0.168 SRC 0.625 0.969 0.281 0.448 MDA 0.773 0.688 0.844 0.176 SADNN 0.516 0.781 0.250 0.189 SDWD 0.826 0.719 0.844 0.168 Differential ASV with LDA > 3 and P < 0.05 were used for modeling, and potential confounding factors were considered SVM 0.818 0.688 0.875 0.159 RF 0.832 0.859 0.719 0.154 KNN 0.777 0.688 0.844 0.210 LR 0.842 0.875 0.688 0.160 NB 0.748 0.719 0.813 0.448 DT 0.844 0.781 0.844 0.142 NNET 0.748 0.828 0.563 0.187 XGB 0.820 0.844 0.719 0.161 SRC 0.562 0.781 0.344 0.448 MDA Unable to model SADNN 0.547 0.469 0.438 0.187 SDWD 0.799 0.641 0.906 0.161 Fig. 2:
 The classification performance and clinical practicability of the machine learning models, based on 34 ASV features with LDA more than 3 and P value less than 0.05.
Age, sex, and sexual orientation were potential influencing factors of the machine learning models. Therefore, we included these factors in the models when LDA more than 3 and P value less than 0.05 to evaluate their impact. The AUC, sensitivity, and specificity of the RF, NB, DT, and XGB models were still higher than 0.7. The AUC of the RF model increased from 0.825 to 0.832. The AUC of the LR model decreased from 0.854 to 0.842. The sensitivity of the RF and LR models increased to 0.859 and 0.875, respectively, while the specificity decreased to 0.719 and 0.688, respectively. The Brier scores of the RF models decreased to 0.154 (Table 1).
We extracted the top 15 ASV features in the LR, RF, and XGB models (Fig. 3a–c). The high abundance features ASV1, ASV8, ASV30, ASV37, and ASV41 represented the intersection of the three models and were significantly downregulated in PWH in the AIDS stage (P < 0.05; Fig. 3d–i). After NCBI BLAST, we determined that ASV1 and ASV37 belong to Bacteroides sp., ASV8 belongs to Fusobacterium sp., ASV30 belongs to Roseburia sp., and ASV41 belongs to Lactobacillus sp. (Supplementary Table 4, https://links.lww.com/QAD/D77).
 Fig. 3:
 Identification of key ASV features associated with AIDS in the machine learning models.
Five downregulated gut bacteria in the AIDS stage might regulate the human immune response through metabolitesWe tested the CD4+ T cell activation indices (CD38 and HLA-DR), plasma microbial translocation indices (EndoCAb IgG, EndoCAb IgM, and sCD14), and gut metabolites of 40 PWH in the AIDS stage and 40 PWH in the non-AIDS stage. There were no significant differences between the groups regarding age, gender, sexual orientation, BMI, and ART (P > 0.05; Supplementary Table 5, https://links.lww.com/QAD/D77). Significant upregulation of CD3+CD4+CD38+ T cells, CD3+CD4+HLA-DR+ T cells, CD3+CD4+CD38+HLA-DR+ T cells, and sCD14 (P < 0.05), and significant downregulation of EndoCAb IgM (P = 0.005) were related to the AIDS status. There was no significant difference in EndoCAb IgG (P = 0.456) between the groups (Supplementary Table 5, https://links.lww.com/QAD/D77). Eighteen kinds of gut metabolites, such as spermidine, prephenate, and gentamicin C1a, were significantly different between PWH in the AIDS stage and non-AIDS stage (P < 0.05; Supplementary Table 6, https://links.lww.com/QAD/D77). In addition, 55 KEGG functional pathways such as transporters [BR:ko02000], ABC transporters [PATH:ko02010], and two-component systems [PATH:ko02020] were significantly different between the groups (P < 0.05; Supplementary Table 7, https://links.lww.com/QAD/D77).
We further explored the correlation of the five key bacteria in the machine learning models with immune indices, differentially expressed gut metabolites, and KEGG functional pathways predicted based on gut microbiota sequences. Significantly downregulated ASV1, ASV8, ASV30, ASV37, and ASV41 in the AIDS stage were positively correlated with the CD4+ T cell count and EndoCAb IgM, and negatively correlated with CD3+CD4+HLA-DR+ T cell count, the CD3+CD4+CD38+HLA-DR+ T cell count, and the sCD14 level. The abundance of the five key bacteria was significantly positively correlated with 4-hydroxyphenylpyruvic acid (P < 0.05). ASV30 and ASV41 were also significantly positively correlated with seven metabolites, including xanthine, hypoxanthine, and spermidine (P < 0.05). Regarding KEGG functional pathways, the abundance of the five key bacteria was positively correlated with the cell growth pathway. ASV1, ASV8, and ASV37 were significantly positively correlated with 30 pathways (P < 0.05) including alanine, aspartate, and glutamate metabolism [PATH:ko00250] and amino acid-related enzymes [BR:ko01007]. ASV30 and ASV41 were significantly negatively correlated with ascorbate and aldarate metabolism [PATH:ko00053] and antimicrobial resistance genes [BR:ko01504] (P < 0.05; Fig. 4a--e, Supplementary Table 8, https://links.lww.com/QAD/D77).
 Fig. 4:
 Correlation network diagrams of ASV1 (Bacteroides sp., a), ASV8 (Fusobacterium sp., b), ASV30 (Roseburia sp., c), ASV37 (Bacteroides sp., d), and ASV41 (Lactobacillus sp., e) with immune indices, gut metabolites, and KEGG functional pathways.
DiscussionIn 2021, there were 38.4 million (33.9–43.8 million) PWH and 650 000 (510 000–860 000) people died from AIDS-related illnesses worldwide [30]. The whole course of HIV infection can be divided into three stages: the acute stage, the asymptomatic stage, and the AIDS stage. Among them, AIDS is the final stage after HIV infection. Most patients had CD4+ T cell counts less than 200 cells/μl. During this period, patients are susceptible to death due to multiple opportunistic infections and tumors [12]. Therefore, identifying factors that contribute to the progression of HIV infection and implementing targeted treatment are crucial to improving the prognosis. There is increasing evidence that HIV infection is associated with gut microbiota dysbiosis [31–36]. Our previous research, based on a small population, confirmed that changes in gut microbiota diversity are related to HIV infection, particularly during the AIDS stage [37]. Here, with the largest horizontal study to date, we have further substantiated that the AIDS stage is associated with more severe gut microbiota dysbiosis. In addition, previous studies have revealed that there is also dysbiosis of the oral [38] and pulmonary [39] microbiota of PWH in the AIDS stage. On the basis of these findings, we used machine learning algorithms to further explore the relationship between the gut microbiota and PWH in the AIDS stage.
Machine learning techniques have been widely applied in the field of gut microbiota. Machine learning can process and analyze large-scale gut microbiota data, identify the composition of different species and communities, evaluate the diversity and stability of the microbiota, and discover microbial features associated with human health and diseases. In addition, machine learning can also help construct predictive models for predicting individual gut microbiota status, response to specific intervention measures, disease risk, and so on. For example, machine learning models have been applied to identify gut microbiota biomarkers for Vibrio cholerae infection [40] and liver cirrhosis [41]. The application of machine learning in identifying gut microbiota features related to HIV infection has also been reported [42]. However, there is limited research specifically targeting the AIDS stage. Therefore, we explored the clinical practicality of machine learning in identifying key gut microbiota related to AIDS. To efficiently identify key gut microbiota related to AIDS, it is necessary to screen and fit numerous machine learning algorithms and microbial features to build high-performance AIDS diagnostic models. Here, we have conducted tests on 12 classical machine learning algorithms that have different core principles in data processing, including SVM for classification utilizing kernel functions and the maximum margin principle [17]; RF that builds multiple decision trees and performs ensemble learning [18]; XGB that iteratively trains decision trees and combines them[19]; KNN for classification based on instances [20]; LR that performs classification by fitting a logistic function [21]; NB that classifies by calculating posterior probabilities based on the assumption of feature independence and Bayesian theorem [22]; DT that performs classification using feature selection and tree construction [23]; NNET that simulates the connection and information transmission among biological neurons for classification[24]; SRC that classifies based on mining concise individual rules; MDA that classifies different classes of data by establishing multiple mixed components [26]; SADNN that learns features of data layer by layer through the stacking of multiple autoencoders for classification [27]; and SDWD that enhances the discriminative power of the classifier through sparsity and distance weighting [28]. Given that the ASV table has too many features or that some of the features may not be related to disease status, it may be so complex as to result in poor or overfitting. We used LEfSe, a tool that can identify microbial features, for feature screening. The abundance of more than 100 kinds of ASV changed in the AIDS stage. The SDWD model based on all the ASV features with LDA score more than 2 showed better diagnostic performance than the other models. SDWD algorithm is an improvement of Distance Weighted Discrimination (DWD) algorithm, which is suitable for processing high-dimensional datasets with a large number of features or attributes. Compared to DWD, SDWD introduces sparsity constraints, making it more resistant to interference, noise, or abnormal situations [28]. SVM is also applicable to high-dimensional data with a small sample size, but it is less adaptable to imbalanced datasets (nAIDS = 114, nnonAIDS = 203) than SDWD, which takes sample weights into account [17,28]. However, the specificity of all our models did not reach 0.8, indicating the presence of low-correlation features within the models, which may diminish their performance. The LDA score in LEfSe analysis is used to reflect the influence of species with significant differences between groups. We further screened the ASV features by improving the LDA score. When we reduced the number of features to 34, the classification performance of several models was improved greatly. Among them, the AUC of LR reached 0.854. This may be due to a decrease in the number of ASVs and a decrease in complex relationships in the data. The relatively simple model form of LR is more suitable for this type of data, that is, LR assumes that there is a certain relationship between input features and output after linear combination. When the data are approximately linearly separable or has a certain linear relationship in the feature space, LR can better fit this relationship, thus obtaining a higher AUC [21]. Nevertheless, when only 10 features were included, the models’ performance degraded, probably because these features did not describe the data well enough. It is also important to consider that gender [43], age [44], and sexual orientation [45] are confounding factors in human microbiota research. In the first part of the study, we did not match these factors between PWH in the AIDS and non-AIDS stages. Therefore, we evaluated the change in model performance with and without these confounding factors. We found that these factors did not significantly change the performance of our models. These results confirm that the gut microbiota combined with machine learning could identify PWH in the AIDS stage. However, the AUC of the optimal model was 0.854, indicating that the performance of the models could still be improved by expanding the sample size or by adopting deep sequencing. More importantly, we can observe that machine learning is limited to making predictions and inferences within the domain covered by its training data. The accuracy of these predictions depends on the quality, diversity, and quantity of the training data, while the interpretability of the prediction results depends on the researcher's understanding of the data features and algorithm principles. These situations pose challenges for further application of machine learning to solve real-world problems.
Using machine learning, we found that the abundance of ASV1 (Bacteroides sp.), ASV8 (Fusobacterium sp.), ASV30 (Roseburia sp.), ASV37 (Bacteroides sp.), and ASV41 (Lactobacillus sp.) was significantly downregulated in the AIDS stage. The abundance of these bacteria was correlated positively with the CD4+ T cell count and the EndoCAb IgM level; but correlated negatively with the activation of CD4+ T cells and the sCD14 level. We explored the potential mechanism by detecting the gut microbiota metabolites and predicting the KEGG functional pathways based on gut microbiota sequences. We found that the five aforementioned bacteria were positively correlated with the gut microbiota metabolite 4-hydroxyphenylpyruvic acid and the cell growth pathway. A study related to diabetes also showed that dysbiosis of gut Roseburia and Lactobacillus is accompanied by a change in gut 4-hydroxyphenylpyruvic acid [46]. Another study showed that 4-hydroxyphenylpyruvic acid is an antifungal compound that can be produced during the growth of Lactobacillus sp. SK007 [47]. A recent study found that Cordyceps sinensis polysaccharide can alleviate cyclophosphamide-induced intestinal mucosal immunosuppression and microbial dysbiosis in mice by promoting the secretion of cytokines (including interleukin 2 [IL-2], IL-4, and IL-6), and by upregulating the abundance of Lactobacillus, Bifidobacterium, and Bacteroides[48]. IL-2 is an important cytokine that can promote the growth, proliferation, and differentiation of lymphocytes. Therefore, we speculated that the reduction of these five key bacteria in the AIDS stage leads to the reduction of their metabolites such as 4-hydroxyphenylpyruvic acid, which leads to the reduction of CD4+ T cells through cell growth or other pathways. In addition, in a pilot double-blind study, 30 PWH were treated with fecal microbiota transplantation (FMT) for 8 weeks. FMT for PWH is well tolerated, not related to severe adverse events, and attenuates HIV-associated dysbiosis. Notably, donors in this study were characterized by a higher quartile of fecal Bacteroides and Faecalibacterium abundance and butyrate concentrations, and lower Prevotella abundance [49]. This further suggests that we have found the potential interaction between the gut microbiota and the host immune system, and this approach may provide potential biomarkers for improving the prognosis of PWH in the AIDS stage. However, the role of these key bacteria proposed in this study needs further validation through experimental studies including in-vitro and animal experiments.
Our research still has the following limitations. In this study, PWH in the non-AIDS stage tested positive for HIV antibodies and met the diagnostic criteria for the asymptomatic stage. However, due to the lack of screening for acute infection status in the non-AIDS group, we cannot confirm that the non-AIDS group consists entirely of asymptomatic HIV-infected individuals. Individuals with acute HIV infection often exhibit mild symptoms, and due to the presence of the “window period,” HIV antibodies are difficult to detect. However, there have been studies that detected HIV antibodies in a small proportion of individuals with acute HIV infection [50,51].
In conclusion, we have confirmed that the AIDS stage is accompanied by more serious gut microbiota dysbiosis. Machine learning models could be used to identify key gut microbiota associated with AIDS. The decreased abundance of ASV1 (Bacteroides sp.), ASV8 (Fusobacterium sp.), ASV30 (Roseburia sp.), ASV37 (Bacteroides sp.), and ASV41 (Lactobacillus sp.) in the AIDS stage might be related to the reduced CD4+ T cell count and immune activation in the AIDS stage.
AcknowledgementsJ. H., L. Y., and H. L. participated in the design of the study protocol. J. Z., Y. Y., Z. X., D. L., J. H., L. L., B. G., X. Y., Q. W., Z. L., Y. Z., X. Y., S. A., N. L., and P. C. participated in data collection. J. Z., Y. Y., Z. X., and D. L. performed data management and statistical analyses. J. Z., Y. Y., and J. H. wrote the first manuscript draft. All authors participated in the interpretation of the data, writing of the final manuscript, and approval of the final manuscript.
This work was supported by the National Natural Science Foundation of China (NSFC, 82060366, 82273694) and the Innovation Project of Guangxi Graduate Education (No. YCBZ2022098).
All participants were informed about the study's purpose and the confidentiality of the investigation, and they provided their consent by signing an informed consent form.
The study was approved by the ethics committee of Guangxi Medical University (Approval number: 20160302-6 and 20200095).
The datasets presented in this study can be found in online repositories. The names of the repository/repositories and accession number(s) can be found below: NCBI SRA database, serial number: PRJNA952811. The information for each sample can be found in Supplementary Table 9, https://links.lww.com/QAD/D78.
Conflicts of interestThere are no conflicts of interest.
References 1. Gupta RK, Peppa D, Hill AL, Galvez C, Salgado M, Pace M, et al. Evidence for HIV-1 cure after CCR5 Delta 32/Delta 32 allogeneic haemopoietic stem-cell transplantation 30 months post analytical treatment interruption: a case report. Lancet HIV 2020; 7:E340–E347. 2. Sommer F, Backhed F. The gut microbiota--masters of host development and physiology. Nat Rev Microbiol 2013; 11:227–238. 3. Vazquez-Castellanos JF, Serrano-Villar S, Jimenez-Hernandez N, del Rio MDS, Gayo S, Rojo D, et al. Interplay between gut microbiota metabolism and inflammation in HIV infection. ISME J 2018; 12:1964–1976.
留言 (0)