
記住我


Approximately half of people with HIV (PWH) in the United States are over the age of 50 years [1], and continued improvements in the efficacy and tolerability of antiretroviral therapies (ART) have enabled PWH to live longer with their HIV diagnosis [2]. Despite advancements in treatment, PWH may experience rapid biological aging because of both the immune control needed to suppress the HIV virus and the effects of ART regimens [3]. Consequently, PWH may have a more advanced biological age than chronologic age [4], and this discrepancy may exceed that observed among people without HIV [5]. Concerningly, this advanced rate of biological aging is also associated with a greater prevalence of noncommunicable diseases including cardiovascular disease, liver disease, and renal disease at younger ages among PWH than among people without HIV [4]. As treatment of HIV continues to advance thereby affording greater longevity for PWH, some estimate that by 2035, 44% of older adults with HIV will have three or more noncommunicable diseases and that treatment of these noncommunicable diseases will comprise 56% of total direct HIV care expenditures [6].
One noncommunicable disease of pressing concern is kidney disease. Chronic and end-stage kidney disease (ESKD) are leading comorbidities among PWH who may experience increased risk because of HIV viremia, nephrotoxic ART regimens, history of substance use, or co-infection with hepatitis C virus [7,8]. Although PWH experience increased risk of chronic kidney disease and rapid progression to ESKD [9,10], they are less likely to receive a kidney transplant than people without HIV [11]. This inequity persists despite the cost-effectiveness and the improved survival afforded by kidney transplantation in comparison to dialysis. Beyond lower likelihood of transplantation, PWH are also less likely to initiate the process of receiving a deceased donor kidney transplant as they experience lower likelihood of referral, evaluation, and waitlisting for transplant [12–15], which are all mandated steps in the deceased donor transplant process. Treatment of ESKD with dialysis costs Medicare and private insurers approximately $40 000 and $120 000, respectively per ESKD patient annually [16], and mortality on dialysis ranges from 5 to 15% annually [17]. This suggests that the lower rate of transplantation among PWH is associated with significant economic costs and increased mortality.
The barriers to waitlist addition and to subsequent transplantation for PWH are multifactorial and range from microlevels to macrolevels as illustrated by Socio-Ecological Model for Transplant [18]. PWH must meet all standard transplant eligibility criteria in addition to HIV-specific criteria such as undetectable HIV viral loads, CD4+ counts greater than 200 cells/ml, and the absence of opportunistic infections [19]. Individual-level factors commonly attributed to the observed disparity include the racial composition of the HIV epidemic [14], the prevalence of substance use [13], undernutrition [20], frailty [20], and severity of HIV as defined by HIV viral loads and opportunistic infections [12]. Thus, many hypothesize the convergence of these factors explains disparities in access to the transplant waiting list. Although limited in our ability to examine HIV-specific characteristics given the absence of such data in existing national data sources [21], we sought to determine what proportion of the disparity in waitlist addition for kidney transplantation could be explained by individual demographics, medical characteristics, history of substance use, and geography. We hypothesized that these individual-level characteristics would fail to completely ameliorate the observed disparity in waitlist addition rates between people with and without HIV.
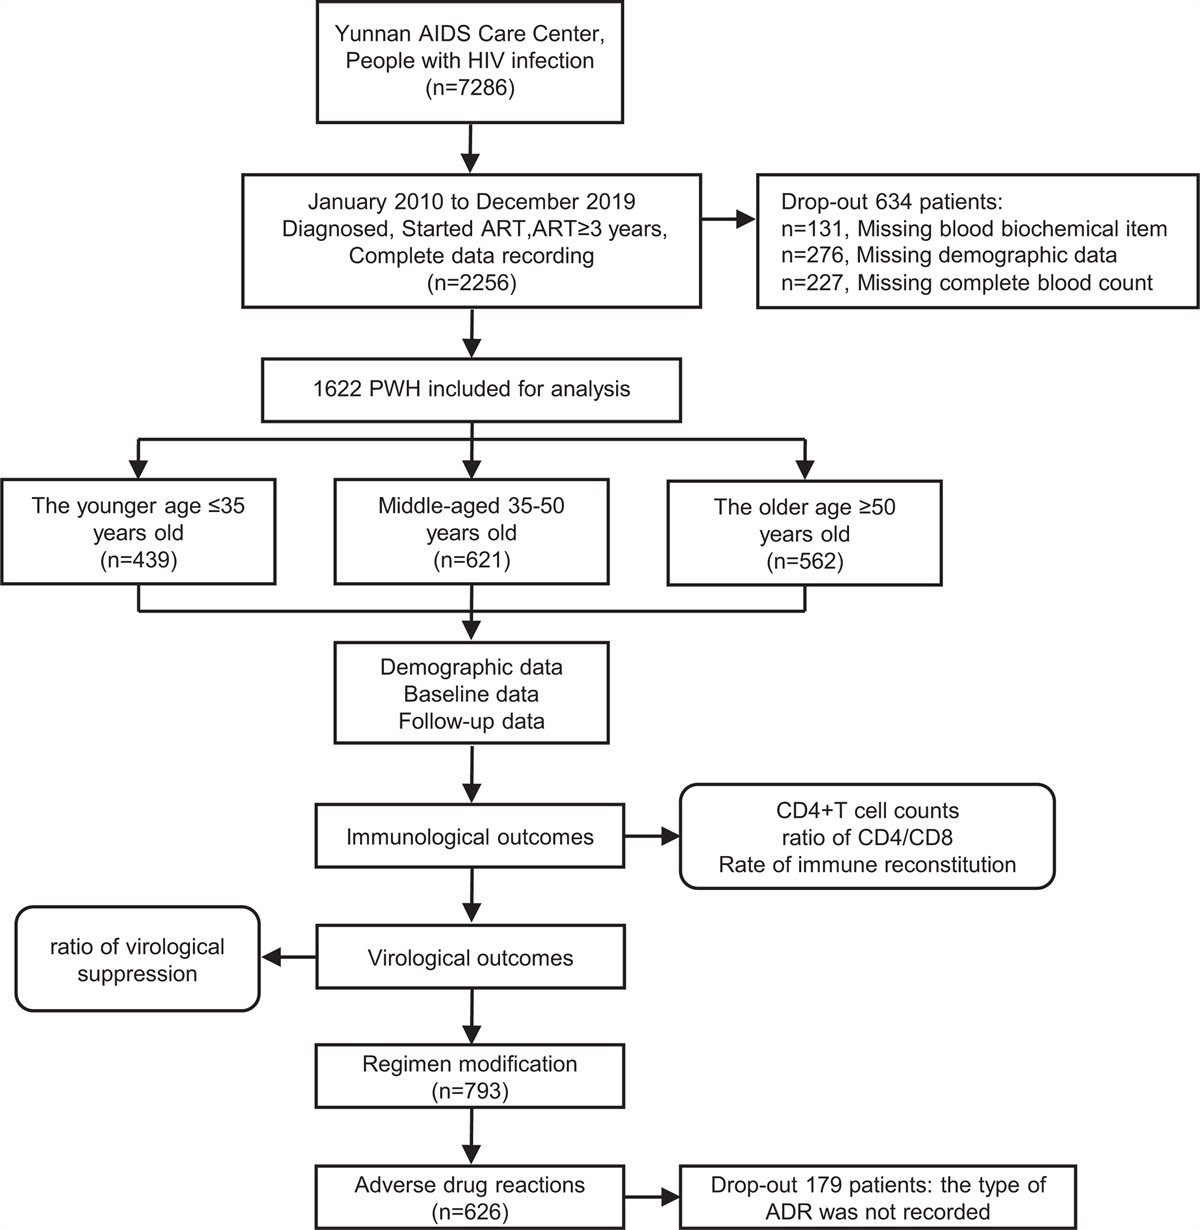
Methods Study populationThis study utilized data from the United States Renal Data System (USRDS), a national database capturing data on all ESKD patients in the United States and their accompanying Medicare claims. Patients were excluded if less than 18 years of age, first initiated dialysis outside of 01 January 02007 to 31 December 2017, were listed for transplant or transplanted prior to dialysis initiation, died, or were removed from dialysis within 90 days of dialysis initiation, or had a payer other than Medicare as their insurance payer.
Exposure of interestHIV-status was defined using the Chronic Conditions Data Warehouse definition, requiring one HIV-specific inpatient claim or two nonscreening outpatient claims within a 2-year period [22]. Given the need for immunosuppressive medications to maintain an organ transplant, HIV-specific criteria for waitlist addition and transplantation exist [23]. Specifically, PWH who have active AIDS or HIV viremia are not eligible for waitlist addition or subsequent transplantation. Importantly, the ability to identify these characteristics within Medicare claims is limited. To approximate these contraindications, while admittedly not fully encapsulating all HIV-specific waitlist criteria, any PWH with a claim for opportunistic infection within 90 days of dialysis initiation were excluded to create a more select cohort of PWH [22].
Outcome ascertainmentThe primary outcome of this analysis was kidney waitlist addition, the earliest nationally available step in the kidney transplant process, which was analyzed using Cox proportional hazards modeling. Patients began contributing time-at-risk once diagnosed with ESKD and continued to do so until waitlist addition, transplantation, death, or administrative end of study. Patients were censored if they died, received a living donor transplant, or were awaiting waitlist addition/transplantation at the administrative end of study (31 December 2018). Robust standard errors were included for dialysis center.
CovariatesPotential explanatory variables were examined in four categories: demographics, medical characteristics, substance use, and geography as captured on the CMS 2728 form. Substance use was defined as tobacco, alcohol, and/or drug dependence, and ascertained through reporting as separate items on the CMS 2728 form. Specifically, individual race, BMI, drug dependence, and rurality were hypothesized to explain substantial proportions of the disparity in waitlist addition between PWH and HIV-negative ESKD patients. A base model for disparity in waitlist addition between PWH and HIV-negative ESKD patients was built, adjusting for HIV status, age at dialysis initiation, year of dialysis initiation, and dialysis center.
Inverse odds ratio weightingTo estimate the proportion of the disparity explained by various patient characteristics, inverse odds ratio weighting was conducted [24,25]. Inverse odds ratio weighting permits decomposition of an observed disparity into explained and unexplained components. First, a logistic model for HIV status was fitted, adjusted for the base model characteristics and the potential explanatory variable, to generate predicted probabilities. The predicted probabilities were subsequently used to calculate inverse odds ratio weights. The total disparity was estimated through the base model, which employed an unweighted Cox proportional hazards model including HIV status and the base model covariates of age, dialysis center, and year of dialysis initiation. The direct effect was calculated through a weighted Cox proportional hazards model that incorporated the inverse odds ratio weights. This direct effect represented the reduction in disparity observed if the observable characteristics were similar between PWH and HIV-negative ESKD patients. Comparison of the total and direct effects permitted calculation of the percentage of the disparity that could be explained by differences in the patient characteristics. Standard errors were calculated via bootstrapping with 1000 replications. As a sensitivity analysis, we replicated these analyses in a cohort of incident ESKD patients from 2012 to 2017.
Statistical analyses were conducted in SAS 9.4 (Cary, North Carolina, USA) and Stata 15.1 (College Station, Texas, USA). All statistical analyses were conducted with two-sided significance at an alpha of less than 0.05.
Results DemographicsIn this cohort, there were 6250 PWH and 595 756 HIV-negative ESKD patients. There were numerous meaningful differences between the two groups (Table 1). PWH were more commonly African American/Black (heretofore referred to as Black) as compared with HIV-negative ESKD patients (70.0 vs. 26.7%, P < 0.001, SD: 0.96). They were less commonly women (31.7 vs. 43.4%, P < 0.001, SD: −0.24) and less commonly Hispanic (12.9 vs. 10%, P < 0.001, SD: −0.11). A significantly higher proportion of PWH had a BMI less than 18.5 kg/m2, corresponding to an underweight status (6.4 vs. 3.1%, P < 0.001, SD: 0.16). There was a higher prevalence of reported drug dependence among PWH as compared with HIV-negative ESKD patients (7.8 vs. 1.0%, P < 0.001, SD: 0.11). Last, PWH less commonly lived in rural areas than HIV-negative ESKD patients (0.9 vs. 3.3%, P < 0.001, SD: −0.17).
Table 1 - Patient-level characteristics by HIV status at time of end-stage kidney disease diagnosis. HIV− HIV+ P value Std. Diff Characteristic N = 595 756 N = 6250 Demographics Age at ESKD diagnosis 65 (55–75) 51 (43–60) <0.001 −0.99 Female 258 260 (43.4) 1982 (31.7) <0.001 −0.24 Race White 402 095 (67.5) 1717 (27.5) <0.001ESKD, end-stage kidney disease.
In the base model, HIV status was associated with 57% lower likelihood of waitlist addition [adjusted hazard ratio (aHR): 0.43, 95% CI: 0.46–0.48, P < 0.001; Table 2]. 32.3% of this observed disparity could be explained by race (aHR: 0.64, 95% CI: 0.59–0.69, P < 0.001). Sex and Hispanic ethnicity independently explained a smaller proportion of the observed disparity (aHR: 0.57, 95% CI: 0.51–0.63, P < 0.001; aHR: 0.59, 95% CI: 0.52–0.62, P < 0.001). When assessing the demographic characteristics of race, sex, and ethnicity simultaneously, 32.6% of the observed disparity in waitlist addition could be explained by these factors (aHR: 0.64, 95% CI: 0.62–0.67, P < 0.001) (Table 3), and the remaining 67.4% of the disparity remained unexplained by demographic characteristics.
Table 2 - Decomposition of disparity in waitlist addition by individual characteristics. aHR (95% CI) for HIV-status Percent attributable Base modela 0.47 (0.46–0.48) – Demographics Sex 0.57 (0.51–0.63) 17.7% Race 0.64 (0.59–0.69) 32.3% Hispanic/Latinx 0.59 (0.56–0.62) 22.0% Medical characteristics BMI 0.59 (0.52–0.68) 23.2% Diabetes 0.60 (0.56–0.64) 23.4% Hypertension 0.59 (0.53–0.67) 22.8% Ischemic heart disease 0.58 (0.54–0.62) 20.3% Myocardial infarction 0.58 (0.50–0.67) 20.4% Cardiac arrest 0.58 (0.53–0.63) 20.4% Dysrhythmia 0.58 (0.53–0.62) 20.4% Pericarditis 0.58 (0.52–0.64) 20.4% Congestive heart failure 0.58 (0.52–0.64) 20.2% Peripheral vascular disease 0.58 (0.53–0.63) 20.6% Cancer 0.58 (0.53–0.65) 21.2% Inambulatory 0.58 (0.51–0.67) 21.0% Amputation 0.58 (0.50–0.68) 21.0% Needs assistance with daily activities 0.58 (0.50–0.680 21.0% Institutionalized 0.59 (0.54–0.64) 22.3% Substance use Alcohol dependence 0.59 (0.50–0.70) 22.4% Drug dependence 0.61 (0.59–0.64) 26.2% Tobacco use 0.61 (0.55–0.67) 25.5% Geography Rural 0.59 (0.53–0.66) 22.3% UNOS Region 0.57 (0.54–0.61) 19.4%Indirect – amount disparity would be reduced if equivalent. aHR, adjusted hazards ratio; CI, confidence interval.
aAdjusted for HIV status, age at dialysis initiation, ESKD diagnosis year, dialysis center.
aHR, adjusted hazards ratio; CI, confidence interval.
aAdjusted for HIV status, age at dialysis initiation, ESKD diagnosis year, dialysis center.
The primary medical characteristic of interest was BMI. Accounting for BMI explained 23.2% of the observed disparity in waitlist addition (aHR: 0.59, 95% CI: 0.52–0.68, P < 0.001; Table 2). Diabetes and hypertension explained 23.4 and 22.8% of the disparity, respectively (aHR: 0.60, 95% CI: 0.54–0.66, P < 0.001; aHR: 0.59, 95% CI: 0.53–0.67, P < 0.001). Examining these medical characteristics together with cardiovascular conditions and functional status explained 24.3% of the observed disparity with the remaining 75.7% unexplained by medical characteristics (aHR: 0.60, 95% CI: 0.55–0.65, P < 0.001; Table 3).
Substance useThe primary substance use characteristic of interest was drug dependence, which accounted for 26.4% of the observed disparity (aHR: 0.61, 95% CI: 0.59–0.64, P < 0.001). Alcohol dependence and tobacco use explained 22.4 and 25.5% of the observed disparity, respectively (aHR: 0.59, 95% CI: 0.50–0.70, P < 0.001; aHR: 0.61, 95% CI: 0.55–0.67, P < 0.001). Moreover, accounting for alcohol use, drug dependence, and tobacco use simultaneously accounted for 28.4% of the observed disparity, and the remaining 71.6% of the disparity was unexplained by characteristics specific to substance use (aHR: 0.62, 95% CI: 0.57–0.68, P < 0.001; Table 3).
GeographyThe primary geographical measure of interest was rurality, which accounted for 22.3% of the observed disparity (aHR: 0.59, 95% CI: 0.53–0.66, P < 0.001; Table 2). United Network for Organ Sharing (UNOS) Region alone explained 19.4% of the disparity (aHR: 0.57, 95% CI: 0.54–0.61, P < 0.001). Examining both UNOS Region and rurality together, geography accounted for 22.4% of the observed disparity, with 78.9% remaining unexplained by characteristics specific to patient geographic location (aHR: 0.59, 95% CI: 0.53–0.64, P < 0.001; Table 3).
Combined domainsTogether, demographics and substance use explained 36.6% of the observed disparity (aHR: 0.67, 95% CI: 0.62–0.72, P < 0.001). The addition of the geography domain to the demographics and substance use domains increased the amount of the disparity explained to 38.6% (aHR: 0.68, 95% CI: 0.62–0.74, P < 0.001). Accounting for the four domains of demographics, medical characteristics, substance use, and geography together explained 39.8% of the observed disparity in waitlist addition between PWH and HIV-negative ESKD patients (aHR: 0.69, 95% CI: 0.59–0.79, P < 0.001; Table 4). The remaining 60.2% of the disparity remained unexplained by these observed characteristics.
Table 4 - Decomposition of disparity by multiple groups of characteristics. aHR (95% CI) for HIV status Percent attributable Base modela 0.47 (0.46–0.48) – Demographics + substance use 0.67 (0.62–0.72) 36.6% Medical comorbidities + substance use 0.64 (0.60–0.68) 31.2% Demographics + substance use + geography 0.68 (0.62–0.74) 38.6% Demographics + medical Characteristics + substance use + geography 0.69 (0.59–0.79) 39.8%aHR, adjusted hazards ratio; CI, confidence interval.
aAdjusted for HIV status, age at dialysis initiation, ESKD diagnosis year, dialysis center.
In this national study of ESKD patients, positive HIV status was associated with significantly lower likelihood of addition to the kidney transplant waitlist. Given the cause of HIV and requirements for waitlist addition, there were multiple factors hypothesized to explain this disparity including race, BMI, and active substance use. Individually, race explained 32.3% of the disparity, and drug dependence explained 26.4% of the disparity, which were the two strongest effects. In totality, accounting for differences in demographics, medical characteristics, substance use, and geography as domains of variables explained a total of 39.8% of the observed disparity, leaving 60.2% of the disparity unexplained by observed characteristics.
Race was the strongest single contributor to the disparity in waitlist addition. Undoubtedly, some of the remaining disparity could be attributable to HIV-specific characteristics, such as viral loads and CD4+ counts, for which we could not account, and the inability to control for these factors likely impacts our inferences with respect to race as documentation of sustained viral suppression and high CD4+ counts are necessary for successful transplant evaluation and subsequent waitlist addition. Black PWH have markedly lower rates of viral suppression and ART adherence than white PWH, and HIV stigma, which interacts with anti-Black racism [26–28], has been implicated in lower rates of viral suppression and ART adherence, critical factors for progressing through the kidney transplant process. Additionally, although some studies have suggested socioeconomic status may explain racial disparities in waitlist addition, among a cohort of ESKD patients in Baltimore, socioeconomic status and comorbidities explained only 58% of inequities in waitlist addition, rendering 42% unexplained.‘ Thus, perceived discrimination, structural racism, and implicit bias also warrant consideration [29]. Factors such as medical mistrust, financial restraints, and scheduling difficulties may also impede completion of transplant evaluation and subsequent waitlist addition among Black ESKD patients [30]. Although multiple interventions have been developed to assist Black ESKD patients throughout the transplant process, these interventions may need tailoring to meet the unique needs of Black PWH whose evaluation process will require greater collaboration between their HIV providers and transplant providers [31–34]. Consequently, greater research into the intersectionality of these two identities, the resulting ability to engage in care, and the need for supportive ESKD care is needed.
Medical characteristics, specifically BMI, and substance use together explained 31.2% of the observed disparity, which is consistent with hypotheses posited by previous studies [13,20]. Low BMI and frailty are both associated with suboptimal patient outcomes among PWH, such as HIV disease progression and mortality, and is also associated with substance use [35,36]. In a cohort of French ESKD patients, substance use was more prevalent among PWH and likely contributed to the observed lower rates of waitlist addition among PWH [20]. Consistent with that study, a recent single-center study in the United States also observed high rates of active substance use, the largest reason for ineligibility for waitlist addition. Nationally, substance use, including tobacco, alcohol, and drug dependence, has been associated with 61% lower likelihood of waitlist addition among all ESKD patients, and active substance use is associated with disproportionately lower rates of waitlist addition when occurring among Black and Hispanic patients [37]. Given center-level desires to maximize patient outcomes, this disparity may reflect provider concerns that patients engaging in substance use are less likely to be adherent to immunosuppressive regimens posttransplant [38], and it is plausible such concerns would be amplified among PWH who must also remain adherent to their ART regimens.
There are multiple omitted factors; however, that may further explain the observed disparities including patient preference, provider knowledge, environmental factors, and policies. Similarly, provider knowledge is associated with waitlist addition rates [39]. Given the relatively recent advent of transplantation in this patient population, it is perhaps possible that increasing provider knowledge about transplantation among PWH, could yield higher referral and waitlisting rates. Numerous studies have demonstrated that facility-level characteristics such as Medicare dialysis facility quality rating, ownership status, and center philosophy impact likelihood of waitlist addition and thus, these characteristics may explain some of the remaining unexplained disparity [40–42]. Nationally, Medicaid expansion has been associated with increased waitlist addition rates and improved survival on dialysis [43,44]. As Medicaid has not yet been expanded in many states in the Southeast region of the United States where HIV and ESKD burdens are greatest, this may be particularly pertinent. Moreover, little is known about the role of HIV criminalization laws or, conversely, nondiscrimination laws for sexual and gender minorities in engagement with care for ESKD. In particularly, HIV criminalization laws may be worthy of study, given their association with increased stigma and decreased medical trust [28,45], critical barriers to participation in the kidney transplant process. These institutional-level and policy-level factors warrant greater study to disentangle their role in creating and exacerbating barriers to waitlist addition for PWH.This study is subject to multiple limitations. Most importantly, we lack access to HIV-specific characteristics such as HIV viral loads, CD4+ counts, and ART regimens, which likely contribute to some of the unexplained disparity. Despite this limitation, numerous studies with access to those data have also found lower rates of waitlist addition that were not mitigated through formation of a more select group of PWH [13,14,20]. Thus, while our findings may be overestimated, they are likely still valid. As this was a retrospective study, we are limited in what characteristics we could consider. Consequently, we could not examine the role of perceived racism, HIV stigma, health literacy, referral patterns, or knowledge of transplant. Because all ESKD patients in this study utilized Medicare as their primary payer, we were unable to use insurance status as a surrogate for socioeconomic status. Thus, future work is needed to capture
social determinants of health including income, employment status, discrimination, and stress. Despite these limitations, this study provides valuable information on the extent to which observed patient demographics, medical characteristics, history of substance use, and geography can explain the observed disparity in waitlist addition between PWH and HIV-negative ESKD patients.
In conclusion, the combination of demographics, medical characteristics, substance use, and geography explained 39.8% of the disparity in waitlist addition between PWH and HIV-negative ESKD patients. As a result, efforts to increase waitlist addition for racial minorities and to address substance use may mitigate some of the disparity between these two groups. Greater work is needed to identify whether characteristics such as viremia, ART adherence, provider referral patterns, racism, and HIV stigma may explain the remaining 60.2% of the disparity.
AcknowledgementsSources of funding: this work was supported by the National Institutes of Health/National Institute of Diabetes and Digestive and Kidney Diseases (R01 DK117675, PI: Locke) and National Institute of Mental Health (K01 MH116737, PI: Budhwani).
Disclaimer: the data reported here have been supplied by the United States Renal Data System (USRDS). The interpretation and reporting of these data are the responsibility of the authors and in no way should be seen as an official policy or interpretation of the US government.
Conflicts of interestThere are no conflicts of interest.
References 1. Centers for Disease Control and Prevention. The state of the HIV epidemic in the U.S. Available at: https://www.cdc.gov/nchhstp/newsroom/fact-sheets/hiv/state-of-the-hiv-epidemic-factsheet.html. [Accessed 15 May 2023] 2. Smit M, Brinkman K, Geerlings S, Smit C, Thyagarajan K, Sighem Av, et al. ATHENA observational cohort. Future challenges for clinical care of an ageing population infected with HIV: a modelling study. Lancet Infect Dis 2015; 15:810–818. 3. Thurman M, Johnson S, Acharya A, Pallikkuth S, Mahesh M, Byrareddy SN. Biomarkers of activation and inflammation to track disparity in chronological and physiological age of people living with HIV on combination antiretroviral therapy. Front Immunol 2020; 11:583934. 4. Pathai S, Bajillan H, Landay AL, High KP. Is HIV a model of accelerated or accentuated aging?. J Gerontol A Biol Sci Med Sci 2014; 69:833–842. 5. De Francesco D, Wit FW, Bürkle A, Oehlke S, Kootstra NA, Winston A, et al. the Co-morBidity in Relation to AIDS (COBRA) Collaboration. Do people living with HIV experience greater age advancement than their HIV-negative counterparts?. Aids 2019; 33:259–268. 6. Smit M, Cassidy R, Cozzi-Lepri A, Quiros-Roldan E, Girardi E, Mammone A, et al. Projections of noncommunicable disease and healthcare costs among HIV-positive persons in Italy and the U.S.A.: A modelling study. PLoS One 2017; 12:e0186638. 7. Islam FM, Wu J, Jansson J, Wilson DP. Relative risk of renal disease among people living with HIV: a systematic review and meta-analysis. BMC Public Health 2012; 12:234. 8. Shelton BA, Sawinski D, MacLennan PA, Lee W, Wyatt C, Nadkarni G, et al. Associations between female birth sex and risk of chronic kidney disease development among people with HIV in the USA: a longitudinal, multicentre, cohort study. EClinicalMedicine 2022; 53:101653. 9. Lucas GM, Mehta SH, Atta MG, Kirk GD, Galai N, Vlahov D, Moore RD. End-stage renal disease and chronic kidney disease in a cohort of African-American HIV-infected and at-risk HIV-seronegative participants followed between 1988 and 2004. Aids 2007; 21:2435–2443. 10. Bansi L, Hughes A, Bhagani S, Mackie NE, Leen C, Levy J, et al. UK CHIC/ESRF study group. Clinical epidemiology of HIV-associated end-stage renal failure in the UK. AIDS 2009; 23:2517–2521. 11. Locke JE, Mehta S, Sawinski D, Gustafson S, Shelton BA, Reed RD, et al. Access to Kidney transplantation among HIV-infected waitlist candidates. Clin J Am Soc Nephrol 2017; 12:467–475. 12. Boyle SM, Fehr K, Deering C, Raza A, Harhay MN, Malat G, et al. Barriers to kidney transplant evaluation in HIV-positive patients with advanced kidney disease: a single-center study. Transpl Infect Dis 2020; 22:e13253. 13. Lee DH, Boyle SM, Malat GE, Kern C, Milrod C, DeBellis S, et al. Barriers to listing for HIV-infected patients being evaluated for kidney transplantation. Transpl Infect Dis 2017; 19:12777. 14. Sawinski D, Wyatt CM, Casagrande L, Myoung P, Bijan I, Akalin E, et al. Factors associated with failure to list HIV-positive kidney transplant candidates. Am J Transplant 2009; 9:1467–1471. 15. Adekunle RO, Mehta AK, Wang Z, Patzer RE, Zhang R. Early steps to kidney transplantation among persons with HIV and end-stage renal disease in ESRD network 6. Transpl Infect Dis 2022; 24:e13767. 16. Trish E, Fiedler M, Ning N, Gascue L, Adler L, Lin E. Payment for dialysis services in the individual market. JAMA Intern Med 2021; 181:698–699. 17. System USRD. USRDS Annual Data Report: Epidemiology of kidney disease in the United States. Bethesda, Maryland: 2021. 18. Waterman AD, Robbins ML, Peipert JD. Educating prospective kidney transplant recipients and living donors about living donation: practical and theoretical recommendations for increasing living donation rates. Curr Transplant Rep 2016; 3:1–9. 19. Harbell J, Terrault NA, Stock P. Solid organ transplants in HIV-infected patients. Curr HIV/AIDS Rep 2013; 10:217–225. 20. Tourret J, Guiguet M, Lassalle M, Grabar S, Lièvre L, Isnard-Bagnis C, et al. Access to the waiting list and to kidney transplantation for people living with HIV: a national registry study. Am J Transplant 2019; 19:3345–3355. 21. Stock PG. Strengths and weaknesses of using SRTR data to shape the management of the HIV-infected kidney transplant recipient. Am J Transplant 2017; 17:3001–3002. 22. Glasheen WP, Cordier T, Gumpina R, Haugh G, Davis J, Renda A. Charlson Comorbidity Index: ICD-9 update and ICD-10 translation. Am Health Drug Benefits 2019; 12:188–197. 23. Sullivan PS, Knox J, Jones J, Taussig J, Valentine Graves M, Millett G, et al. Understanding disparities in viral suppression among Black MSM living with HIV in Atlanta Georgia. J Int AIDS Soc 2021; 24:e25689. 24. Nguyen QC, Osypuk TL, Schmidt NM, Glymour MM, Tchetgen Tchetgen EJ. Practical guidance for conducting mediation analysis with multiple mediators using inverse odds ratio weighting. Am J Epidemiol 2015; 181:349–356. 25. Locke JE, Shelton BA, Olthoff KM, Pomfret EA, Forde KA, Sawinski D, et al. Quantifying sex-based disparities in liver allocation. JAMA Surg 2020; 155:e201129
留言 (0)