Study design and study population
The present analysis was performed among patients participating in the Alpha Omega Cohort. This is a prospective cohort study of 4837 Dutch patients (aged 60–80 years old, ~ 80% male) with a history of MI. At baseline (2002–2006), data were collected on demographic factors, lifestyle, medical history, health status, and habitual diet [11]. Blood samples were collected in 2002–2006 (baseline, all patients) and in 2006–2009 (approximately 40 months of follow-up, 60% of the patients, enrolled before August 2005). The Alpha Omega Cohort is conducted according to the principles of the Declaration of Helsinki. All patients provided written and oral informed consent, and the study was approved by the medical ethics committee of the Haga Hospital (The Hague, the Netherlands) and by the ethics committees of participating hospitals.
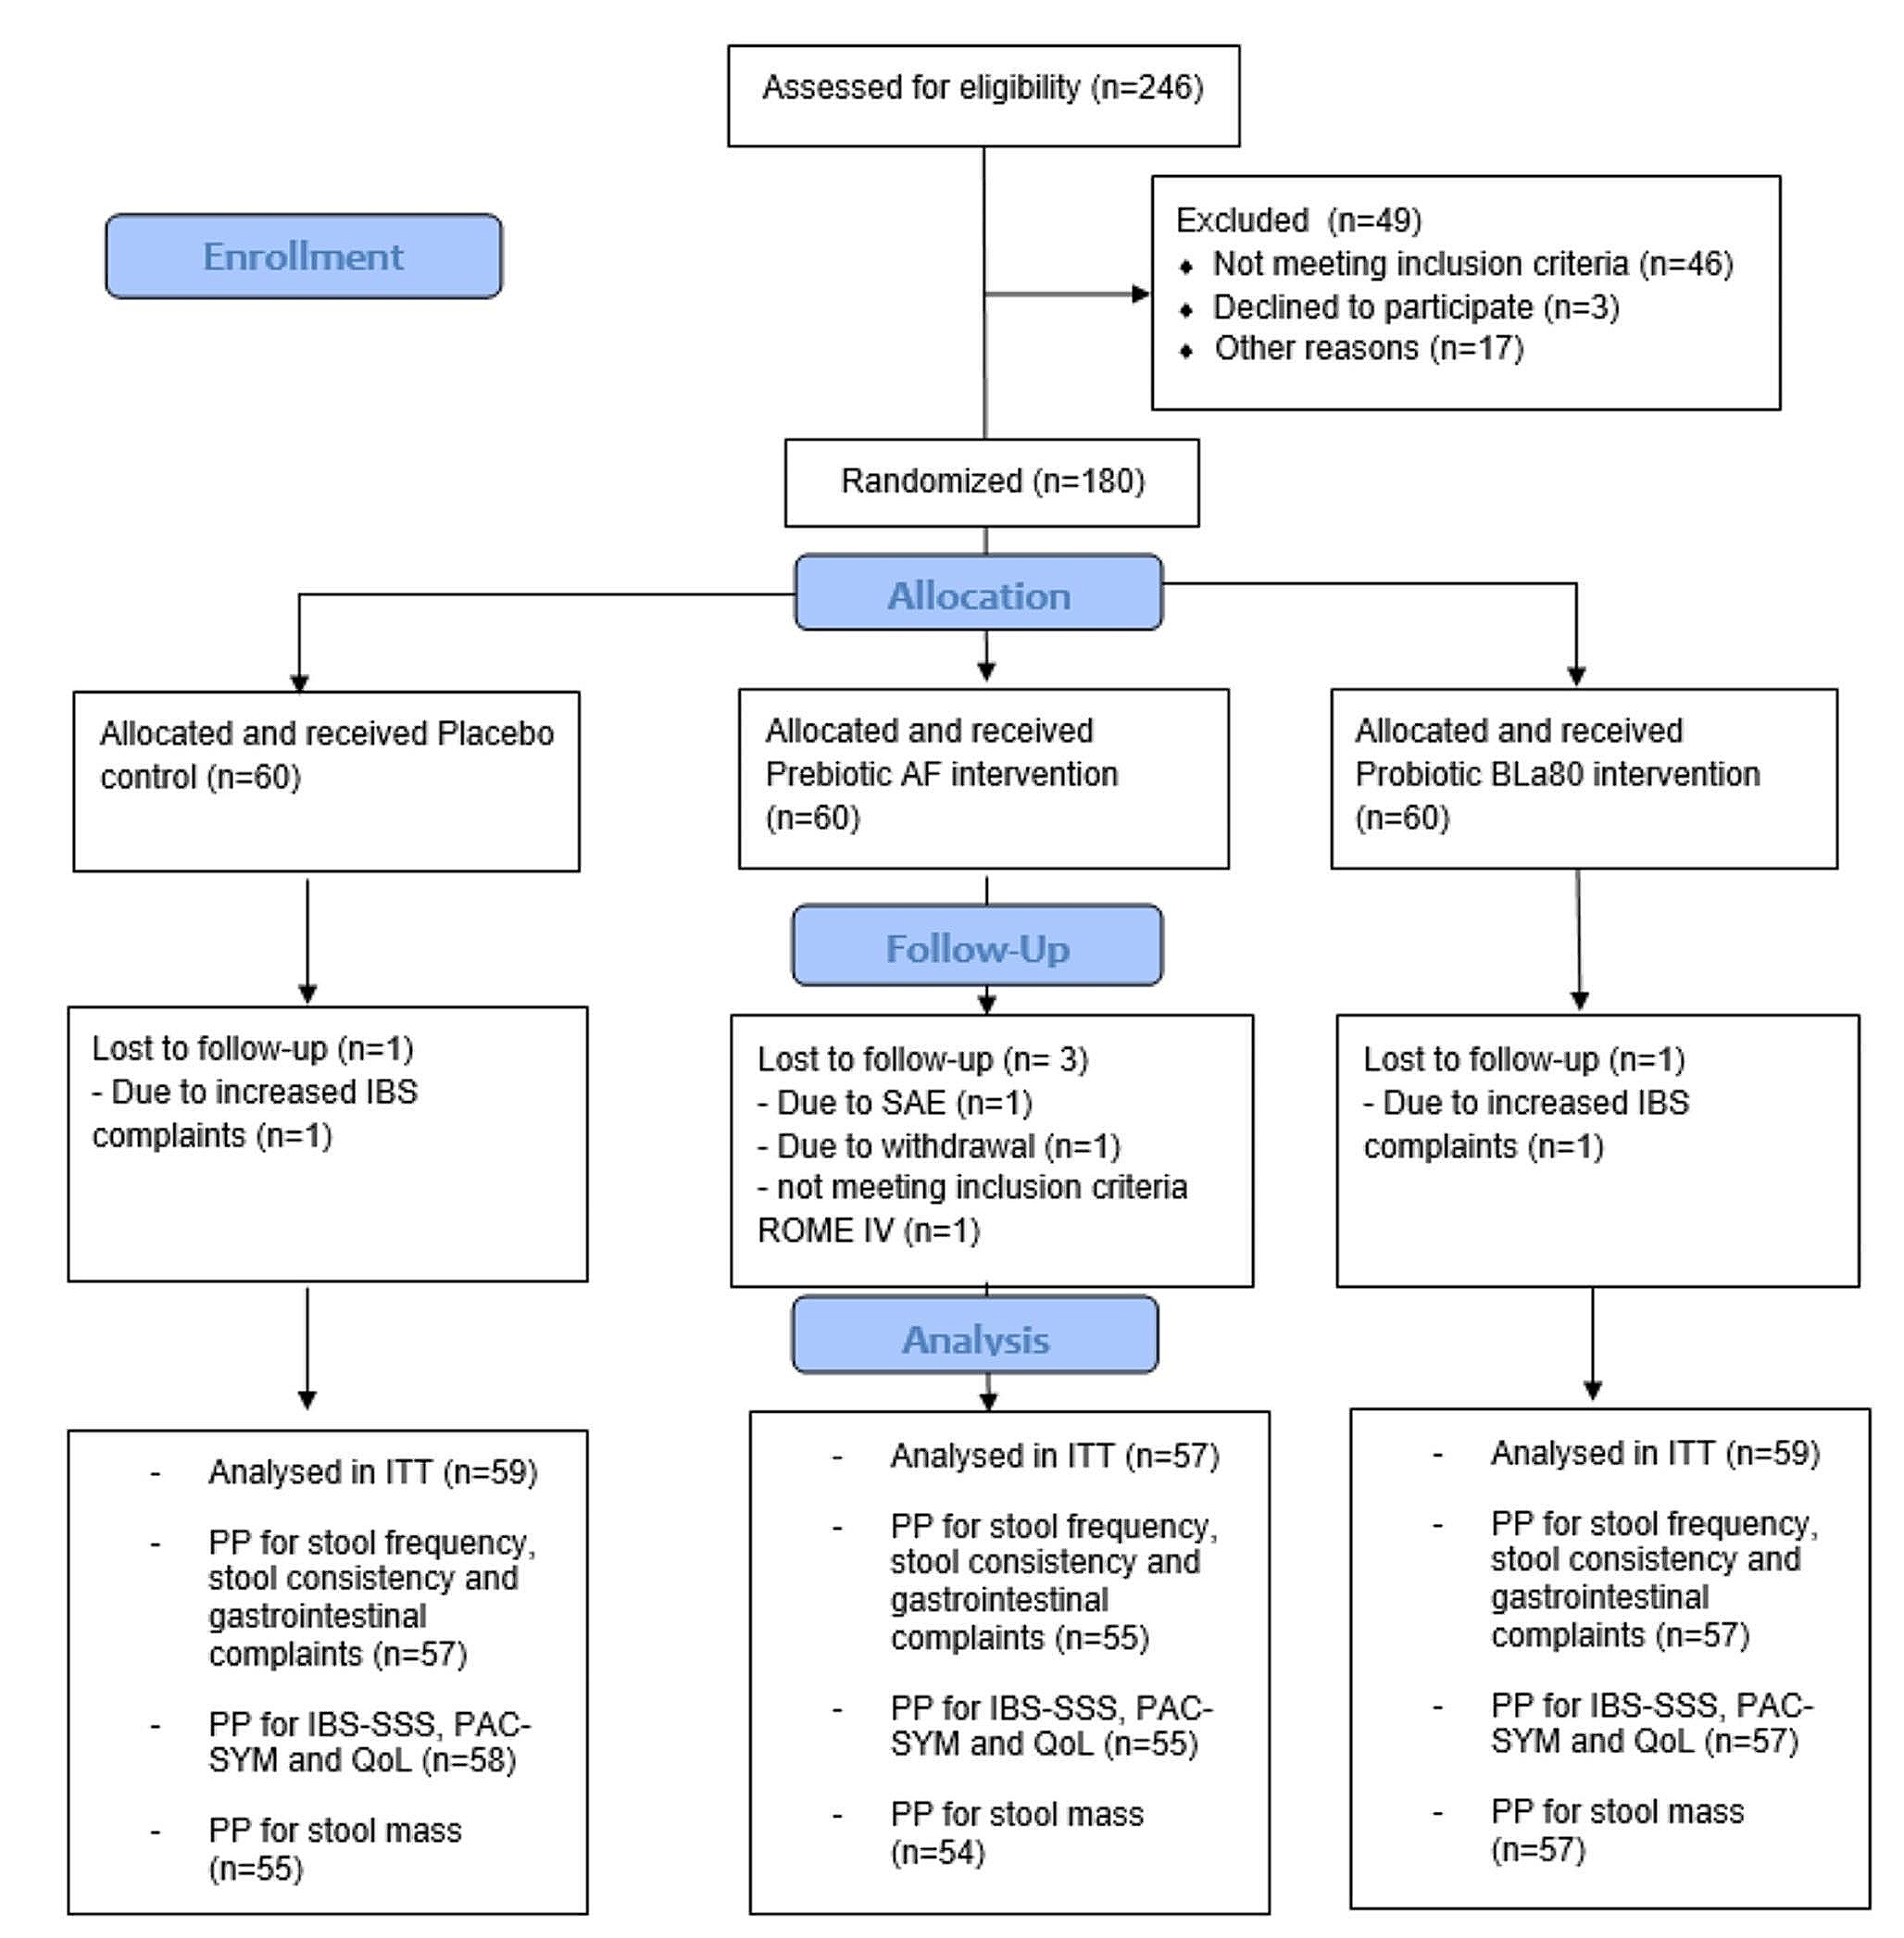
For the current study, patients were eligible if they had a blood sample at baseline and after 40 months of follow-up (blood samples were collected in the years 2002–2009, n = 2488). We then excluded patients without serum cystatin C and/or serum creatinine measurements at baseline and/or at follow-up (n = 148). Furthermore, we excluded patients with incomplete dietary data (n = 164), and with implausibly high or low energy intakes (< 800 or > 8000 kcal/day for men, < 600 or > 6000 kcal/day for women; n = 7). Thus, 2169 patients were left for analyses of the association between the DHD-CVD index and kidney function decline. Supplemental Table 1 shows the characteristics of excluded patients who were not eligible for the present study, mainly because they had no follow-up measurement of kidney function. Additionally, 43 patients had no genetic data, yielding 2126 patients for analyses in subgroups of genetic CKD risk (Supplemental Fig. 1).
Dietary assessment
Baseline dietary intake was assessed using a validated 203-item semi-quantitative food frequency questionnaire (FFQ) [12]. Food group intake, macronutrients or micronutrients, and energy intake were calculated based on the 2006 Dutch Food Composition Table (NEVO 2006), closest to the time of dietary assessment (2002–2006).
DHD-CVD index
The Dutch Health Council established dietary guidelines for the general Dutch population in 2015 [9] from which a 15-component adherence score (Dutch Healthy Diet15-index, DHD15-index) was developed by Looman et al. [13]. Recently, the Health Council tailored the dietary guidelines to atherosclerotic CVD patients [10], upon which we modified the DHD15-index to create the Dutch Healthy Diet Cardiovascular Disease index (DHD-CVD index). Compared to the DHD15-index, we changed the score for adherence to the fish guideline because CVD patients are recommended to eat more fish. Furthermore, we added a component for use of cholesterol-lowering plant sterol or stanol-enriched products (any use vs. zero use). An overview of the components of the DHD-CVD index and the scoring system is provided in Supplemental Table 2, and included food items are listed in Supplemental Table 3. For the present analysis, the component “filtered vs. unfiltered coffee” was omitted from the DHD-CVD index because this information was not obtained in the Alpha Omega Cohort. The DHD-CVD index in our analysis has a theoretical range of 0 to 150 points, with higher scores representing better overall adherence to the Dutch guidelines for CVD patients.
Kidney function assessment
Serum creatinine and serum cystatin C were measured in stored blood samples collected at baseline and after approximately 40 months of follow-up by a central laboratory [14, 15]. Serum cystatin C was measured using a particle-enhanced immunonephelometric assay, and serum creatinine was assessed using the modified kinetic Jaffé method as described in detail elsewhere [5]. GFR was estimated using the 2021 equation of the Chronic Kidney Disease Epidemiology (CKD-EPI) Collaboration which includes both serum creatinine and serum cystatin C [16]. We calculated annual eGFR change for each patient by subtracting baseline eGFR from the eGFR at follow-up and dividing the result by follow-up time in years. Prevalent CKD was defined as eGFR < 60 mL/min per 1.73 m2 at baseline.
Genetic data
Patients were genotyped using the Global Screening Array [17]. Genotype imputation was performed using the 1000 Genomes Project reference panel [18].
We calculated two separate weighted genetic risk scores (GRSs) of CKD based on SNPs that were associated with CKD as reported by a recent GWAS [7]. First, a weighted main GRS was constructed by summing the product of the dosages of the 88 nominally (p < 0.05) and genome-wide significant (p < 5*10− 8) non-ambiguous CKD-related risk alleles and the corresponding log-odds ratios (GRS_all). Second, we calculated a sub-score for genetic risk (GRS_sub), which consists of 16 genome-wide significant CKD SNPs. The selection process of SNPs is depicted in Supplemental Fig. 2, and the SNPs included in the GRSs are listed in Supplemental Table 4. For calculation of the GRSs, we compared the SNP effect alleles of the GWAS [7] with the SNP effect alleles in the Alpha Omega Cohort and harmonised the data accordingly. The effect size belonging to each SNP, as reported by the GWAS, was harmonised in such a way that the interpretation was “higher genetic risk of CKD”. The GRS_all ranged from − 4.161 to 3.950. GRS_all was divided in tertiles (T1: ≤ -0.434; T2: > -0.434 – ≤0.411; T3: >0.411), with T3 representing the group with a high genetic risk of CKD. The GRS_sub ranged from − 3.425 to 3.572. GRS_sub was divided into low and high genetic risk, using the median-split (> -0.00105).
Assessment of covariates
Data on sociodemographic factors, lifestyle habits, and health status at baseline were collected through self-administered questionnaires as described in detail elsewhere [11]. The highest attained level of education was categorised as elementary, low, intermediate, and high. Smoking status was categorised into never, former, and current. The validated Physical Activity Scale for the Elderly was used to assess physical activity [19], and categorised in three groups: low (< 3 metabolic equivalent tasks [METs]), intermediate (0–5 days/week moderate or vigorous activity [> 3 METs]), and high (≥ 5 days/week moderate or vigorous activity [> 3 METs]). Blood lipids (in mmol/L, i.e., total serum cholesterol, high-density lipoprotein cholesterol [HDL-c], and triglycerides) and plasma glucose (mmol/L) were measured using standard kits (Hitachi 912, Roche Diagnostics, Basel, Switzerland). Low-density lipoprotein cholesterol (LDL-c) was calculated using the Friedewald formula [20]. Patients with a body mass index (BMI) ≥ 30 kg/m2 were classified as having obesity. Diabetes mellitus was considered present in case of a self-reported physician’s diagnosis, use of glucose-lowering medication, or elevated plasma glucose (≥ 7.0 mmol/L if fasted > 4 h or ≥ 11.0 mmol/L if not fasted). Blood pressure (mmHg) was measured twice by trained research nurses at the patients’ homes or in the hospital. Systolic blood pressure (SBP) and diastolic blood pressure (DBP) were measured on the left arm with the patient in a seated position using an automated device (Omron HEM-711, Omron Healthcare Europe B.V., Hoofddorp, the Netherlands), and values were averaged. Self-reported medication was coded according to the Anatomical Therapeutic Chemical Classification System (ATC) [21]. Codes for antihypertensive medication comprised C02, C03 (C03C for loop diuretics), C08 and C09 (C09A and B for angiotensin-converting enzyme [ACE] inhibitors and C09C and D for Angiotensin II Receptor Blockers [ARBs]). The code for lipid modifying agents was C10.
Statistical analysis
We visually checked the distribution of all baseline variables using histograms and QQ-plots. Baseline characteristics and adherence to dietary guidelines are presented for the total analytical sample and across sex-specific tertiles of the DHD-CVD index. Means ± standard deviations (SDs) were used to describe normally distributed data, medians with interquartile ranges (IQR) were used for skewed variables, and n (%) for categorical data.
Beta coefficients with 95% CIs for the association between the DHD-CVD index and kidney function were obtained from multivariable linear regression models. The dependent (outcome) variable in all models was “annual eGFR change”, defined as final eGFR (after 40 months) minus baseline eGFR, divided by years of follow-up. Negative betas represent “more annual eGFR decline” and positive betas represent “less annual eGFR decline” with increasing DHD-CVD index.
The DHD-CVD index was analysed per 1-SD increment and in sex-specific tertiles (T1: <77.1; T2: ≥77.1 - <89.2; T3: ≥89.2 for women, and T1: <72.4; T2: ≥72.4 - <84.8; T3: ≥84.8 for men; T1 as reference). We also analysed adherence to guidelines for each individual DHD-CVD component (score) in relation to annual eGFR change, and absolute intake (grams/day) of each DHD-CVD component per 1-SD increment (for vegetables, fruits, whole grains, dairy, fish, tea, liquid fats and oils, and plant sterol or stanol-enriched products) or per 1-SD decrease (for refined grains, solid fats, red and processed meat, sugar-sweetened beverages and fruit juices, alcohol, and sodium intake). Because of low intake, absolute intakes of legumes and nuts was analysed in categories (consumers vs. non-consumers).
For the association of the DHD-CVD index with annual eGFR change, we also used restricted cubic splines (RCS, knots located at 10th, 50th, and 90th percentile) in men and women separately to assess potential non-linearity. These associations were visualised in graphs. We further studied the distribution of kidney function-related factors and the DHD-CVD index across genetically proxied CKD. We therefore divided GRS_all in tertiles, and used the median-split for GRS_sub. The total DHD-CVD index in relation to kidney function decline was subsequently analysed across categories of genetically proxied CKD risk. Similar analyses were performed for DHD-CVD components among patients at high genetic risk of CKD.
For all analyses, three multivariable models were created. The first two models included potential confounders, which were selected a priori based on previous literature and biological knowledge. The basic model (model one) included age, sex, education level (only elementary, low, intermediate, and high), and total energy intake. In model two, we additionally adjusted for smoking status (never, former, current), physical activity (low, intermediate, and high), use of renin-angiotensin aldosterone system (RAAS) drugs (yes, no), and use of lipid-lowering agents (yes, no). In model three, we additionally adjusted for potential intermediates of the DHD-CVD-kidney association: SBP, BMI, diabetes mellitus, and HDL-c. We used model two as the main model. For analyses of individual DHD-CVD components, we additionally adjusted model two for all other DHD-CVD components. In the genetic analyses, we further adjusted model two for the first three genetic principal components.
As additional analyses, the association between the DHD-CVD index and annual eGFR change was repeated in subgroups of patients with and without diabetes, obesity, and CKD. The main analysis was also repeated in a sample without RAAS users and diuretics users because these drugs could improve kidney function and may interact with diet [22,23,24]. We evaluated the robustness of the associations between DHD-CVD components (score and absolute intake) and annual eGFR change in patients with diabetes, obesity, and CKD.
Missing data of covariables were imputed using multiple imputation with chained equations (with 10 imputations and 10 iterations) using the MICE package [25]. The analyses were performed in each imputed dataset separately, and the estimates were subsequently pooled using Rubin’s rules [26]. We used RStudio version 3.6.0 for all analyses, and a two-sided p-value < 0.05 was considered statistically significant.

留言 (0)