
記住我

Firstly, we applied laparotomy on adult male WT mice under sevoflurane anesthesia and assessed cognitive functions on POD 7 and 14 by using forced Y-maze and NOR tests (Fig. 1A). Mice that underwent laparotomy showed a significant reduction in the relative body weight on the early stage of postoperative period while there were little changes to the mice exposed to sevoflurane anesthesia only (Fig. 1B). Since surgical trauma may induce anxiety or impair locomotor ability, and both of them can affect the performance on behavioral tests, we conducted the OF test on POD 4 to evaluate their presence. No significant difference was found in the central duration time, total distance, and grid crossing frequency among 3 groups, indicating neither sevoflurane anesthesia and laparotomy induced anxiety-like behavior or locomotor impairment (Fig. 1C-E). To further determine whether laparotomy affects the cognitive function, we assessed learning and memory used by forced alternation Y-maze and NOR tests on both POD 7 and 14. Mice that underwent laparotomy showed a significant impairment in recognizing the white safe arm with a longer latency time and larger number of errors than the SEVO group on POD 14 but not POD 7 (Fig. 1F-I). Furthermore, mice from the LAP group showed less interaction with the novel object when tested on both POD 7 and 14, and onwards with no object or location preference in the advance familiarization session (Fig. 1J-M). Results from these behavioral tests suggest that cognitive impairment is present at least between these 2 time points after surgery, while sevoflurane anesthesia had little impact on cognitive performance.
Fig. 1
Laparotomy induced learning and memory decline in adult WT mice. A: Schema of the experimental design. B: The changes in body weight at different timepoints during the postoperative period. Two-way repeated ANOVA with Tukey’s multiple comparison test with n = 13–15 mice per group, CON vs LAP: ** P < 0.01, SEVO vs LAP: # P < 0.05, ## P < 0.01. C-E: Open field test on POD4, the duration time in the central area (C), Total distance (cm) during 10 min observation (D), the frequency of grid crossing (E), CON: n = 10, SEVO: n = 11, LAP: n = 10. F-I: Y-maze test on PODs 7 and 14, including: the latency on POD 7 (F), the number of errors on POD 7 (G), CON: n = 10, SEVO: n = 11, LAP: n = 9; the latency on POD14 (H), the number of errors on POD14 (I), CON: n = 11, SEVO: n = 9, LAP: n = 15. One-way ANOVA with Tukey’s multiple comparison test was applied to the analysis of latency, Kruskal–Wallis test with Dunn’s multiple comparisons test was applied to the number of errors. J-M: NOR test on PODs 7 and 14, including: discrimination index of two similar objects (A1 and A2) in the familiarization phase on POD6 (J); discrimination index of novel object (B) in the testing phase on POD7 (K), CON: n = 10, SEVO: n = 11, LAP: n = 9; discrimination index of two similar objects (A1 and A2) in the familiarization phase on POD13 (L), discrimination index of novel object (B) in the testing phase on POD14 (M), CON: n = 7, SEVO: n = 8, LAP: n = 9. One-way ANOVA with Tukey’s multiple comparison test. Data is presented as mean ± SEM, * P < 0.05, **P < 0.01, ***P < 0.001. POD: post-operative day, Y-maze test = forced alternation Y-maze test, NOR test = novel object recognition test, CON = control, SEVO = sevoflurane, LAP = laparotomy
Neuroinflammatory Responses With Prolonged Activation of Glia Occurred in the Postsurgical HippocampusNeuroinflammation has been shown to contribute to postoperative cognitive decline (Safavynia and Goldstein 2018; Luo et al. 2019; Yang et al. 2020). The postsurgical mice have higher levels of pro-inflammatory factors and cellular activation in the hippocampus or the frontal cortex (Luo et al. 2019; Yang et al. 2020). To verify these findings, we measured the change of pro-inflmmatory factors in the postsurgical hippocampus on PODs 1, 7 and 14, especially those rodents that were subjected to behavior tests on PODs 7 and 14. In this study, the mRNA levels of several pro-inflammatory factors showed significant changes at different time points. On POD 1, IL-1β and TNF-α were increased but IL-6 was decreased in the LAP group (Fig. 2A). On POD7, C3 were significantly increased in the LAP group (Fig. 2B). On POD 14, C3 and MCP-1 were significantly increased but C1q was significantly decreased in the LAP group (Fig. 2C). We noticed that cytokines IL-1β, TNF-α and IL-6 changes were rapid but transient, while C3 upregulation was delayed but prolonged, a pattern that concur more with the time course of cognitive deficits.
Fig. 2
Neuroinflammation with cytokine increase and activation of glia in postsurgical mice. A-C: heatmap of cytokine mRNA expression on POD 1 (A), POD7 (B), and POD14 (C), * P < 0.05, **P < 0.01, ***P < 0.001 for LAP versus SEVO, # P < 0.05 for LAP versus CON. D: representative confocal images show astrocytic marker GFAP staining on PODs 1, 7 and 14, scale bar: 100um. E–G: histograms showed GFAP+ signals quantification on POD1 including relative intensity (E), average cell size (F) and total cell number (G). H-J: histogram shows GFAP+ signals quantification on POD 7 including relative intensity (H), average cell size (I) and cell number (J). K-M: histogram shows GFAP+ signals quantification on POD 14 including relative intensity (K), average cell size (L) and cell number(M). N: representative confocal images show microglial marker Iba-1 staining on PODs 1, 7, and 14, scale bar: 100 um. O-Q: histogram shows Iba-1+ signals quantification on POD1 including relative intensity (O), average cell size (P) and total cell number (Q). R-T: histogram shows Iba-1+ signals quantification on POD 7 including: relative intensity (R), average cell size (S) and total cell number (T). U-W: histogram shows Iba-1+ signals quantification on POD 14 including: relative intensity (U), average cell size (V) and total cell number (W). The representative images were from hippocampal DG area. The average of DG, CA1 and CA3 areas were used for statistical analysis. Data is presented as mean ± SEM, IF staining analysis was used One-way ANOVA with Tukey’s multiple comparison test with n = 3–5 mice per group. * P < 0.05, **P < 0.01, ***P < 0.001. POD = post-operative day, CON = control, SEVO = sevoflurane, LAP = laparotomy
In addition, GFAP and Iba-1 staining showed prolonged activation of astrocytes and microglia after laparotomy. In the postsurgical hippocampus, GFAP+ astrocytes presented with higher intensity on POD 1, 7 and 14, with more extensive cell size on POD1 and 14 and increased cell number on POD 7 (Fig. 2D-M). Similarly, Iba-1+ microglia in the postsurgical hippocampus presented with a higher Iba-1 intensity and increased cell number on POD 1, 7, and 14, but the cell size did not show any difference among three groups (Fig. 2N-W).
RNA-sequencing Revealed that Postsurgical Hippocampal Astrocytes Had Distinct Transcriptional ProfilesEmerging evidence indicated that reactive astrocytes could turn to A1 neurotoxic phenotype and accelerated the progression of neurodegenerative disease by releasing active molecules, such as C3 (Liddelow et al. 2017). Therefore, we isolated live GLAST+ astrocytes from the postsurgical hippocampus using flow cytometry (Fig. 3A-G) and performed RNA sequencing and differentially expressed genes (DEGs) analysis on these astrocytes for a more comprehensive understanding of gene expression profiles after surgery. The results showed that there were 3777 DEGs over a total of 16,429 detected genes based on the comparison between the SEVO and LAP groups (Fig. 3H), and the distribution was shown in the cluster heatmap of DEGs (Fig. 3I). The following gene ontology (GO) analysis revealed the enrichment of DEGs in three major categories: biological process, cellular component and molecular functions. It showed that most of DEGs were enriched in cellular process, biological regulation, regulation of biological process and metabolic process under “biological process” category, most of DEGs belonged to cell and cell part under “cellular component” category, and majority of DEGs significantly belonged to binding when referred to “biological functions” (Fig. 3J).
Fig. 3
Transcriptional characteristics of hippocampal astrocytes from the postsurgical mice. A-G: representative dot plot showing FACS gating strategy for live GLAST+ astrocytes, P-1/P-2/P-3 shows single cell gating (A-C), P-4 under P-3 shows DAPI− live cells (D), P5 under P-4 shows GLAST+ cells (E), Q1 quadrant shows 20.9% DAPI−/GLAST+ live astrocytes in SEVO mice (F), and 36.5% DAPI−/GLAST+ live astrocytes in LAP mice (G). H: scatter plot of differentially expressed genes (DEGs), red represents upregulated genes, green represents downregulated genes, and grey represents non-regulated genes, |log2 (foldchange)|≥ 1 and Q value ≤ 0.05 are used as screening threshold. I: the cluster heatmap of all DEGs. J: histogram shows GO functional classification analysis. Data is presented as mean ± SEM, * P < 0.05. SEVO = sevoflurane, LAP = laparotomy
Thus, the significant difference of transcriptional profile from postsurgical astrocytes suggested higher activities in signaling interaction and transduction and the possible involvement of immune responses, which concurred with astrocytic reactivation after surgery.
Laparotomy-induced Reactive Astrocytes Were A1 Neurotoxic Phenotype With C3 UpregulationFollowed by the GO analysis, we performed the KEGG (Kyoto Encyclopedia of Genes and Genomes) pathway analysis to see potential signaling pathways involved in astrocytic reactivation. Firstly, several pathways related to the immune system were listed in the top 20 enriched KEGG terms, including complement and coagulation cascades, hematopoietic cell lineage, and Th1 and Th2 cell differentiation (Fig. 4A). This list also displayed other pathways involved in signaling interaction and transduction, such as neuroactive ligand-receptor interaction, ECM-receptor interaction, cytokine-cytokine receptor interaction, calcium signaling pathway, and PI3K-Akt signaling pathway, same as metabolism-related pathways that were also affected (Fig. 4A).
Fig. 4
Hippocampal astrocytes from the postsurgical mice were identified as neurotoxic reactive astrocytes with the activation of complement cascades. A: the KEGG pathway analysis reveals the top 20 enrichments in the comparison between LAP mice and SEVO mice B: heatmap of 24 regulated complement factors, red represents upregulated genes and blue represents downregulated genes. C: protein–protein interaction network is based on 24 regulated complement factors. D: histogram shows relative mRNA levels of reactive astrocytic markers. E: histogram shows relative mRNA changes of selected genes for validation, n = 6–8 mice per group. F: the table shows the relative fold changes in RNA-seq analysis and functional properties of selected genes for RT-PCR validation. Data is presented as mean ± SEM. Student’s t test was performed to data analysis. * P < 0.05. SEVO = sevoflurane, LAP = laparotomy
Considered that the complement and coagulation cascades was highly involved in astrocytic reactivation, which was also associated with the development of cognitive deficits, we further examined the activation of complement cascades in postsurgical astrocytes. Firstly, the heatmap of complement factors showing the relative expression of complement DEGs with elevation of Cd59b, F12, F5, Klkb1, Cfb, C3, F3, Serpind1, F8, A2m, C1s1, Vsig4, C4bp, and F7 in the LAP group (Fig. 4B). The following protein–protein interaction analysis of complement factors suggested that C3 was one of the central factors in complement activation induced by surgery (Fig. 4C).
Upregulation of C3 and activation of complement in postsurgical reactive astrocytes suggested that surgery could cause the neurotoxic phenotype of reactive astrocytes. Thus, we investigated the changes of reactive astrocyte markers by RT-PCR to further characterize these reactive astrocytes in the postsurgical hippocampal region. Compared to the SEVO group as control, GLAST+ astrocytes in the LAP group showed a significant increase in pan-active astrocyte markers (Gfap, Cd44 and Serpina3n) and A1 astrocyte markers (C3, Ggta1, and Serping1), but no change was found in A2 astrocyte markers (Emp-1, S100a), proving that surgery induced reactive astrocytes in the hippocampus was A1 neurotoxic phenotype (Fig. 4D). Besides, we selected 9 genes involved in inflammation or transcriptional activities (Fig. 4F), and measured their expression by RT-PCR to further verify the RNA-seq results (Fig. 4E). These genes exhibited similar changes to the RNA-seq analysis, with 5 genes (C3, Cd209, Il-1rn, Pcdhga3, F8) upregulated and 4 genes (Jpt, Sebox, Zfp131, Topbp1) downregulated (Fig. 4E).
Thus, surgery induced reactive astrocytes were identified as the neurotoxic phenotype, featured by the complement activation and C3 upregulation as the central molecular player.
Astrocytic But Not Microglial C3 Increased in the Hippocampus After LaparotomyRecent studies have demonstrated that neurotoxic reactive astrocytes in pathological conditions were able to produce C3, which accelerated the pathogenesis of cognitive impairment in various neurodegenerative diseases. (Liddelow et al. 2017; Clarke et al. 2018; Chen et al. 2022b). The RNA-seq results already showed that the transcription of C3 was increased in surgery-induced A1 astrocytes. Thus, we examined the protein level of C3 and its colocalization in the postsurgical hippocampus to further verify previous findings. Firstly, the results showed that hippocampal C3 protein levels were significantly increased in the LAP group on POD 7, compared to the SEVO group (Fig. 5A-B, raw blots seen in Suppl. Fig. 4A). Furthermore, immunofluorescent co-staining of C3 and astrocytic marker GFAP showed that total C3 immunoreactivity in the hippocampus and average intensity of C3 within GFAP+ cells were both higher in the LAP group than that in the CON and SEVO groups, with a greater colocalization with GFAP+ area in the LAP group on POD 7. This result indicated that C3 was increased in the postsurgical hippocampus and mainly colocalized with GFAP+ astrocytes (Fig. 5C-F). However, there was little colocalization of C3 and microglial marker Iba-1 (Fig. 5G). Similar to the change on POD7, C3 protein levels from total hippocampal lysate, total C3 immunoreactivity and average intensity of C3 within GFAP+ astrocytes in the hippocampus were increased in the LAP mice on POD14, while the colocalization of C3 with GFAP+ area did not show any significant change (Suppl. Fig. 1). Thus, we concluded that surgery induced C3 upregulation in the hippocampus on both POD 7 and 14, which was mainly derived from astrocytes other than microglia, and the changes of astrocytic C3 were related with the change of C3 mRNA levels.
Fig. 5
The increase of C3 was observed in astrocytes but not in microglia in the postsurgical hippocampus on POD7. A-B: Western blot analysis of C3 protein level in the hippocampus on POD 7, normalized by β-Actin expression, n = 3–5 mice per group. C: representative confocal images depict the colocalization of C3 (green) and astrocytic marker GFAP (magenta) staining in the hippocampus on POD7, scale bar: 100um. D-F: histograms show the quantified analysis of total C3 intensity (D), the percentage of C3+ signal occupied within GFAP+ area (E), and average C3 intensity within GFAP+ cell (F), n = 3–4 mice per group. G: representative confocal images depict rare colocalization of C3 (green) and microglial marker Iba-1 (gray) in the hippocampus. The representative images were from hippocampal DG area. The average of DG, CA1 and CA3 areas were used for statistical analysis. Data is presented as mean ± SEM. One-way ANOVA with Tukey’s multiple comparison test was used for data analysis, * P < 0.05, **P < 0.01, ***P < 0.001. POD = post-operative day, CON = control, SEVO = sevoflurane, LAP = laparotomy
Inhibition of C3 by AAV9-C3shRNA Attenuated Postoperative Cognitive ImpairmentTo further investigate the role of C3 in cognitive impairment following surgery, we inhibited cerebral C3 by intracerebroventricular injection of AAV9-C3shRNA 14 days before laparotomy and assessed the changes in cognitive testing on POD 14 (Fig. 6A, raw blots seen in Suppl. Fig. 4B). The change of body weight showed that laparotomy resulted in significant body weight loss on POD3, while C3 inhibition did not affect body weight of the sevoflurane or laparotomy mice (Suppl. Fig. 2C).The protein levels of hippocampal C3 suggested that AAV9 delivery of anti-C3shRNA successfully suppressed surgery-induced C3 upregulation compared to postsurgical mice treated by AAV9-GFP controls, while not affecting C3 expression in the sevoflurane mice (Fig. 6B-C). Moreover, AAV9-mediated C3 restriction significantly improved cognitive performance of postsurgical mice in both Y-maze and NOR tests compared to AAV9-GFP counterparts. In contrast, we did not find any significant difference between the SEVO + AAV9-GFP and SEVO + AAV9-C3shRNA mice (Fig. 6D-G). The open field test conducted on POD4 showed that no significant difference was found in the central duration time, total distance, and grid crossing frequency among 4 groups, indicating that neither anxiety-like behavior nor locomotor impairment was inducted by laparotomy or C3 inhibition (Suppl. Fig. 2D-F). These behavioral data suggested that the cognitive alternation during postoperative period highly correlated to C3 activation.
Fig. 6
C3 knock-down attenuated post-operative cognitive impairment. A: Schema of the experimental design of C3 intervention. B-C: Western blot analysis of hippocampal C3 protein level on POD14. Two-way ANOVA with Bonferroni’s multiple comparison test with n = 6–7 mice per group. D-E: Y-maze test on POD 14, including: the latency on POD14 (D), the number of errors on POD14 (E). Two-way ANOVA with Bonferroni’s multiple comparison test was applied to the analysis of latency, Kruskal–Wallis test with Dunn’s multiple comparison test was applied to the number of errors with n = 6–7 mice per group. F-G: NOR test on POD 14, including: discrimination index of two similar objects (A1 and A2) on POD13 training (F); discrimination index of novel object (B) on POD14 NOR testing (G). Two-way ANOVA with Bonferroni’s multiple comparison test with n = 6–7 mice per group
Inhibition of C3 By AAV-C3shRNA Did Not Modulate Reactive Astrocytes and Expression of CytokinesSince C3 has been shown to mediate pro-inflammatory responses, we also evaluated the postoperative change in astrocytes and in cytokines after C3 inhibition. Firstly, GFAP and C3 double staining showed that AAV9-mediated C3 suppression occurred only within hippocampal astrocytes of postsurgical mice but not in those exposed to sevoflurane only (Fig. 7A-C). However, C3 inhibition did not affect activated astrocytes, indicated by GFAP+ intensity, cell size and cell number (Fig. 7A, D-E). In addition, expression profiles of cytokines showed a decrease in MCP-1 induced by C3 inhibition only (Fig. 7F). Taken together, inhibition of C3 by AAV9 approach did not affect the activation state of reactive astrocytes and expression of various cytokines in the hippocampus. The results suggested that C3 was not the major factor to regulate neuroinflammation orchestrated by cytokines.
Fig. 7
C3 knock-down had limited effects on activation of astrocytes and expression of cytokines. A: representative confocal images depicting colocalization of C3 (cyan) and astrocytic marker GFAP (red) staining in the hippocampus on POD14, scale bar: 100 um. B-E: histogram show the quantified analysis of total C3 intensity (B), the percentage of C3+ signal occupied within GFAP+ area (C), total GFAP intensity (D), and the average of GFAP+ cell size (E), Two-way ANOVA with Bonferroni’s multiple comparison test with n = 4 mice per group. F: heatmap of cytokine mRNA expression on POD 14, Two-way ANOVA with Bonferroni’s multiple comparison test with n = 6–7 mice per group; * P < 0.05 for LAP + AAV9-GFP versus SEVO + AAV9-GFP, # p < 0.05 for LAP + AAV9-C3shRNA versus LAP + AAV9-GFP. Data is presented as mean ± SEM, * P < 0.05, **P < 0.01, ***P < 0.001. POD = post-operative day, SEVO = sevoflurane, LAP = laparotomy, AAV9-GFP = AV9 viral vector contains GFP sequence, AAV9-C3 shRNA contains C3 shRNA sequence and GFP sequence
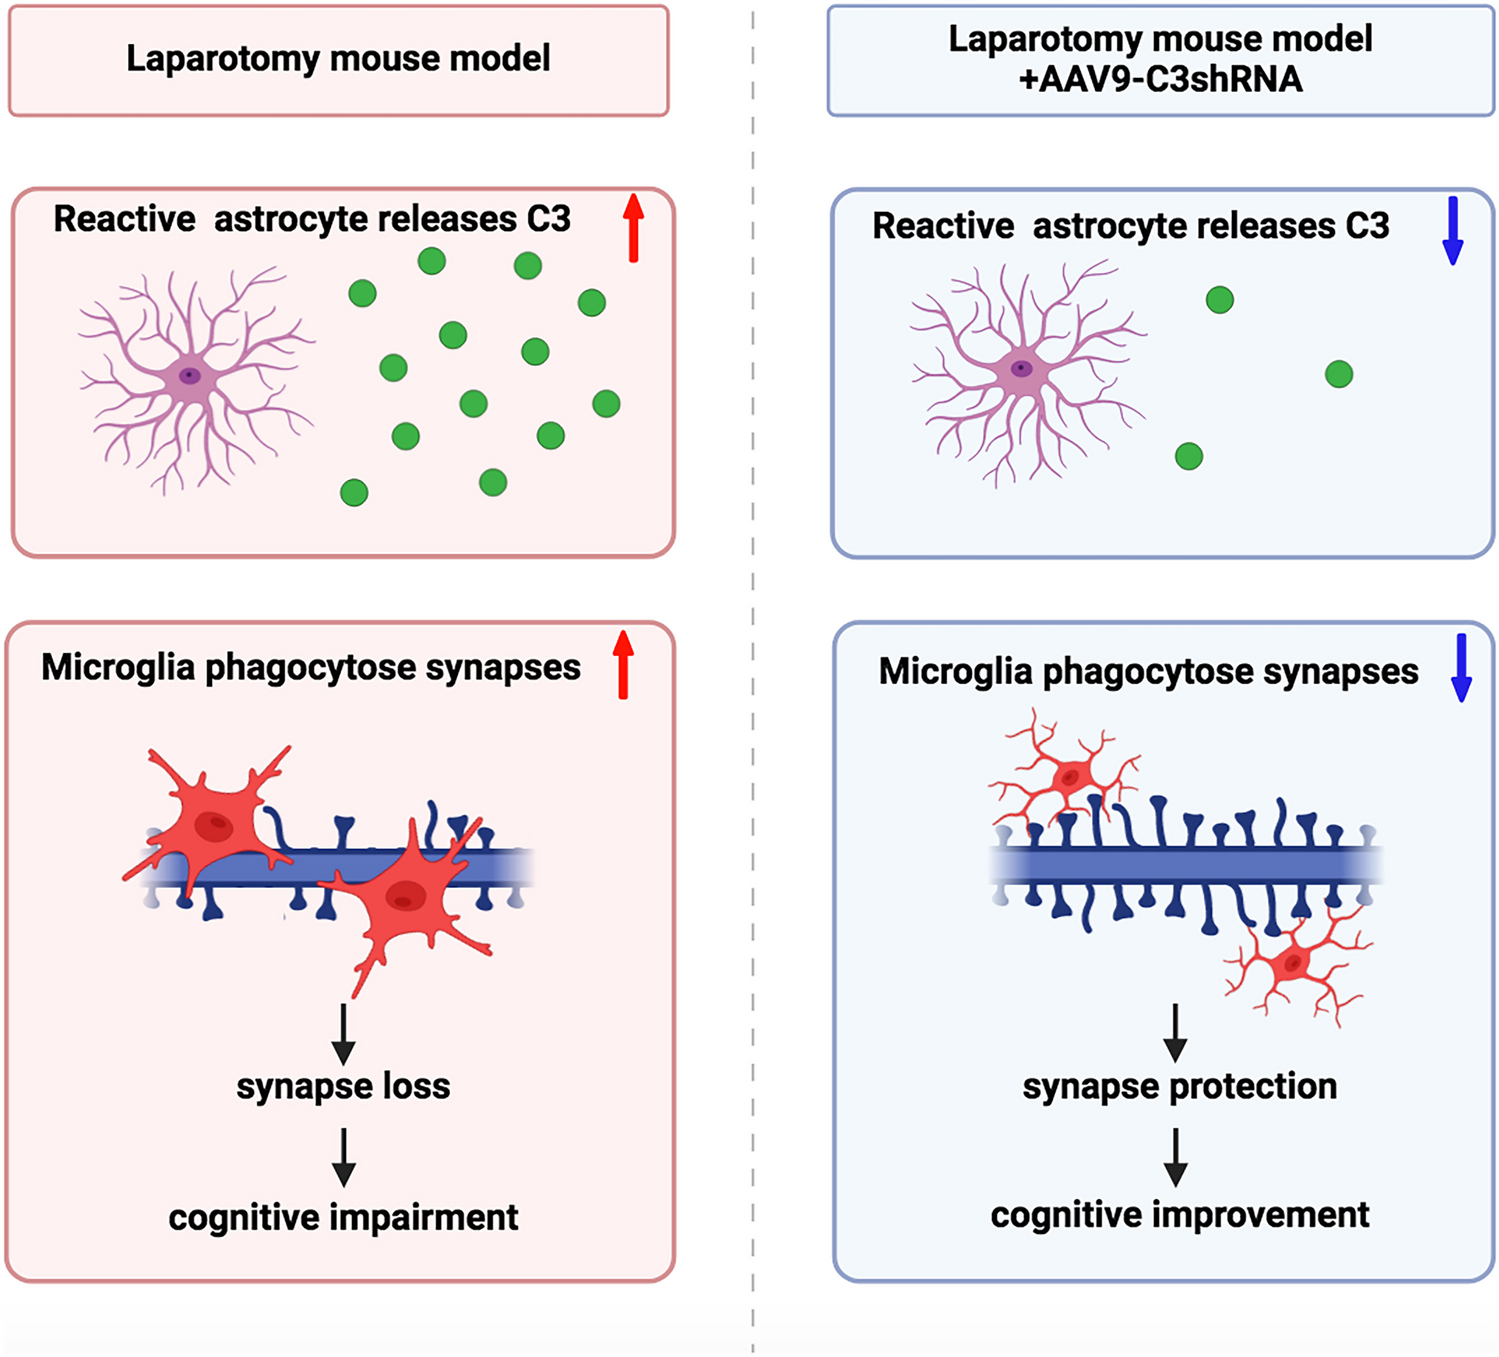
Inhibition of C3 By AAV-C3shRNA Attenuated Microglia to Phagocytose SynapsesAnother role of complement C3 in the CNS is to mediate engulfment (phagocytosis) of synapses by microglia. To further investigate the impact of C3 activation on hippocampal synapses, we assessed phagocytic activity of microglia in the hippocampus by performing high-resolution confocal imaging and 3D reconstruction analysis. Consistent with C3 activation, we found a significant augmentation of SYP+ presynaptic terminals engulfed within microglial lysosomes of postsurgical mice pretreated with AAV9-GFP compared to their SEVO + AAV9-GFP controls, which was significantly attenuated by AAV9 deliver of C3 shRNA in postsurgical mice (Fig. 8A-B). Then, we investigated the change of CD68 expression and activation of microglia in the hippocampus (Suppl. Fig. 3A). The results showed that a higher intensity of CD68 in the LAP group was decreased by C3 inhibition (Suppl. Fig. 3B), while the increase of Iba-1 intensity in the LAP group was not changed by C3 inhibition (Suppl. Fig. 3C). However, the size of Iba-1 positive cells in the postsurgical hippocampus was significantly reduced by C3 inhibition (Suppl. Fig. 3D). These findings suggested that C3 inhibition could not completely reverse activation of microglia, but alleviate phagocytic function in microglia at least.
Fig. 8
Knockdown of C3 prevented microglia-mediated engulfment of synapses and preserved synapse in the hippocampus. A: representative image of 3D reconstruction and surface rendering of pre-synaptic marker SYP (green), lysosome marker CD68 (red) and microglial marker Iba-1 (blue) depicting microglial engulfment of synapses; B: histogram of engulfed SYP volume showing that C3 knockdown can attenuate laparotomy-induced microglial engulfment of synapses on POD14. C: representative image of SYP+ (red) pre-synaptic and PSD95+ (green) post-synaptic puncta. D-F: histogram of puncta numbers showing that C3 knock-down augmented the number of SYP+ puncta (D), and colocalized puncta (F), with no significant difference of PSD95+ puncta (E). Two-way ANOVA with Bonferroni’s multiple comparison test with 6 cells per mouse, n = 4 mice per group. Data was presented as mean ± SEM, * P < 0.05, **P < 0.01, ***P < 0.001. PSD95: postsynaptic density protein 95, SYP: synaptophysin, SEVO = sevoflurane, LAP = laparotomy, AAV9-GFP = AAV9 control viral vector containing short non-sense sequence and GFP sequence, AAV9-C3 shRNA = AAV9 viral vector containing C3 shRNA sequence and GFP sequence
We next evaluated loss of synapses in the hippocampus and identified that knockdown of C3 by AAV9-shRNA approach significantly rescued the loss of SYP+ presynaptic terminals and SYP+/PSD95+ colocalized synaptic puncta in the postsurgical mice, which was consistent with C3-associated elimination of synapse by microglia (Fig. 8C-F). However, no significant change of PSD95+ postsynaptic terminals by either surgery or C3 inhibition was found. The results suggest that activation of C3 after surgery promoted engulfment of synapses by microglia, and suppression of C3 reduced phagocytosis of synapses by microglia. The results also explain why sustained activation of microglia could be found two weeks after post-surgery even though expression of cytokine returned to basal level.
留言 (0)