Human ameloblastoma samples
Human ameloblastoma samples were collected from Guanghua School of Stomatology, Sun Yat-sen University, and protected by using MACS Tissue Storage Solution (Miltenyi, Cat#130-100-008). All fresh surgical tissues were diagnosed with ameloblastoma by two pathologists. For scRNA-seq analysis, eleven tumor samples were prepared for scRNA-seq (Table S1). This study was approved by the Medical Ethics Committee of Hospital of Stomatology Sun Yat-Sen University.
Cell lines
The ameloblastoma immortalized cell line hTERT+-AM43 was cultured in DMEM (Thermo Fisher Scientific, Cat#C11995500BT) with 10% FBS (Thermo Fisher Scientific, Cat#A3160801) and 1% Penicillin/Streptomycin (Thermo Fisher Scientific, Cat#15140-122). All cells were cultured at 37 °C in a cultivation cabinet with 5% CO2.
Preparation of single-cell suspensions
The fresh tissues were washed with phosphate-buffered saline (PBS; BOSTER, Cat#AR0030-1), cut into small pieces (<1 mm3) and dissociated using a Tumor Dissociation Kit (Miltenyi, Cat#130-095-929) according to the manufacturer’s instructions. After tissue dissociation, the cell suspension was filtered using a 40-µm nylon mesh (BD Falcon, Cat#352350). Dissociated cells were pelleted and washed with cold DMEM, after which the filtered cells were resuspended with ACK Lysing Buffer (Thermo Fisher Scientific, Cat#A1049201) for 5 minutes to remove red blood cells. Cell viability was confirmed to be >85% in all samples by using Trypan blue staining. Finally, the single-cell suspension was used for scRNA-seq droplet capture. During the period of tissue dissociation, the cells were always kept on ice, and the processing time was less than 2 hours.
Single-cell RNA sequencing
The single-cell suspension was processed by 10× Genomics Chromium Single-Cell 3′ reagents Kit version 3 (10× Genomics, Pleasanton, CA, USA) according to the manufacturer’s protocol. Cells were loaded onto a chromium single-cell chip with a target number of 6 000–12 000 cells. The libraries were sequenced on the Illumina Nova6000 system with 150-bp paired-end sequencing. Raw reads were processed with Cell Ranger (version 3.1.0 for T35 data, version 3.0.1 for T45 data, version 4.0.0 for T51, T56, T58 and T68 data, version 6.1.1 for T107, T109 and T110, version 7.1.0 for T115 and T116 data) and mapped to the human genome reference sequence (GRCH38) to generate a file containing a gene expression matrix, a gene table, and a barcode table.
ScRNA-seq data processing
The Seurat R package (version 4.0.0) was used to analyze the gene-barcode expression matrix of each sample in R software (version 4.0.2). Cells with <200 or >9 000 expressed genes were eliminated from downstream analysis. Moreover, cells with >10% mitochondrial genes mapped or >7% hemoglobin genes were also filtered out. The ribosomal and mitochondrial genes were deleted in the following step. Then, the potential doublets in individual samples were identified and removed by using the DoubletFinder package (version 2.0.3) with default parameters.44 After the strict quality control above, a total of 92,622 remaining cells were used for the following analysis. The number of genes (nFeature), number of UMI (nCount), percent of mitochondrial (percent.mt), and percent of hemoglobin (percent.HB) of each cell in each sample was showed by violin plot (Fig. 1a).
Data integration and cell type identification
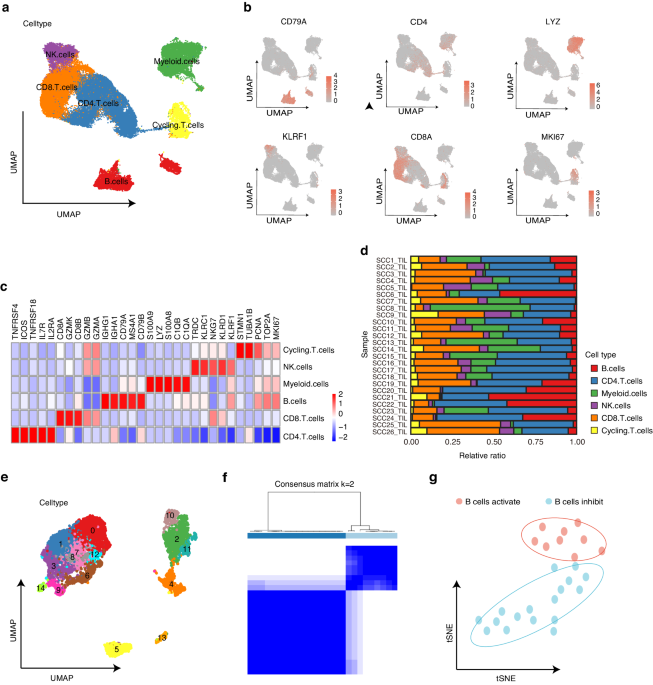
All samples were processed with normalization, variance stabilization by using sctransform (version 0.3.2) and merged with the IntegrateData function into one Seurat object. For dimensionality reduction, principal component analysis (PCA) was used to summarize the top 3 000 highly variable genes (HVGs), and then the ElbowPlot function was used to estimate each principal component. A total of 20 principal components were selected for uniform manifold approximation and projection (UMAP). The cell clusters were identified by using the FindClusters function with a resolution of 1.0 after computing shared nearest neighbors based on the Louvain algorithm. To assign cell type, the FindAllmarkers function was used to find the differentially expressed genes (DEGs) in Seurat with default parameters. We then annotated the clusters by using the well-known marker genes reported in the literature. We identified tumor cells expressing KRT5, KRT8, KRT14, KRT15 and KRT19; fibroblasts expressing COL1A1, COL1A2, DCN and LUM; T cells expressing CD2, CD3D, CD3E and CD3G; endothelial cells expressing CDH5, PECAM1, VWF, and ENG; myeloid cells expressing CD74, LYZ and MHC class II genes (including HLA-DRA, HLA-DPA1 and HLA-DQA1); myofibroblasts expressing ACTA2, MYL9, MCAM and RGS5; osteoclasts expressing CA2, ACP5, SPP1, and MMP9; mast cells expressing TPSB2, MS4A2, and TPSAB1; and B cells expressing CD79A, CD37, and MS4A1.
To further dissect the major cell types, the cells belonging to each cell type were extracted with an “RNA” assay. Then, the cells from each sample were processed with sctransform and merged as described above. The subclusters were determined by repeating dimensionality reduction and unsupervised re-clustering. For cell types, subclusters were annotated to cell subtypes according to the top differentially expressed genes and biological functions. During the aforementioned re-clustering for epithelial cells, we also observed a small cluster, which was inferred to be doublets and removed for further analysis as described above.14,45
Single-cell copy number variation (CNV) analysis
Initial CNVs for each epithelial cell were estimated with the inferCNV package (version 1.6.0) of R with default parameters as described previously.11,46 The CNV scores of myeloid cells and T cells were calculated as a CNV control.
GSVA analysis
The relative pathways of each epithelial cluster were performed by GSVA R package (version 1.44.2) with the non-parametric and unsupervised algorithm. The signature gene sets of biological processes was derived from MSigDB gene ontology (GO) datasets.47
Signal entropy rate analysis
The SCENT R package (version 1.0.3) was performed to estimate the differentiation potency of each cluster.48 The signal entropy rate of single cells was calculated with default parameters.
SCENIC analysis
SCENIC analysis was performed as described above.49 We used the SCENIC R package (version 1.2.1) to calculate the AUCell scores of each identified regulon with recommended parameters. The heatmap was used to display the differentiated regulons of each cluster.
Trajectory analysis
Trajectory analysis was performed by using monocle3 R package (version 1.3.1) for epithelial cells.50 In the trajectory analysis, the batch effect was removed by running the align_cds() function. The analysis results, including pseudotime score and trajectory were merged into the UMAP graph. The CC AM cells were selected as the starting cells by running order_cells() function. The plot_cells() function was applied to visualize the cells.
Organoid culture
The AM tissues were shredded and incubated at 37 °C with Collagenase Type IV for 50 minutes (Stemcell, Cat#07909). After digestion was completed, 10 mL DMEM/F12 (Thermo Fisher Scientific, Cat#C11330500BT) was added to dilute the collagenase. The suspension was strained through a 100 µm sieve (Falcon, Cat#352360) and centrifuged at 1 000 r/min for 5 minutes. The pellet was resuspended in BioCoat MATRIGEL MATRIX (Corning, Cat#354234) mixed with organoid medium (1:1), and then the miscible liquid was plated on 24-well culture plates and placed in an incubator at 37 °C for 30 minutes. Organoids were cultured in self-configured medium. The medium contained DMEM/F12 (Thermo Fisher Scientific, Cat#C11330500BT), 1× B27 supplement (Thermo Fisher Scientific, Cat#12587010), 1.25 mmol/L N-acetyl-L-cysteine (Sigma, Cat#A7250), 10 mmol/L nicotinamide (Sigma, Cat#N0636), 50 ng/mL human EGF (PeproTech, Cat#AF-100-15), 500 nmol/L A83-01 (PeproTech, Cat#9094360), 10 ng/mL human FGF10 (PeproTech, Cat#100-26-5), 5 ng/mL human FGF2 (Sino Biological Inc, Cat#10014-HNAE), 1 μmol/L prostaglandin E2 (MCE, Cat#HY-101952), 0.3 μmol/L CHIR 99021 (Sigma, Cat#SML1046), 1 μmol/L forskolin (Abcam, Cat#ab120058), 50 ng/mL R-spondin (R&D Systems, Cat#3266-RS) and 25 ng/mL Noggin (PeproTech, Cat#120-10 C). To aid outgrowth of organoids, 10 μmol/L Rho-associated kinase (ROCK) inhibitor Y-27632 (TargetMol, Cat#T1725) was added to the medium after the first week.51,52 The medium was changed every 2–3 days, and the organoids were passaged every 1–2 weeks.
Tumorsphere formation assay
For the tumorsphere formation assay, cells were seeded into ultralow attachment plates and cultured in serum-free DMEM/F12 (Thermo Fisher Scientific, Cat#C11330500BT) supplemented with 1% B27 supplement (Thermo Fisher Scientific, Cat#12587010), 1% penicillin/streptomycin (Thermo Fisher Scientific, Cat#15140-122), human recombinant epidermal growth factor (20 ng/mL; PeproTech, Cat#PHG0311) and human recombinant basic fibroblast growth factor (20 ng/mL; PeproTech, Cat#100-18B-10) in a cultivation cabinet with 5% CO2 at 37 °C. The number and diameter of spheres were evaluated after 10 days.
Cell proliferation assay
For the cell proliferation assay, 1 000 cells were seeded in each well of a 96-well plate and cultured in a cultivation cabinet. The proliferation ability was assessed by using CCK8 reagent (Dojindo, Cat#CCK8-500). After every 24 hours, 10 μL reaction agent mixed with 90 μL DMEM was added to each well and incubated for 2 hours at 37 °C. A microplate reader (Infinite M200 PRO) was used to measure the optical density at 450 nm.
Colony formation assay
For colony formation, 2 mL of cell medium containing 1 000 cells was seeded in 6-well plates and cultivated for ~10 days. Then, the cells were fixed by using 4% paraformaldehyde (Biosharp, Cat#BL539A) for 30 minutes and stained with 0.1% crystal violet (Roles-Bio, Cat#RBG1019-100 mL). The colony numbers of each well were counted by using ImageJ.
Immunohistochemistry and H&E staining
The ameloblastoma samples were obtained from Guanghua School of Stomatology, Sun Yat-sen University. The tumors were fixed in 4% paraformaldehyde for 24 h, dehydrated, embedded in paraffin, and sectioned at 4 μm thickness. After dewaxing, the sections were subjected to heat-induced epitope recovery (Zsbio, Cat#ZLI-9065) and incubated in 3% H2O2 for 10 minutes. Then, the sections were washed and incubated with primary antibodies against KI67 (Novus, Cat#NB500-170; 1:200) and EZH2 (Cell Signaling Technology, Cat#5246 S; 1:200) overnight at 4 °C. After incubation with the secondary biotinylated antibody (Zsbio, Cat#PV-6001-18) for 40 minutes, horseradish peroxidase conjugation was carried out with a DAB kit (Zsbio, Cat#ZLI-9017). The scores of each sample were assessed via the staining intensity and area of tumor cells as described previously.25 For the H&E assay, paraffin-embedded tumor sections were stained with an H&E kit (Solarbio, Cat#G1120-100) following the manufacturer’s instructions.
Multiplex immunohistochemistry (IHC) staining
The ameloblastoma paraffin sections were stained using a multi-labeled immunohistochemistry staining kit (Akoya, Cat#NEL811001KT) according to the manufacturer’s protocols. Briefly, the sections were incubated in 3% H2O2 for 10 minutes for the first time. Every time the sections were incubated with primary antibodies, they were first subjected to heat-induced epitope recovery and blocked with 5% BSA. The HRP conjugate and three wavelengths (520, 570, and 650 nm) were then utilized to attach the different primary antibodies, which included PANCK (Proteintech, Cat#26411-1-AP; 1:1 000), CD3 (Proteintech, Cat#17617-1-AP; 1:800), CD34 (Abcam, Cat#ab81289; 1:800), CD68 (Abcam, Cat#ab213363; 1:800), FAP (Cell Signaling Technology, Cat#E1V9V; 1:800), ODAM (Affinity, Cat#DF13204; 1:800), KI67 (Novus, Cat#NB500-170; 1:800), SFRP1 (Abcam, Cat#ab126613; 1:800), HLA-B (Thermo Fisher Scientific, Cat#PA5-35345; 1:800), LAMC2 (Abcam, Cat#ab210959; 1:800), EZH2 (Cell Signaling Technology, Cat#5246 S; 1:800), and KRT13 (Proteintech, Cat#10164-2-AP; 1:800). Finally, the cell nuclei were stained with DAPI (Solarbio, Cat#C0065-50ml).
Immunostaining
The tumorsphere immunostaining assay was performed as described previously.53 All primary antibodies, including PANCK (Santa Cruz, Cat#sc-8018) and ODAM (Affinity Biosciences, Cat#DF13204-100ul), were used at dilutions of 1:200.
Flow cytometry and cell sorting
hTERT+-AM cells were stained with DiD dye (Thermo Fisher, Cat#V22887), according to the manufacturer’s directions. The DiD dye was lost as cells divided, which allowed highly proliferating cells to be identified and distinguished from slowly dividing cells.54,55,56 Briefly, 1 mL serum-free DMEM containing 1×10⁶ cells was incubated with DiD dye (1:200) at 37 °C for 10 minutes. After washing three times, the cells were plated in the sterile cell culture dishes and passaged every 2 days. After 10 days, the DiDhigh AM cells and DiDlow AM cells were sorted by a FACSVantage instrument (BD FACSAriaFusion) and used for the functional experiment.
siRNA transfection
AM cells were cultured in DMEM with 10% FBS as described above. For EZH2 siRNA transfection, 10 nM siRNAs were transfected with LipofectamineTM RNAiMAX Transfection Reagent (Thermo Fisher Scientific, Cat#13778150) according to the manufacturer’s protocols. The sequences of EZH2 siRNAs were 5′-CCAACACAAGUCAUCCCAUUATT-3′ and 5′-CCCAACAUAGAUGGACCAAAUTT-3′. The negative control was purchased from Sangon Biotech, and the sequence was 5′-UUCUCCGAACGUGUCACGUTT-3′.
Western blot
For western blotting, the proteins of AM were extracted using RIPA lysis buffer (Beyotime, Cat#P0013B). After separation by SDS–PAGE, the proteins were transferred to PVDF membranes. Then, the membranes were blocked with 5% milk at room temperature and incubated with primary antibodies overnight at 4 °C, followed by incubation with secondary antibodies for 1 hour. The following primary antibodies were used: EZH2 (Cell Signaling Technology, Cat#5246 S; 1:2 000) and GAPDH (Proteintech, 10494-1-AP).
RNA-seq analysis
For RNA-seq analysis, total RNA was isolated using TRIzol reagent (Thermo Fisher Scientific, Cat#15596018) according to the manufacturer’s protocols. The RNA was then qualified and quantified by using a NanoDrop and Agilent 2100 bioanalyzer (Thermo Fisher Scientific, MA, USA). RNA library preparation was performed by using the MGIseq-500 platform (MGI Technology, MGISEQ-500). The gene count matrix was acquired by comparison with GRCH38. The DEGs of RNA-seq were obtained by using the DESeq2 (version 1.28.1) package in R.
AI analysis
For artificial intelligence (AI) analysis, the Knowledge-primed neural networks (KPNN) analysis was processed as described before.30 Briefly, the expression matrix of ameloblastoma tumor cells of primary and recurrent samples was extracted. The node weights were then obtained by using the KPNN Python package (https://github.com/epigen/KPNN). The top 10 nodes with the most differential weights between primary and recurrent samples were used to show the results.
Statistical analyses
Data are shown as the mean ± SD. All statistical analyses were performed using R and GraphPad Prism 9 for Windows (GraphPad software, Inc.). In Figure Legends, the results of statistical analyses are explained. Several gene lists for the stem-like module were obtained from Wong’s study,28 Bhattacharya’s research27, and Sharir’s work.26 The gene oncology (GO) analysis was performed by Database for Annotation, Visualization and Integrated Discovery (DAVID) website (https://david.ncifcrf.gov/).


留言 (0)