
記住我
In this study, we focused on 33 patients with clinically suspected hereditary cancer syndromes, consisting of 11 familial adenomatous polyposis (FAP), 4 hereditary breast and ovarian cancer (HBOC), 4 retinoblastoma (RB), 4 Li–Fraumeni syndrome (LFS), 2 Lynch syndrome (LS), and 8 other syndromes (Table 1). Two FAP patients had signals of SVs in the APC gene from prior analyses (short-read target sequencing (NCC Oncopanel Test29,30), or multiplex ligation-dependent probe amplification (MLPA)), and were analyzed by TAS-LRS to elucidate the detailed form of the SVs precisely. In the two patients with RB, the presence of SVs involving the RB1 gene was known in advance by FISH and other methods, and TAS-LRS analysis was performed to identify the location of the breakpoints accurately. For 22 patients, high-coverage (range: 26.3×–31.7×) whole genome sequencing data by Novaseq 6000 platform were available.
Table 1 The cohort of patients who were sequenced with target adaptive sampling long-read sequencing in this studySummary of sequencing statisticsWe curated 147 cancer predisposition genes from the literature. To generate the BED file specifying a target region, the maximal regions of all the corresponding transcripts registered in the GENCODE Basic gene annotation Release 38 with a margin of 10 kbp for each gene were set. For the APC gene, two starting exons, Exon 1A and Exon 1B, have been identified, and both are implicated to have important functions31,32. However, transcripts including Exon 1B were not included in the GENCODE Basic gene annotation release 38. Therefore, we manually expanded the APC region to include Exon 1B. The resulting target region size was 16,122,639 bp (see Supplementary Data 1). For these target regions, we performed sequencing with GridION (see the “Methods” section for details).
The median depth of on-target and off-target regions were 21.9 (range: 5.0–44.2) and 2.1 (range: 0.67–6.3), respectively. The median enrichment of the on-target regions compared to the off-target regions was 10.4 (range: 5.5–14.5) (Fig. 2a). 17 out of 33 samples had 20× or greater depth of coverage over 50% of the target regions (Supplementary Fig. 1). After reviewing the coverage for each gene, we found no gene with exceptionally low coverage (Supplementary Fig. 2). Two samples had an average depth of coverage of <10×, compromising the accuracy of subsequent analyses, including mutation detection. The read N50 of on-target and off-target regions were 9159 (range: 5330–11,885) and 598 (range: 475–635) (Fig. 2b), respectively.
Fig. 2: Quality check summary of TAS-LRS sequencing data.
a Sequence coverage of on-target and off-target regions and the concentration ratio (ratio of on-target to off-target coverage) for each sample. Samples were ordered by on-target coverage. b N50 statistics calculated for on-target and off-target regions for each sample. Samples were ordered by on-target N50 values.
Evaluation of SNVs/Indels detectionA median of 15,398 (range: 8,633–16,982) SNVs/Indels were detected in the target regions in TAS-LRS. To evaluate the accuracy of the detection of SNVs/Indels, we compared the detection between TAS-LRS and high-coverage whole-genome short-read sequence (WG-SRS) for 22 cases where matched WG-SRS data were available. For SNVs, the results of the TAS-LRS and WG-SRS were fairly consistent. Setting the SNVs identified from the WG-SRS platform as golden datasets, the median recall and precision for TAS-LRS were 98.8% (range: 90.0–99.4%) and 98.2% (range: 94.9–98.5%), respectively (Fig. 3a). The recall of SNVs decreased as the depth of coverage decreased (Supplementary Fig. 3), as demonstrated by one case with very low sequence coverage. On the other hand, regarding Indels, the results for the TAS-LRS and WG-SRS were largely different, probably because slippage errors are much more abundant in Oxford Nanopore Technologies compared to the Illumina-based short-read platform (Fig. 3b).
Fig. 3: Summary of SNVs/Indels detected in the target region.
a, b The number of SNVs (a) and Indels (b) for each sample stratified by whether they were detected by TAS-LRS, WG-SRS, or both. c Venn diagram showing the categories of putative pathogenic variants identified (known pathogenic, loss-of-function, and splicing variants). See also Supplementary Fig. 3.
Extraction of candidate pathogenic SNVs/IndelsFrom the list of SNVs/Indels detected in the target regions, we extracted candidate pathogenic variants by combining various information such as population allele frequencies, registries of known relationships among variants and diseases (ClinVar33), and functional prediction tools (see the “Methods” section for detail), and 14 putative pathogenic variants were identified (Fig. 3c, Supplementary Fig. 4). Two variants were known pathogenic variants registered in ClinVar. Five were high confidence loss of function variants according to LOFTEE34. Nine were predicted to cause aberrant splicing. There were two variants belonging to two categories (Supplementary Data 2). Although these putative pathogenic variants were generally detected by previously performed analyses (NCC Oncopanel Test and WG-SRS), we would like to highlight some potential pathogenic SNVs below.
In a clinically suspected multiple endocrine neoplasia type 2 (MEN2) case (S11), we identified a potential splicing variant in the EPCAM gene (c.556-14A>G), which has been registered as “pathogenic” with two stars in the ClinVar (Supplementary Fig. 5a). Furthermore, we identified polymorphisms G691S/S904S in the RET gene, whose modifier effects on MEN2 have been investigated in several previous studies35,36. Therefore, a combination of heterogeneous effects of various mutations might produce symptoms in this patient.
In a patient with clinically suspected Hereditary Diffuse Gastric Cancer (S35), we detected a G258E missense variant in the MUTYH gene, which is annotated as “Pathogenic/Likely pathogenic” with two stars in ClinVar (Supplementary Fig. 5b). Although impaired glycosylase activity was demonstrated by functional assay for this variant37, MUTYH is generally considered to be autosomal recessive, and the other mutation has not yet been detected. The association between this mutation and the disease needs to be further investigated.
We also identified a missense mutation in A189V in the TP53 gene in a clinically suspected LFS patient (S27), which is registered in ClinVar as “Conflicting interpretations of pathogenicity .” This variant showed relatively high minor allele frequency in East Asian cohorts (1.77 × 10⁻³ in ToMMo 38KJPN database38, and 5.46 × 10⁻⁴ in Korea 1K) compared to worldwide cohorts (6.57 × 10⁻⁶ in gnomAD v3.1.234). The odds ratios for this variant were modest (1.7–1.8) in the previous Japanese breast and colorectal cancer cohort study39,40. Therefore, the A189V variant in TP53, if any, would have only low penetrance pathogenicity.
Overview of potentially functional SV detectionApplication of nanomonsv and a false-positive SV elimination filter (see the “Methods” section for details) yielded a total of 44 SVs. Furthermore, subsequent putative pathogenic SV extraction (in short, extracting SVs disrupting coding sequences, see the “Methods” section for detail) nominated 12 SV breakpoint junctions, two of which were identified as single breakend SV and were in the intron region of the APC gene (Supplementary Data 3 and 4). In fact, all of them involved RB1 in two RB patients (S3 and S38) or APC in two FAP patients (S2 and S37) (Supplementary Figs. 6 and 7). In the following, we describe a novel clarification provided by TAS-LRS compared to previous tests.
Our analysis resolved a complex intrachromosomal balanced translocation affecting the RB1 gene and the LRMDA gene and identified precise breakpoints, consistent with the one identified by WG-SRS analysis (Fig. 4a). S38 had been inferred to have deletions of exons 21–27 (last exon) via MLPA. We showed a large deletion of 44,362 bp extending from the 20th intron of the RB1 gene to the adjacent RCBTB2 gene with exact breakpoint coordinates (Fig. 4b).
Fig. 4: Schematic representation of structural variations of the RB1 gene in two patients with Retinoblastoma.
a A balanced translocation involving RB1 detected in S3 consists of two interchromosomal junctions. One junction connects breakpoint 1 (in the 2nd intron of the RB1 gene) and breakpoint 4 (in the 6th intron of the LRMDA gene), and the other junction juxtaposes breakpoint 3 (in the 17th intron of the RB1 gene) and breakpoint 4 (in the 6th intron of the LRMDA gene). Approximately 54 kbp region between breakpoint 1 and breakpoint 2 in the RB1 gene was deleted. b A deletion spanning a 44 kbp region spanning from the 20th intron of the RB1 gene to the 10th intron of the RCBTB2 gene.
Multi-gene panel testing and MLPA had shown partially identified signals indicating SVs on APC in S37. However, the overall structure had not yet been elucidated. Our analysis based on TAS-LRS detected two SV breakpoint junctions constituting reciprocal inversions accompanied by 130 kbp deletion. In the other patient with FAP (S2), a reciprocal translocation involving a breakpoint in the APC gene was identified (Supplementary Fig. 8).
Two SVA insertions affecting APC in FAP patientsWe further searched the list of 44 SVs in the phase immediately following the false-positive SV elimination filter, focusing in particular on those affecting genes that are well known to be associated with the predicted diseases. This search found a 2731 bp insertion, which matched to SINE-R/VNTR/Alu (SVA) by RepeatMasker41, in the 9th intron of the APC genes in a patient of strongly suspected FAP (Fig. 5a). SVA is a class of recent mobile elements found only in primates. Mobile element insertions including SVA can cause disease typically by inactivating gene function through abnormal splicing42,43. Previous studies have found a number of diseases derived from SVA insertions. Although LINE1, another class of mobile element insertion, has been identified in familial adenomatous polyposis44,45,46, there has been no study that finds SVA insertion in FAP patients as far as we know. The whole transcriptome sequence performed on the same patient revealed significant and specific intron retention at the near exon–intron boundary, implicating the pathogenicity of the SVA insertion in this patient (Fig. 5b).
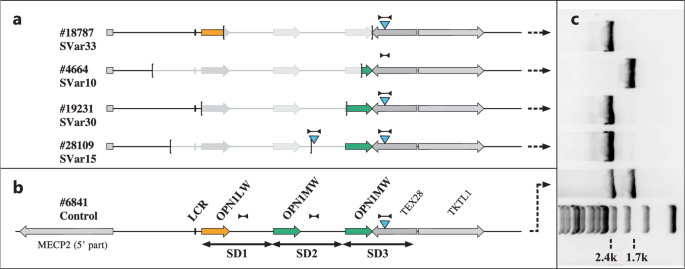
Fig. 5: Details of SVA-derived insertion into the intronic region of the APC gene in two patients with familial adenomatous polyposis.
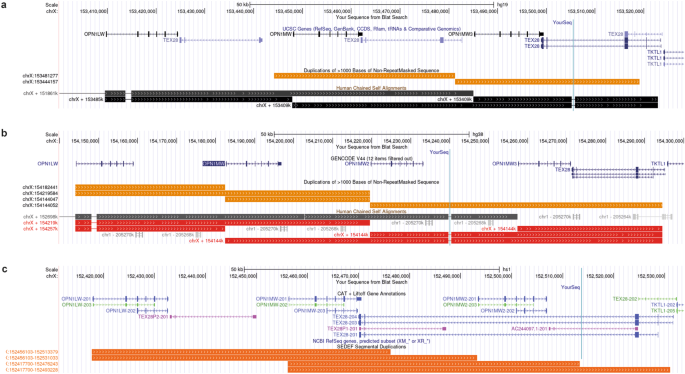
a The IGV displayed long-read sequencing data and transcript sequencing data showing an SVA-derived insertion of 2731 bp in the 9th intron of the APC gene. b The whole transcriptome sequence showed specific intron retention at the near exon–intron boundary. c An SVA inserted into the 9th intron of the APC gene in patient S5, derived from two concatenated human-specific subfamily SVA_F elements located at 6a22.31, which undergoes 5´ truncation and poly(A) tail addition prior to insertion. d An SVA inserted into the 8th intron of the APC gene in patient S36, derived from concatenated SVA_D and SVA_E elements located at 12p13.31, which undergoes poly(A) tail addition prior to insertion.
Next, we investigated the source site by alignment of the polished SVA sequence (inferred by Racon47 integrated into nanomonsv) to the reference genome using BLAT48. The SVA strongly matched the sequence of a region on chromosome 6 (chr6:122,847,699–122,850,317), consisting of two adjacent SVA_F sequences (chr6:122,849,195–122,850,317, chr6:122,847,781–122,849,162) and 82 bp 3′ transduction (chr6:122,847,699–122,847,780), accompanied by a 24 bp polyadenylation tail and 14 bp target site duplication (Fig. 5c). The 3′ transduction also contained the predicted conserved polyadenylation signal AATAAA. Since the 5′ end of SVA_F ((CCCTCT)n repeats that are necessary for retrotransposition49,50) is truncated, the inserted SVA sequence into APC is thought to have already lost its trans-mobility capability.
Motivated by this finding, we further investigated other mobile element insertions by manually investigating the BAM files and identified another 2678 bp SVA insertion in the 8th intron of the APC gene in another FAP patient (Supplementary Fig. 9). This inserted sequence was inferred to be derived from a region of chromosome 12 (chr12:8,624,237–8,626,878), which consists of SVA_D (chr12:8,624,321–8,625,515), SVA_E (chr12: 8,625,529–8,626,786), and 91 bp of the 3′ transduction (which included polyadenylation signal), followed by 55 bp polyadenylation tail and 15 bp target site duplication (Fig. 5d).
Verification of genome-wide common SNP genotyping from sequence data from off-target regionsThe TAS-LRS provides low-coverage sequencing data even in the off-target regions. There have been several attempts to genotype SNPs genome-wide using off-target sequence data. However, these studies were mostly performed using short-read platforms with few sequence errors, and only a few attempts have been made on error-prone long reads51. Here, we focused on genotyping of common SNPs across the genome (mostly off-target regions), using data from long-read while making the most of off-target reads that would otherwise be discarded.
We performed genome-wide common SNP genotyping on TAS-LRS using GLIMPSE28 with a reference panel consisting of 8570 Japanese genomes from the National Center Biobank Network (NCBN)52 project as well as 3202 genomes from 1000 genomes. The total number of SNPs in the panel was 39,201,938. The number of SNPs genotyped by GLIMPSE for each patient was a median of 1,750,570 (range:1,509,006–1,757,025). The median concordance with WG-SRS was 99.8% (range: 92.0–99.9%) (Fig. 6a, Supplementary Fig. 10), showing that common SNP genotyping utilizing low-coverage sequencing reads in the off-target region is fairly accurate in most cases.
Fig. 6: Comparison of genome-wide common SNP genotyping by TAS-LRS (imputation of low-coverage off-target sequencing data using GLIMPSE) compared to WG-SRS (direct variant calling on high-coverage whole-genome sequencing data by GATK).
a Imputation accuracy of TAS-LRS was measured on chromosome 1 for each minor allele frequency range. Genotyping by WG-SRS was used as the golden standard. See also Supplementary Fig. 9. Box plots show medians (lines), interquartile ranges (IQRs; boxes), ±1.5 × IQRs (whiskers), and outliers (dots). b PCA of genotype results from both TAS-LRS and WG-SRS for each individual (distinguished by color). Pairs of the same individuals are clearly clustered, indicating that the batch effect of the difference between the TAS-LRS and WG-SRS platforms has effectively disappeared. One outlier sample that could have originated from different ancestries was excluded. See also Supplementary Fig. 10. c Comparison of PRSs for three cancers calculated from the genotype by TAS-LRS (X-axis) and WG-SRS (Y-axis). Each point indicates each sample and each color indicates each syndrome name (red: Familial adenomatous polyposis, blue: Familial pancreatic cancer, green: Hepatic angiomyolipoma, purple: Hereditary breast and ovarian cancer, orange: Li–Fraumeni syndrome, yellow: Lynch syndrome, brown: multiple endocrine neoplasia type 1, pink: multiple endocrine neoplasia type 2, gray: PTEN hamartoma tumor syndrome, black: Retinoblastoma).
We evaluated the performance of downstream analyses using genotyping results obtained from the above procedure. The result of the principal component analysis (PCA) for the genotype data from both TAS-LRS and WG-SRS showed that identical individuals were strongly clustered, indicating that the batch effect from the platform difference was effectively removed (Fig. 6b, Supplementary Fig. 11). Next, we calculated a polygenic risk score (PRS) using GWAS summary statistics data53 related to various cancer types in the Japanese population and examined the correlation between the scores from TAS-LRS and WG-SRS. PRS calculated by the two platforms showed a strong correlation. The median Pearson correlation for the 12 carcinomas was 0.989 (range: 0.976–0.997) (Fig. 6c, Supplementary Fig. 12). These results indicate that genome-wide common SNP genotyping using discarded off-target reads from TAS-LRS is sufficiently accurate for many downstream analyses, such as PRS calculation.
To further validate our findings, we assessed genotyping accuracy using low-coverage ONT sequencing data with the widely recognized HG001 sample, employing down-sampling. We consistently demonstrated that precise genotyping is possible from low-coverage ONT sequencing data (Supplementary Fig. 13). At the same time, we observed that genotyping accuracy changes with depth, showing significant differences between 1× and 2×. This observation suggests potential advantages in incorporating periods without specific target sampling in adaptive sampling. Furthermore, we also validated using another tool called QUILT51. The results were of comparable accuracy to GLIMPSE. However, there is still room for optimization in the future, such as the choice of software, parameter tuning, and refining the reference panel.
MLH1 epimutation in a patient of Lynch syndrome identified via allele-specific methylation analysisAn important advantage of the Oxford Nanopore Technologies sequencing data is that epigenetics modifications such as methylation can be obtained for each sequence read and position. Furthermore, by combining the genome-wide genotype obtained in the previous section, which also includes phasing information, it is possible to classify each sequence read by haplotype and obtain allele-specific methylation information. We have implemented a workflow to automatically identify allele-specific methylation regions where the methylation ratios significantly differ from those of 10 control samples (see the “Methods” section for details).
Our analyses revealed constitutional MLH1 epimutation54,55 in a patient diagnosed with Lynch syndrome. Although this patient tested positive for microsatellite instability using tumor samples, no germline mutation was detected in the multi-gene panel testing. As shown in Fig. 7a, we visualized the allele-specific methylation status of this patient using our workflow. Our workflow revealed that one allele of the MLH1 exhibited hypermethylation in the promoter region, suggesting that the MLH1 gene expression is reduced in one allele. Based on the above, the patient was suspected of MLH1 epimutation for the first time. Through immunohistochemistry, we observed not only the loss of MLH1 but also of PMS2 protein, recognizing the typical pattern of Lynch syndrome due to MLH1 loss (Fig. 7b). This is because PMS2 forms a heterodimer with MLH1 and is more prone to degradation when MLH1 is absent.
Fig. 7: A case of an MLH1 epimutation in a patient with LS.
a Alignment view of around the promoter region of the MLH1 gene. Each read was classified as haplotype 1 or 2 using Whatshap software. The CpG sites of each read are colored red if methylated and blue if not. It can be clearly seen that methylation is increased specifically for haplotype 2. b Immunohistochemical staining for DNA mismatch repair protein performed on cancer tissue from patient S33. Loss of immunohistochemical expression of MLH1/PMS2 was observed. Scale Bar = 100 μm.
Also, we detected a patient with FAP, which showed abnormal hypermethylation in the first intron region of the BARD1 gene. However, their relevance to the disease remains to be investigated (Supplementary Fig. 14).
留言 (0)