AP-7D
The AP-7D was co-developed by HTAisaLink and the Center for Outcomes Research and Economic Evaluation for Health (C2H), National Institute of Public Health (NIPH) in Japan, and was established based on East and Southeast Asian concepts of health and health-related impacts. Our new PBM comprises seven domains: pain/discomfort (PD), mental health (MH), energy (EN), mobility (MO), work/school (WS), interpersonal interactions (II), and burden to others (BO), each of them classified on a four-grade scale (not at all, a little, quite a bit, and very much). AP-7D was originally developed in English and then translated into eight local languages. The instrument is shown in the Supplement.
Composite TTO, Simple DCE, DCE with duration, and ternary DCE
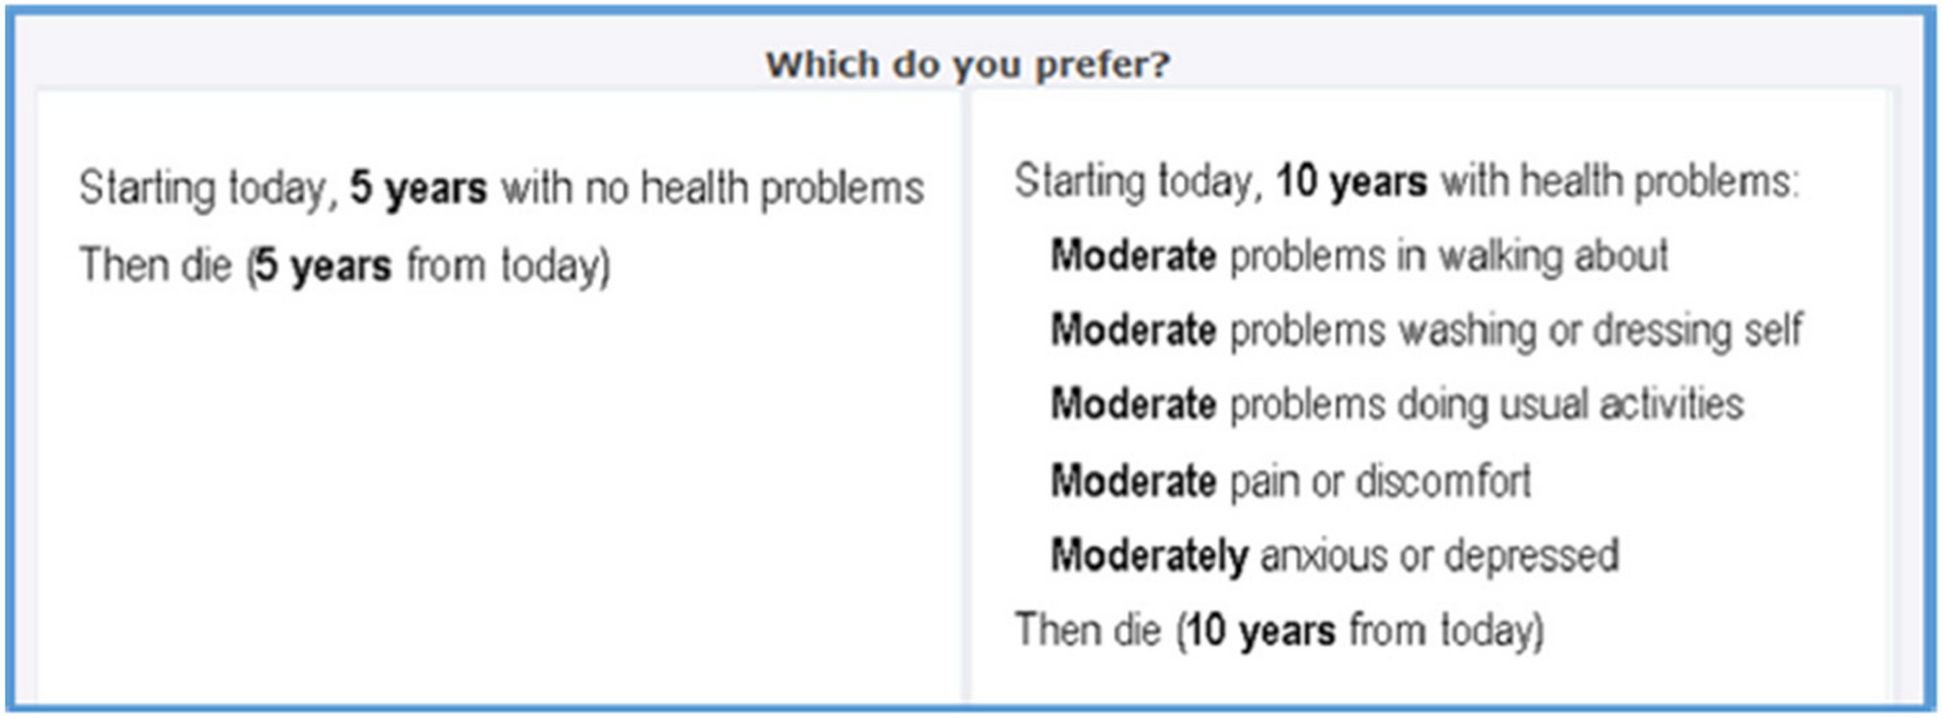
We evaluated the AP-7D health states using the composite TTO (cTTO) [14], simple DCE [15], DCE with duration, and ternary DCE methods [16]. The TTO survey respondents always began with a conventional TTO task, i.e., living for 10 years in a health state described by the AP-7D, or living for x years in full health. If they considered the presented AP-7D state to be better than immediate death (i.e., x > 0), the value of x was varied until indifference was reached and the value of the AP-7D state was x/10. If the participants considered immediate death to be better than living for 10 years in the AP-7D state (i.e., x < 0), a lead time TTO [17] was started, which allowed estimation of negative values. In lead-time TTO, a set of choices is offered between “y years of life in full health” and “10 years in sound health followed by 10 years in the presented AP-7D state”. The value of y was varied until indifference was reached and the value of the AP-7D state was (y-10)/10.
The DCE method presented two health states (A and B) described by AP-7D. In the case of DCE with duration and ternary DCE, expected life-years (1, 4, 7, and 10 years) were combined with the AP-7D description. In the simple DCE and DCE with duration methods, the respondents chose the option they preferred between the two given choices. In the ternary method, three health states (state A, state B, and “immediate death”) were shown to the respondents, and they were asked to identify what they believed were the best and the worst health states.
Face-to-face survey for cTTO
A face-to-face survey was conducted to collect the cTTO data. Respondents (aged 20–69 years) were recruited through a panel owned by a research company, based on non-random quota sampling by sex and age. Those aged 20–69 years were included. As it was challenging to recruit elderly people for this survey during the COVID-19 outbreak considering a high risk for contracting COVID-1, respondents aged > 69 years could not be recruited for valuation of AP-7D.
The target sample size was approximately 1,000. This was not based on the number of subjects included in the EQ-5D-5L valuation survey. The respondents were asked to visit a survey center in Tokyo. Computer-assisted personal interviews (CAPI) was performed with the interviewers’ support in a one-on-one, 60-min session at the survey center.
We prepared 14 blocks, and each block included 8 cTTO tasks based on an orthogonal design. The block by orthogonal design was generated by Ngene, which considers D-error minimization. Each respondent was randomly allocated to one block. The three training TTO tasks were completed before the actual TTO tasks [18]. The health states for the block were shown in random order. Responses were automatically collected as electronic data.
Online survey for DCE
An online survey was conducted to collect DCE data, including simple DCE, DCE with duration, and ternary DCE. Respondents (aged 20–69 years for consistency with the face-to-face population) were recruited through a Japanese web panel, based on quota sampling by sex and age. The target sample number was approximately 2,500 for each of the DCE valuation methods, namely, simple DCE, DCE with duration, and ternary DCE. Each block had 15 pairs, and each respondent was randomly allocated to 10 blocks, based on the D-Optimal design methods in NGene. The health state pairs in the block and position of the cards (left or right) were shown in random order to prevent ordering and positioning effects.
Statistical analysis
We calculated the numbers and percentages for the background factors, which were then compared with the norm data. The total time taken to complete all the 8 TTO or 15 DCE tasks was also calculated.
a) cTTO
Responses to the TTO task were converted into TTO scores as described in the subsection of”Composite TTO, simple DCE, DCE with duration, and ternary DCE”. The data were analyzed using a linear mixed model with “1-utility” as the dependent variable. The constant term and dummy variables representing the levels of the seven dimensions (7 × [4 − 1] = 21) were treated as fixed effects, and the respondents were treated as random effects. Interaction with any level 4 responses was considered by adding the N4 term (N4 = 1, if any level 4 responses were included in the health states) to the normal linear mixed model. The N34 term was also similarly defined (N34 = 1, if any level 3 or 4 responses were included in the health states) to consider the effects on the worst health states, which were observed in the EQ-5D-3L and -5L valuation surveys in a few countries. In addition, the TTO score was censored at 1. Considering these distribution characteristics, the Tobit model was also used for the cTTO data.
b) Simple DCE
The DCE data were analyzed using a simple and panel conditional logit model with the same 21 dummy variables as in the cTTO model. Similar to the case in the cTTO analysis, N4 and N34 terms were also considered in the conditional logit model. These analyses extracted the latent coefficients for AP-7D scoring. The DCE latent “dis-score,” defined as the sum of the latent DCE coefficients for each health state, was converted to the utility scale.
To convert the latent DCE scores to a scale anchored at full health (1) and death (0), the modeled DCE values were anchored using the observed cTTO values. The linear relationship function between the mean latent DCE scores and mean cTTO values of the 112 health states measured in this face-to-face survey were estimated. Finally, the DCE coefficients were transformed by the estimated linear mapping function.
c) DCE with duration and ternary DCE
A simple and panel conditional logit model with or without N4 or N34 interactions was used to analyze the choice tasks, similar to the case for the simple DCE data. In the case of ternary DCE, a task was separated into two dichotomous choices and in the immediate death profile, the duration was treated as 0. For both types of the DCE data, the model for the estimation of coefficients was based on Bansback et al. [19] and included continuous duration (time) as well as interaction between the duration and each domain. Assuming t to be the duration and uij to be the utility of profile j for individual i, uij can be formulated as follows:
$$\mathrm }=\upbeta _\mathrm }+ }_\mathbf\mathrmt_ }+\mathrm}$$
where εij denotes the error term. However, the estimated β2, which indicates the vector of all the DCE coefficients in each domain, is not anchored to death (0) or full health (1). To change the latent coefficients to the disutility of each level, we divided the ratio of estimated β2 (vector) by the coefficients of time (β1, scholar).
If the estimated disutility was not consistent (consistency implied that “weights at the higher level in the same domain were higher and those at the lower level were lower”), inconsistent levels were combined and was similarly analyzed by the same model (“constrained” model).
These analyses were performed using SAS 9.4 and Stata 17.


留言 (0)