
記住我
Chronic low back pain is the most prevalent chronic pain condition among adults worldwide.18 Patient education on pain self-management and multisession cognitive behavioral therapy (CBT) are recommended as first-line treatments for back pain,17 and the National Institute for Health and Care Excellence (NICE) guidelines recommend CBT integration into comprehensive care plans.27 Often, group-based CBT for chronic pain is delivered over eight 2-hour sessions (16 hours total treatment time). Content includes pain education, self-regulatory skills training, problem-solving and action planning, and home practice between sessions. Rigorous back pain studies8,38 and chronic pain meta-analyses41 suggest CBT has small-to-moderate effects for multidimensional symptom reduction in chronic pain. However, multiple barriers prevent broad access to CBT, such as physician referral, lack of insurance in the U.S., lack of trained professionals, extensive wait times, and burdens associated with multisession treatment.11,25 Effective briefer options could ease care barriers, facilitate the implementation of recommended guidelines, and scale best practices to treat chronic low back pain.
Empowered Relief (ER) is a 2-hour single-session pain relief skills intervention that includes cognitive behavioral skills acquisition, mindfulness principles, and pain neuroscience education.10,12,13 Previously, we conducted a three-arm randomized controlled trial in 263 community adults with chronic low back pain in which we compared 2-hour ER, a 2-hour back health education (HE) class, and an 8-session back pain CBT protocol (16 hours of total treatment time).7,8 In this trial, pain catastrophizing, a cognitive and emotional pain response pattern that includes increased attention, and feelings of pain helplessness, was selected as the primary outcome because of its impacts on the intensity and trajectory of chronic pain6,39 and responsiveness to CBT.38,40,41 Results revealed noninferiority in outcome potency of a 2-hour pain relief skills intervention compared with a standard course of an 8-session CBT at 3 months posttreatment. Specifically, ER was noninferior to an 8-session CBT for reducing pain catastrophizing, pain intensity, pain interference, pain bothersomeness, fatigue, sleep disturbance, anxiety, and depression; across variables, ER and CBT had moderate-to-large treatment effects that were superior to HE at 3 months.13 Such findings suggest that for some patients, brief psychosocial pain interventions may represent satisfactory alternatives to more lengthy and resource-intensive treatment, at least in the short-term. Evidence of extended efficacy of 1-session ER could inform broad treatment adoption in clinical practice, resource allocation, and third-party payer reimbursement in the U.S.
Accordingly, the current report describes 6-month outcome data for our three-arm randomized comparative efficacy trial. First, we examined whether ER retained noninferiority to CBT and superiority to HE on baseline to 6-month posttreatment changes for primary and secondary outcomes. Results of these analyses also would indicate the relative position of an 8-session CBT and brief ER with respect to maintenance of longer-term effects. We hypothesized that at 6 months posttreatment, ER and CBT would be superior to HE and that ER would maintain noninferiority with CBT. Second, we examined the degree to which ER showed increments or decrements in outcome values from 3 months to 6 months posttreatment. Results of these analyses would indicate the degree to which effects of brief ER changed or maintained their absolute position from 3 months to 6 months posttreatment.
2. MethodsWe conducted this three-arm randomized comparative efficacy trial at a single academic site in the San Francisco Bay Area after trial preregistration4 and the published protocol.12 The trial tested for noninferiority in comparing a 1-session ER vs an 8-session CBT and superiority in comparing a 1-session ER vs a 1-session HE and an 8-session CBT vs a 1-session HE. The study protocol followed the Consolidated Standards of Reporting Trials (CONSORT) reporting guidelines on noninferiority trials (Fig. 1),31 was approved by Stanford's institutional review board, included a data and safety monitoring board, and the trial was overseen by an independent monitoring agency appointed by the National Institutes of Health.
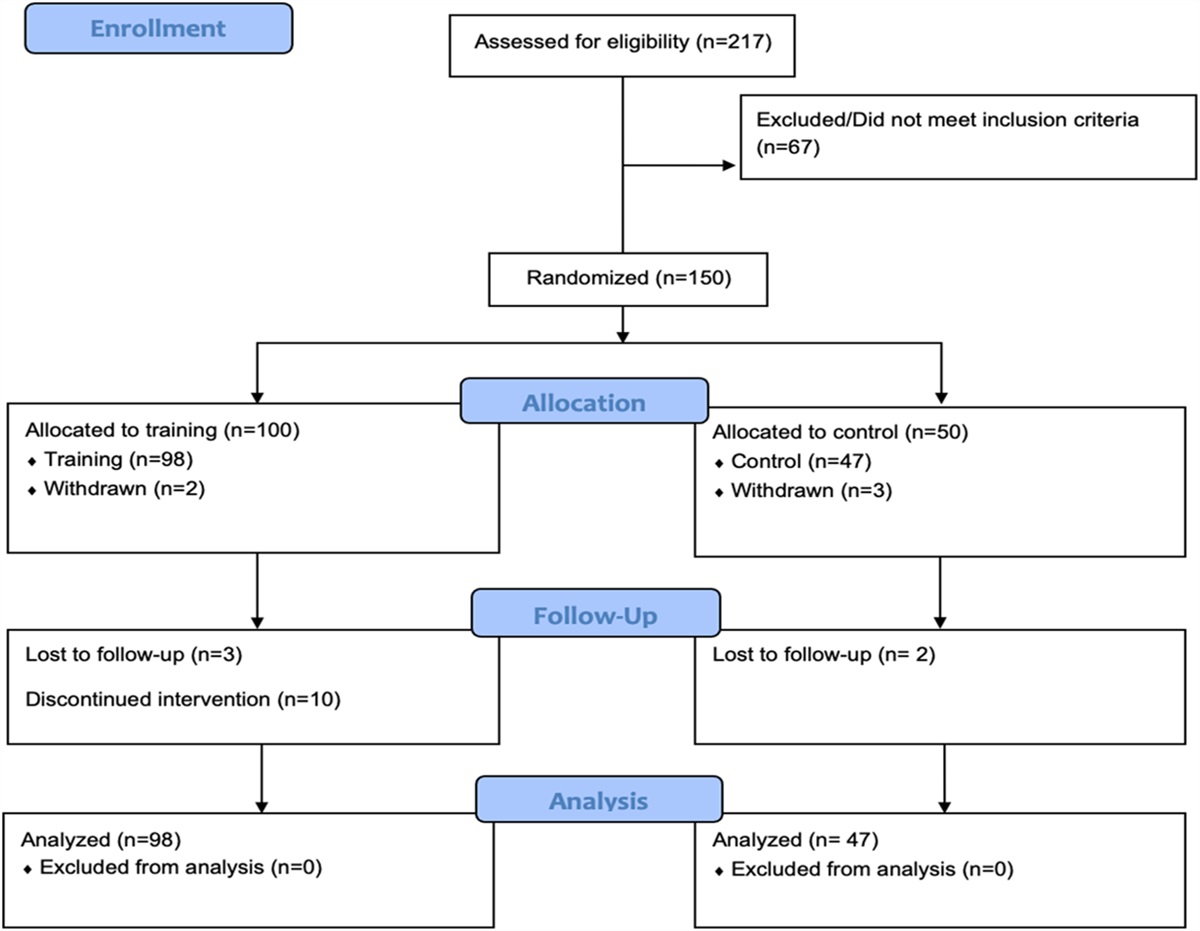
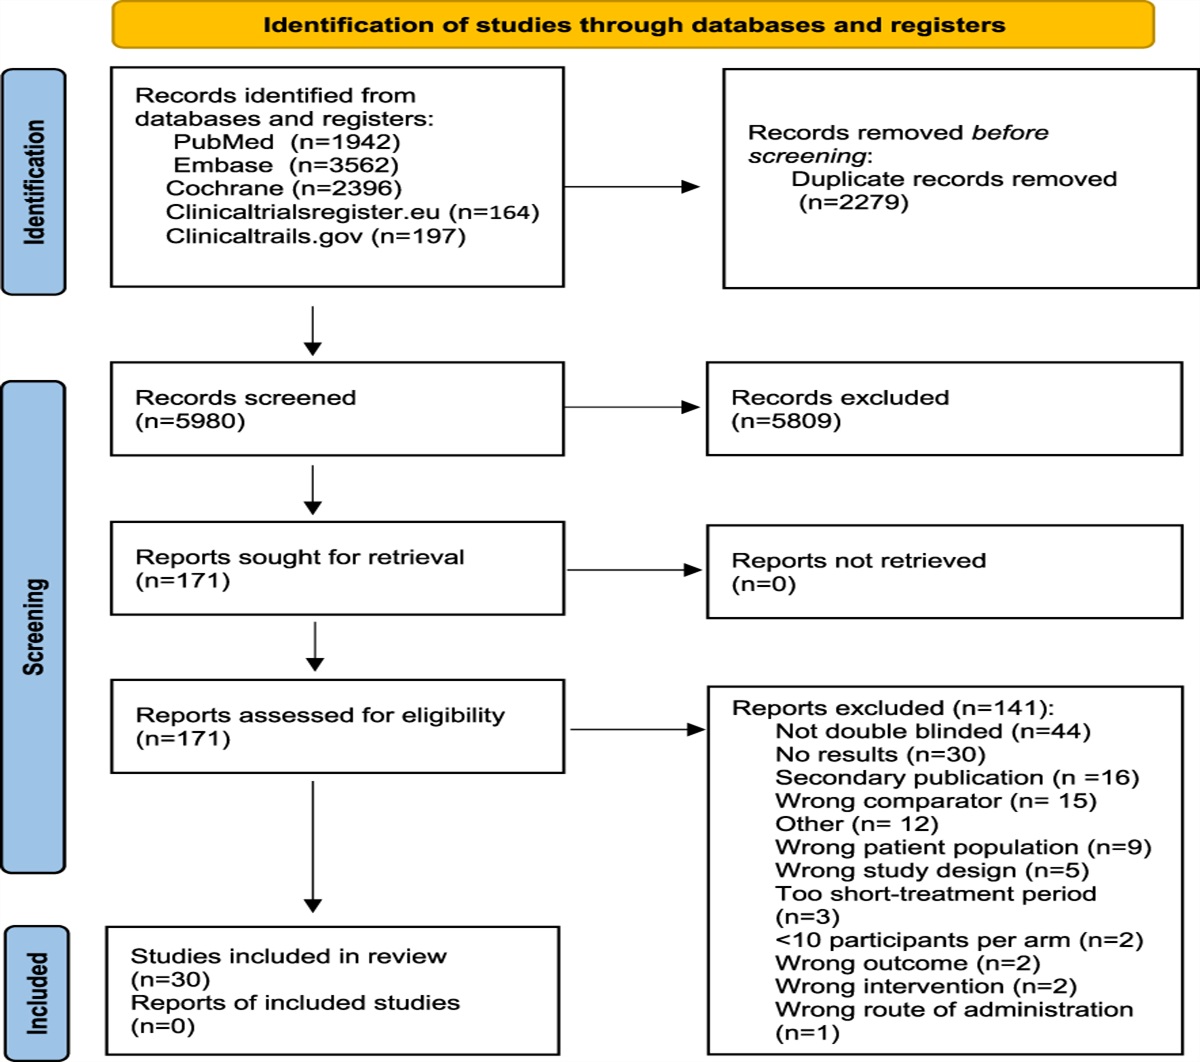
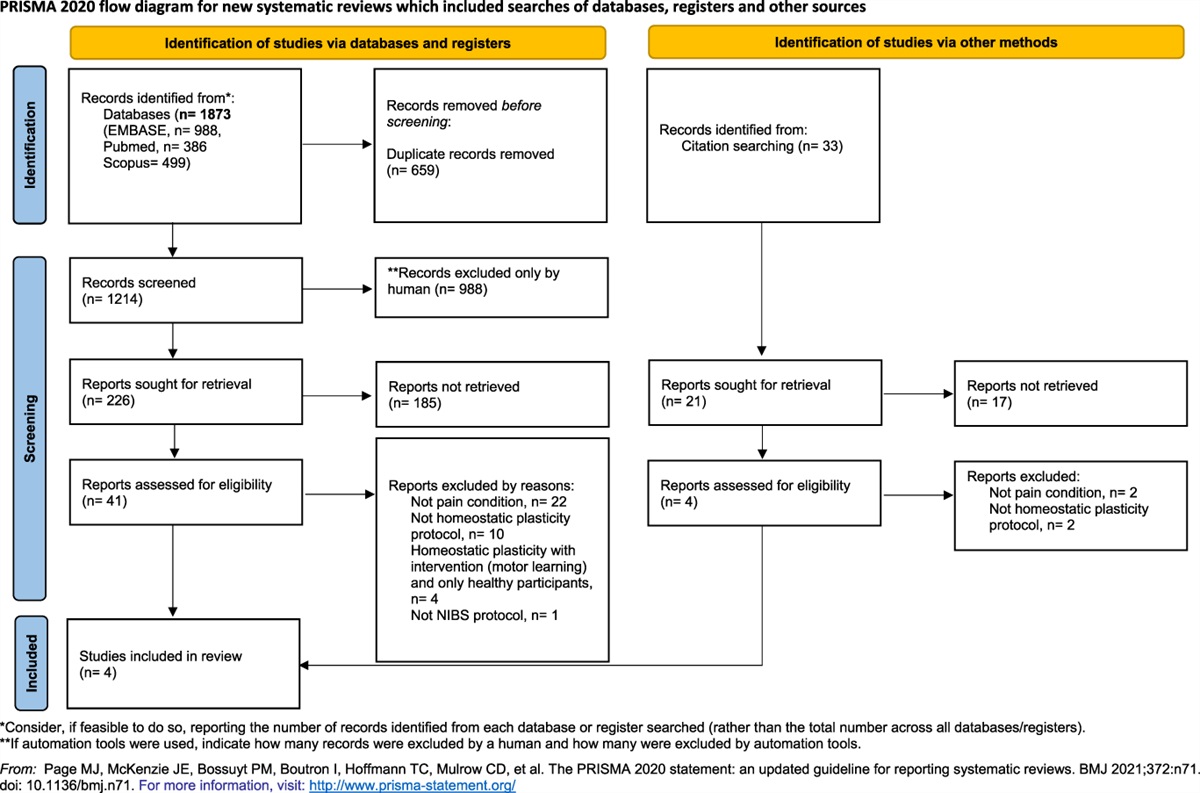
 Figure 1.:
 CONSORT diagram to 6 months posttreatment. CBT, cognitive behavioral therapy; ER, Empowered Relief; HE, health education.
2.1. ParticipantsWe recruited participants from the community and clinics with advertisements for a no-cost, nondrug study involving 3 class-based treatments for chronic low back pain. Total compensation of USD $300 was possible for completing the study surveys.
We enrolled adults (aged 18–70 years) who met the NIH task force criteria for axial low back pain experienced on at least half of the days in the previous 6 months14 with an average pain intensity ≥4/10 and a Pain Catastrophizing Scale34 score ≥20 (moderate). Additional inclusion criteria were English fluency and the ability to attend up to eight 2-hour treatment sessions (in the event they were randomized to the CBT treatment group). Exclusion criteria included gross cognitive impairment, radicular symptoms, previous receipt of ER or CBT in the past 3 years, current substance use disorder, medicolegal factors, suicidal ideation, or severe depression (assessed with MINI 7.0 to screen,33 the Beck Depression Inventory-II for severity grading,5 and the Structured Clinical Interview for DSM-5 for diagnostics).16 Informed consent was obtained before enrollment.
2.2. OutcomesConsistent with the published original NIH study protocol and CT.gov registration, the primary outcome for the noninferiority and superiority analyses was the 13-item Pain Catastrophizing Score,34 which measures the frequency of various cognitive or emotional responses to pain (eg, There's nothing I can do to reduce the intensity of my pain). Responses range from 0 (not at all) to 4 (all the time), and sum scores range from 0 to 52. The PCS is widely used in pain research and has good psychometric properties with clinic and community samples,29,30 including a high internal consistency (alpha = 0.87) and test-retest reliability (r = 0.75).34
Priority secondary outcomes included average pain intensity over the previous 7 days [range: 0 (no pain) to 10 (worst pain imaginable)]15 and PROMIS pain interference; other secondary outcomes included sleep disturbance, pain behavior, depression, anxiety, physical function, and fatigue (all evaluated with the National Institutes of Health [NIH] Patient-Reported Outcomes Measurement Information System short-form measures)1,19; pain bothersomeness during the previous 7 days [range: 0 (not at all bothersome) to 10 (extremely bothersome)]8,38; and pain self-efficacy via the Pain Self-Efficacy Questionnaire [range: 0 (not at all confident) to 6 (completely confident)].28
2.3. Randomization and investigator blindingWe randomly assigned participants to receive ER, HE, or CBT via Research Electronic Data Capture20 with no blocking applied. After randomization, individual treatment group allocations were revealed to participants and the study staff (project manager, study coordinators, and treatment instructors). All participants were told they were assigned to an active treatment for back pain, and HE participants were told they were receiving a back pain education class. The principal investigators, coinvestigators, and statisticians remained blinded to individual treatment group assignment until the three-month data were received. No efficacy analyses were performed before all 3-month data were collected.
Participant identification was protected with a unique study identification number. All data were received electronically, instantly locked in the database, and stored with double-password protection. Six-month posttreatment data collection was finalized in June 2020.
2.4. Study group interventionsWe delivered treatments to small group cohorts of up to 12 participants in size for all 3 study groups. Treatment fidelity was assured by independent rater checklists that were completed during every treatment class. Study therapists delivered only one study intervention; study therapist intervention protocol training was commensurate across the 3 study treatment groups and all therapists.
2.4.1. Empowered ReliefEmpowered Relief is a 2-hour, 1-session intervention that includes pain neuroscience education, mindfulness principles, and pain and stress self-regulatory skills.12,13,44 Doctoral-level psychologists with 2 to 5 years of pain-specific clinical expertise were trained to deliver the manualized class using a standardized electronic slide deck and instructor manual. Participants received a binaural relaxation audio app and completed a personalized plan for Empowered Relief during the class. Ingredients of ER that overlap with CBT include elements of pain education, pain and stress self-regulatory skills, in-vivo experience of the relaxation response and provision of an ongoing relaxation audio tool, and completion of a personalized plan. Compared with CBT, key distinctions of ER include the structured didactic instructor slide deck presentation, content involving mindfulness principles, the binaural app, minimal participant sharing during the intervention, and lack of ongoing didactic content and peer and therapeutic support over the following 7 weeks.
2.4.2. Back pain/health educationThe HE class matched the ER class in duration, structure, format, and site; topics included warning signs for back pain, when to speak with your doctor, general nutrition, and pain medication management.12 A single instructor with 20 years of experience delivering health education interventions delivered the HE class using a standardized electronic slide deck. The HE intervention involved no actionable pain management skills or worksheets.
2.4.3. Cognitive behavioral therapy for chronic low back painDoctoral-level psychologists with 2 to 25 years of pain-specific clinical expertise delivered eight 2-hour sessions of an established CBT protocol specific to chronic low back pain (16 hours total treatment time) to each treatment cohort.7,8 The content included a range of topics related to pain management (eg, mood, activity, sleep) and pain relief skills (eg, relaxation and cognitive restructuring). Participants received a workbook, 2 relaxation audio files, and a book for optional reading.37
2.5. Sample size and statistical analysisA minimum sample size of 231 adults was needed to ensure adequate power to detect between group significant differences for changes in the primary outcome at 3 months posttreatment. The sample size accounted for predicted attrition rates of 25% attrition for the single-session classes and 35% attrition for an 8-session CBT. More details on the sample size are available in the study protocol.12
We summarized continuous and categorical baseline covariates using the mean (standard deviation) and count (proportions), respectively. To investigate the treatment effect at months 3 and 6, we applied mixed models for repeated measure (MMRM) regression to perform the intention-to-treat analysis.13 The dependent variable was the outcome of interest at baseline and months 1, 2, 3, and 6, and the independent variables were time (baseline, months 1, 2, 3, and 6; as categorical variables), treatment group (ER, CBT, HE; as categorical variables), and interactions between months and between treatment groups. We applied an unstructured covariance model to account for the within-subject correlations for outcomes of interest. The MMRM analysis allows missing at random assumption. Including outcomes at baseline, month 1, and month 2 increases the estimation precision for the treatment effect at months 3 and 6 in the presence of missing data. From the MMRM regression, we estimated the between-group differences and within-group differences in 3-month change from baseline, 6-month change from baseline, and change from month 3 to month 6. For the noninferiority analysis (ER vs CBT), one-sided confidence interval of the between group difference is constructed and compared with the specified noninferiority margin. For the primary outcome, pain catastrophizing score, we selected a noninferiority margin of 4.3, which was more stringent than the minimum clinically important difference (MCID) of 6.8 reported in the literature.35 Appendix 1, https://links.lww.com/PR9/A213 details the MCIDs selected for secondary study outcomes.2,3,9,21–24,26,43 Consistent with our previous publication of the 3-month posttreatment comparisons,13 we evaluated the noninferiority of ER to CBT based on a one-sided 97.5% confidence interval for pain catastrophizing score and other endpoints, except for pain intensity and interference scores (priority secondary endpoints), whose noninferiority was based on one-sided 98.75% confidence interval to adjust for 2 comparisons. For corresponding superiority of CBT to HE and ER to HE, 2-sided 95% confidence interval was used for all endpoints, except for 2 priority secondary endpoints, which are based on 2-sided 97.5% confidence interval. The effect sizes for average improvement for all outcomes were calculated using Glass' δ, with the absolute mean change from baseline to month 3 or month 6 divided by the standard deviation at baseline.
To examine the missing pattern, we summarized the attrition rate by treatment group at each stage and compared baseline characteristics between those who completed posttreatment surveys and those who did not. We performed analyses using SAS Enterprise Guide version 8.3 (SAS Institute Inc, Cary, NC).
3. Results 3.1. ParticipantsThe study sample (N = 263) was predominantly white (60.2%), non-Hispanic (93.4%), married/cohabitating (60.8%), with at least some college education (97.7%). About 64.6% of the sample reported having low back pain for at least 5 years, and almost half of the sample (48%) reported having at least one comorbid chronic pain condition. Although rates of formally diagnosed depressive mood disorder and anxiety disorder (using the MINI 7.0 and the Structured Clinical Interview for DSM-5 Disorders) were relatively low, baseline elevated symptom levels for PROMIS depression and anxiety aligned with other studies on patients seeking treatment in tertiary pain clinics.32,45Table 1 displays additional clinical characteristics and treatment history data; while we report these data for completeness in the sample description, details regarding baseline measures (eg, treatment expectancy measures) are discussed in the previous report.13
Table 1 - Baseline demographic and clinical characteristics by treatment group (intention-to-treat). Characteristic No. (%) Total sample (n = 263) Empowered Relief (n = 87) Cognitive behavioral therapy (n = 88) Health education (n = 88) Age, mean (SD), y 47.9 (13.8) 49.7 (15.0) 45.9 (13.1) 48.0 (13.2) Sex Female 131 (49.8) 44 (50.6) 40 (45.5) 47 (53.4) Male 130 (49.4) 42 (48.3) 47 (53.4) 41 (46.6) Other 2 (0.8) 1 (1.1) 1 (1.1) 0 (0.0) Race White 157 (60.2) 57 (66.3) 48 (54.5) 52 (59.8) Asian/Pacific Islander 64 (24.5) 16 (18.6) 27 (30.7) 21 (24.1) African American 11 (4.2) 5 (5.8) 4 (4.5) 2 (2.3) American Indian/Alaska Native 2 (0.8) 1 (1.2) 0 (0.0) 1 (1.1) Other 27 (10.3) 7 (8.1) 9 (10.2) 11 (12.6) Ethnicity Hispanic 17 (6.6) 7 (8.3) 6 (6.9) 4 (4.6) Non-Hispanic 241 (93.4) 77 (91.7) 81 (93.1) 83 (95.4) Relationship status Married/cohabitating 160 (60.8) 53 (60.9) 58 (65.9) 49 (55.7) Never married 71 (27.0) 27 (31.0) 22 (25.0) 22 (25.0) Divorced 22 (8.4) 5 (5.7) 4 (4.5) 13 (14.8) Separated 6 (2.3) 1 (1.1) 1 (1.1) 4 (4.5) Widowed 4 (1.5) 1 (1.1) 3 (3.4) 0 (0.0) Education High school 6 (2.3) 2 (2.3) 2 (2.3) 2 (2.3) Some college 66 (25.1) 23 (26.4) 17 (19.3) 26 (29.5) Bachelor's degree 90 (34.2) 30 (34.5) 32 (36.4) 28 (31.8) Master's degree 67 (25.5) 21 (24.1) 26 (29.5) 20 (22.7) Doctoral degree 34 (12.9) 11 (12.6) 11 (12.5) 12 (13.6) Employment Full-time 114 (43.3) 30 (34.5) 45 (51.1) 39 (44.3) Part-time 49 (18.6) 17 (19.5) 14 (15.9) 18 (20.5) Retired 39 (14.8) 22 (25.3) 9 (10.2) 8 (9.1) Student 16 (6.1) 6 (6.9) 6 (6.8) 4 (4.5) Unemployed 16 (6.1) 4 (4.6) 6 (6.8) 6 (6.8) Disabled 13 (4.9) 4 (4.6) 4 (4.5) 5 (5.7) Household income, $USD <30,000 31 (12.3) 14 (16.5) 7 (8.5) 10 (11.6) <50,000 27 (10.7) 9 (10.6) 7 (8.5) 11 (12.8) <70,000 30 (11.9) 12 (14.1) 10 (12.2) 8 (9.3) ≥70,000 165 (65.2) 50 (58.8) 58 (70.7) 57 (66.3) Smoking status Never smoked 175 (66.8) 58 (66.7) 65 (73.9) 52 (59.8) Current 20 (7.6) 5 (5.7) 6 (6.8) 9 (10.3) Past 67 (25.6) 24 (27.6) 17 (19.3) 26 (29.9) BMI, mean (SD), kg/m2 27.0 (6.3) 27.3 (6.0) 27.0 (6.5) 26.7 (6.3) Pain duration 6–12 mo 14 (5.3) 4 (4.6) 8 (9.1) 2 (2.3) 1–5 y 79 (30.0) 25 (28.7) 24 (27.3) 30 (34.1) >5 y 170 (64.6) 58 (66.7) 56 (63.6) 56 (63.6) Back pain intensity, mean (SD) Past 30 d 5.8 (1.3) 5.6 (1.3) 5.9 (1.3) 6.0 (1.3) Treatment expectations, mean (SD)* Positive 3.69 (1.27) 3.71 (1.30) 3.74 (1.22) 3.60 (1.32) Negative 2.14 (1.30) 2.29 (1.34) 2.00 (1.12) 2.12 (1.43) Comorbid pain condition† 1 127 (48.3) 38 (43.7) 43 (48.9) 46 (52.3) 2+ 48 (18.3) 18 (20.7) 15 (17.0) 15 (17.0) Fibromyalgia 10 (3.8) 2 (2.3) 4 (4.5) 4 (4.5) Complex regional pain syndrome 3 (1.1) 1 (1.1) 0 (0.0) 2 (2.3) Pelvic pain 22 (8.4) 4 (4.6) 9 (10.2) 9 (10.2) Migraine 31 (11.8) 13 (14.9) 8 (9.1) 10 (11.4) Pain, other 160 (60.8) 54 (62.1) 54 (61.4) 52 (59.1) Medication use for CLBP Opioids 43 (16.3) 13 (14.9) 17 (19.3) 13 (14.8) NSAID/acetaminophen‡ 123 (46.8) 45 (51.7) 38 (43.2) 40 (45.5) Adjunctive pain medications§ 66 (25.1) 22 (25.3) 29 (33.0) 15 (17.0) Mental health disorders Mood disorders Ever 132 (50.2) 44 (50.6) 44 (50.0) 44 (50.0) Current 16 (6.1) 9 (10.3) 4 (4.5) 3 (3.4) Past 131 (49.8) 43 (49.4) 44 (50.0) 44 (50.0) Anxiety disorders 82 (31.2) 24 (27.6) 33 (37.5) 25 (28.4)Wald χ2 test used for categorical variables; F-test used for continuous variables, P values all non-significant between groups.
*Stanford Expectations of Treatment Scale (SETS).
†Pain conditions comorbid with chronic low back pain, excluding post-surgical pain.
‡Prescription and/or over-the-counter.
§Neuropathic pain medication, muscle relaxant, and all other pain related medication (OTC or prescription).
BMI, body mass index; CLBP, chronic low back pain; OTC, over-the-counter.
Figure 1 provides the CONSORT diagram and participant flow of this study. Among participants who completed their assigned treatment, the attrition rate at 6 months posttreatment was as follows: ER, 19% (14 of 74); CBT, 15% (9 of 59); and HE, 22% (14 of 63). No adverse events related to the study were reported during the study period. No differences in sociodemographic or clinical characteristics were found between those who completed the 6-month follow-up survey and those that did not.
3.2. Comparisons of treatment groups at 6 months posttreatmentTable 2 displays the raw means by time point, and Table 3 displays the between-group comparisons of treatment effects at 3 and 6 months posttreatment. In general, the similarity of effects at 3-months for ER vs CBT were maintained at 6 months posttreatment, with a few exceptions. That is, ER was noninferior to CBT for reducing the pain catastrophizing scale (primary outcome), pain intensity (priority secondary outcomes), self-efficacy, pain bothersomeness, pain behavior, fatigue, depression, and anxiety at 3 and 6 months posttreatment. Empowered Relief was noninferior to CBT for reducing sleep disturbance at 3 months posttreatment only. Empowered Relief was noninferior to CBT for reducing pain interference (priority secondary outcome), and physical function at 6 months posttreatment only. Furthermore, at 6 months posttreatment, the ER group had statistically significantly greater reductions in pain catastrophizing (primary outcome) compared with CBT (−3.62; 97.5% CI −∞ to −0.30; P = 0.03). Empowered Relief also showed greater reductions in pain bothersomeness (−0.98; 97.5% CI −∞ to −0.16; P = 0.02) and anxiety (−3.32; 97.5% CI −∞ to −0.16; P = 0.04) compared with CBT at 6 months posttreatment.
Table 2 - Outcome measures with mean (SD) over time by treatment group. Outcome measure Empowered Relief Cognitive behavioral therapy Health education Time point N Mean (SD) N Mean (SD) N Mean (SD) Pain catastrophizing Baseline 78 22.09 (9.84) 76 23.01 (8.98) 69 24.81 (10.32) 3 mo 64 13.17 (10.15) 61 11.87 (9.25) 58 19.74 (9.95) 6 mo 61 10.98 (9.95) 50 14.66 (10.24) 53 17.74 (10.81) Pain intensity Baseline 76 4.16 (1.73) 74 4.96 (1.68) 68 4.93 (1.59) 3 mo 63 3.14 (2.02) 60 3.20 (2.07) 56 4.41 (1.97) 6 mo 60 2.82 (1.87) 50 3.46 (2.51) 53 4.43 (1.80) PROMIS pain interference Baseline 77 58.33 (6.45) 75 61.61 (6.06) 68 60.83 (5.17) 3 mo 63 54.06 (8.34) 60 53.89 (8.65) 57 58.85 (6.67) 6 mo 60 53.32 (7.07) 50 55.41 (9.07) 53 58.83 (6.84) PROMIS sleep disturbance Baseline 77 55.13 (8.22) 75 56.20 (7.33) 67 57.04 (6.75) 3 mo 63 50.01 (9.20) 60 52.65 (9.76) 57 57.14 (7.92) 6 mo 60 50.83 (9.64) 50 52.13 (8.07) 53 54.99 (7.78) Pain self-efficacy (PSEQ) Baseline 77 39.26 (11.99) 76 35.25 (11.33) 68 35.49 (11.55) 3 mo 63 44.54 (11.73) 60 45.35 (13.18) 57 37.91 (12.10) 6 mo 61 45.92 (12.19) 50 44.82 (12.42) 53 38.40 (13.23) Pain bothersomeness Baseline 76 4.58 (2.11) 75 5.95 (2.25) 67 5.69 (1.93) 3 mo 63 3.30 (2.33) 60 3.40 (2.57) 57 4.86 (2.36) 6 mo 60 3.07 (2.24) 50 4.02 (2.92) 52 5.06 (1.97) PROMIS pain behavior Baseline 77 58.97 (3.43) 75 59.22 (4.15) 68 59.59 (2.87) 3 mo 63 54.58 (6.70) 60 55.61 (6.55) 57 58.35 (3.50) 6 mo 60
留言 (0)