Animal husbandry
All animal experiments were performed on a mouse model for AD carrying mutations APPswe/PSEN1dE9 (APP/PS1 mice of B6C3 hybrid background) to mimic amyloidosis (RRID: MMRRC_034829-JAX) originated from Jackson Laboratory (USA, stock number 004462). Mouse genotype was verified by performing PCR using the following primers: APP/PS1_F-5′ AAT AGA GAA CGG CAG GAG CA 3′; APP/PS1_R-5′ GCC ATG AGG GCA CTA ATC AT 3′. 10–12 month old animals of both sexes were used for the virus injection experiment, transgenic mice matched with WT littermates. Animals were maintained in a 12:12 light dark cycle (lights out at 20:00) and provided with food pellets and water ad libitum. Care and handling of animals were in accordance with the guidelines of the Institutional Animal Care and Use Committee of IBS (Daejeon, South Korea).
Virus injection
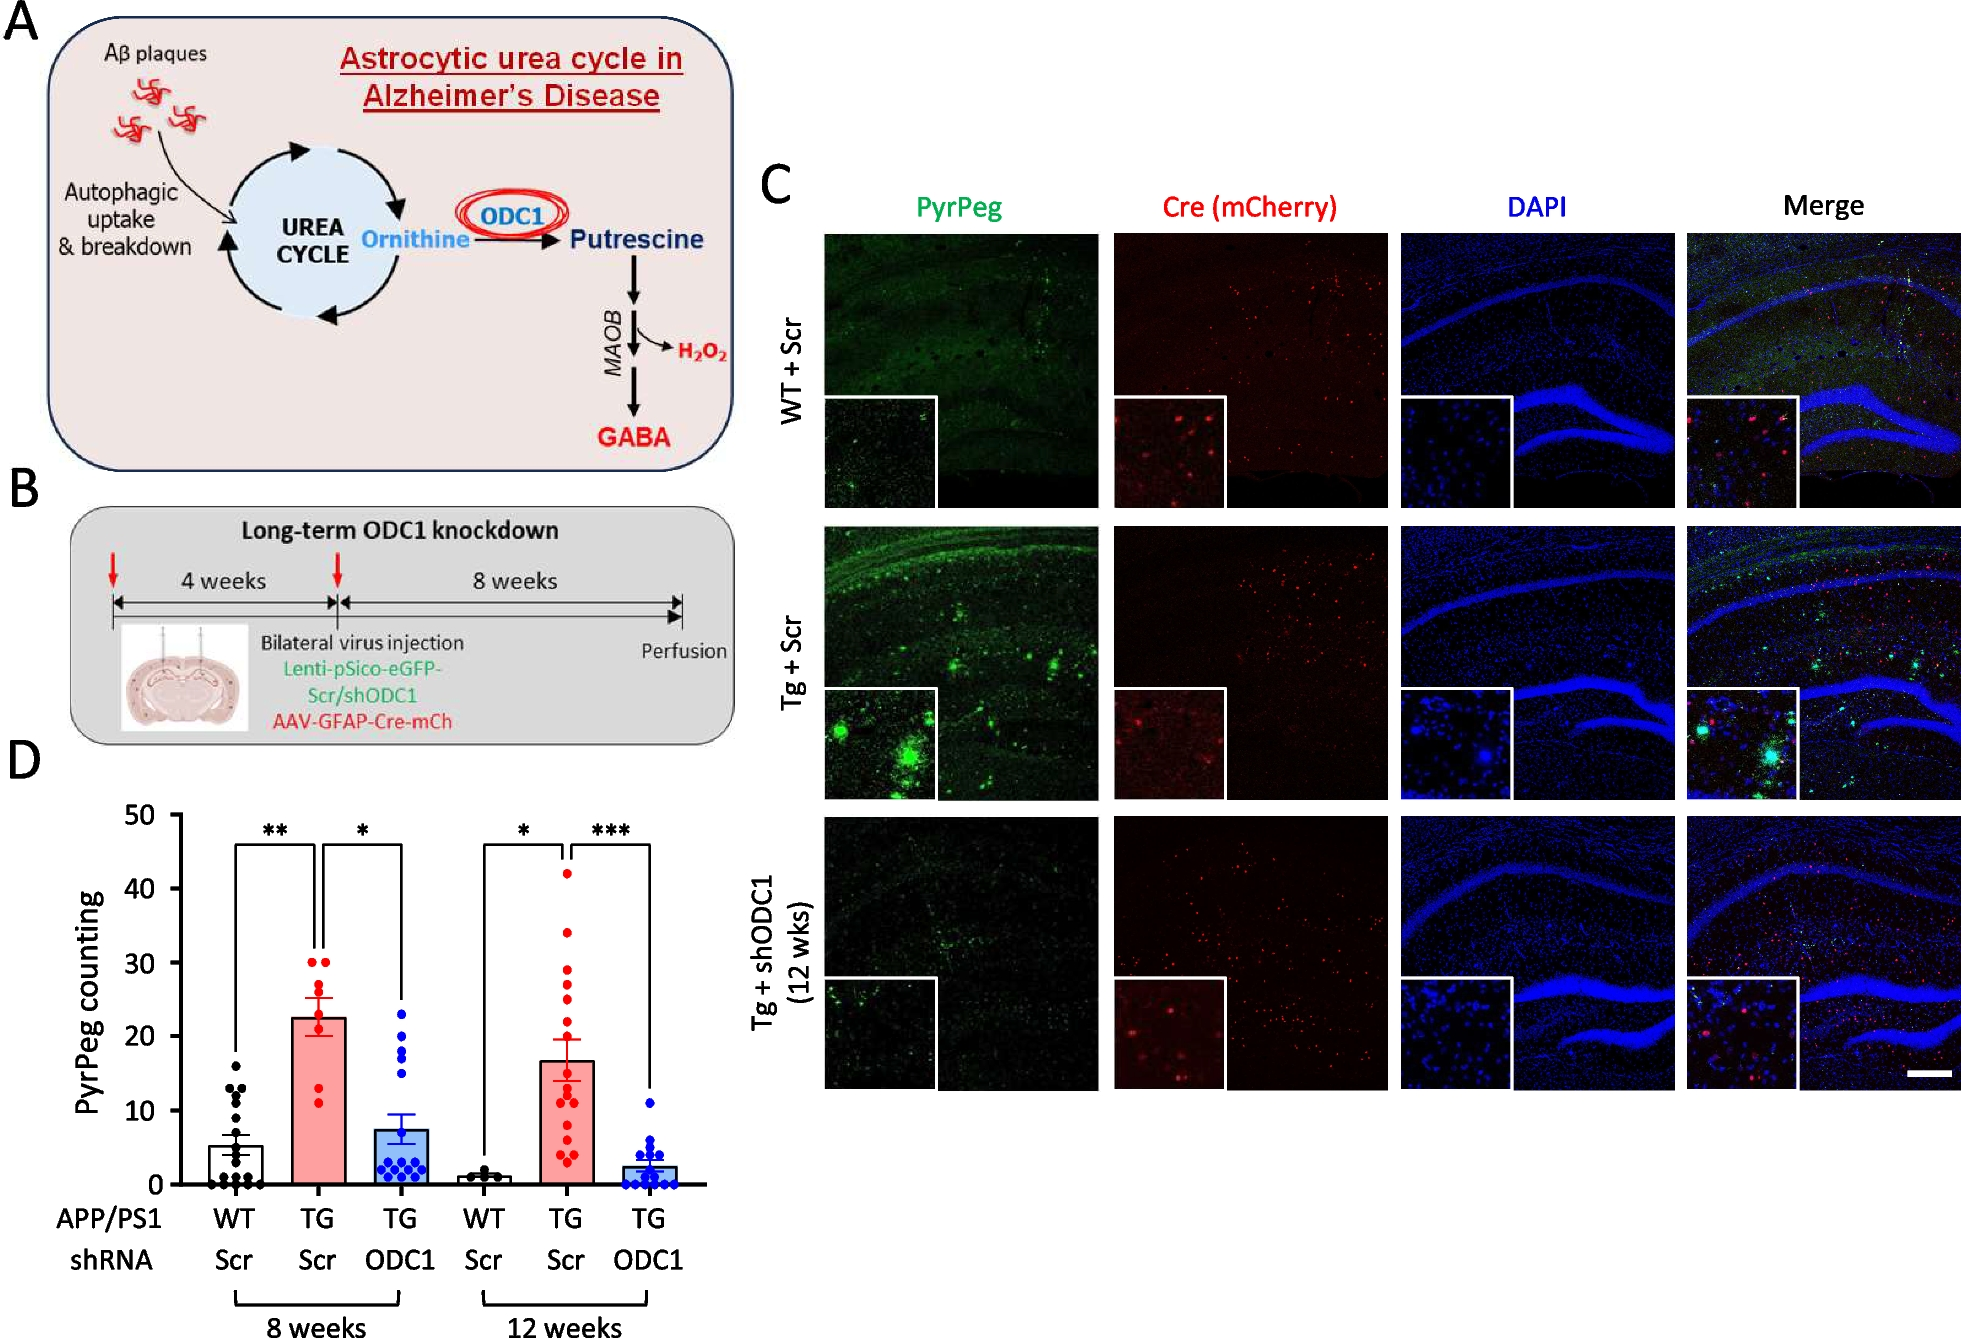
Animals were anesthetized with isoflurane and placed on stereotaxic frames (Kopf). The scalp was incised, and a hole was drilled into the skull above the dentate gyrus (A/P, − 1.5 mm; M/L, − 1.2 or + 1.2 mm from bregma, D/V, − 1.85 mm from the skull surface). The virus was loaded into a stainless-steel blunt needle (World Precision Instruments) and injected bilaterally into the dentate gyrus at a rate of 0.1 μl min− 1 for 10 min (total 1 μl in each hemisphere) using a syringe pump (KD Scientific). Viruses were generated at the Institute for Basic Science virus facility (IBS Virus Facility). AAV-GFAP-Cre-mCh, Lenti-pSico-GFP-Scr, Lenti-pSico-GFP-shODC1 viruses were used in each experiment (shRNA sequences from [4]). Mice were perfused and used for immunohistochemistry 8- and 12-weeks after injection.
Immunohistochemistry
Mice were anaesthetized with isoflurane and perfused with 0.9% saline followed by ice-cold 4% paraformaldehyde (PFA). Excised brains were post-fixed overnight at 4 °C in 4% PFA and dehydrolyzed in 30% sucrose for 48 h. Coronal hippocampal sections of 30 μm thickness were prepared in a cryostat and stored at 4 °C. Before staining, sections were thoroughly washed in 0.1 M PBS and incubated for 1 h in blocking solution (0.3% Triton X-100, 4% Donkey Serum in 0.1 M PBS). Primary antibodies were added to blocking solution at desired dilution and slices were incubated in a rocker at 4 °C overnight. Unbound antibodies were washed off using 0.1 M PBS (3 times), followed by corresponding secondary antibody incubation (in blocking solution) for 1 h at room temperature. PyrPeg was prepared and incubated as a secondary antibody (RT for 1 h). Unbound antibodies were washed with 0.1 M PBS (3 times) and DAPI was added to PBS (1:1000 dilution) in the second step to visualize the nuclei of the cells. Sections were mounted with fluorescent mounting medium (Dako) and dried. Series of fluorescent images were obtained using the Zeiss LSM900 microscope.
22-μm Z stack images in 2 μm steps were processed for Sholl analysis using the ZEN Digital Imaging for Light Microscopy blue system (Zeiss, ver. 3.2) and ImageJ (NIH, ver. 1.54b.) software. Primary antibodies were diluted to the following amounts: chicken anti-GFAP (Millipore, AB5541) 1:500; rabbit anti-proBDNF (Alomone lab, ANT-006) 1:200; and PyrPeg (0.1 μM). Secondary antibodies (Jackson) were diluted 1:500 in the blocking solution.
Sholl analysis
Sholl analysis was performed on serially stacked and maximally projected confocal images as previously described [5]. Z-stacked images (22 μm stack, 2 μm steps) of brain sections immunostained with GFAP antibody were used for Sholl analysis. The Sholl analysis plugin applied in ImageJ (NIH) constructs serially concentric circles at 5 μm intervals from the center of GFAP signal (soma) to the end of the most distal process of each astrocyte. The number of intercepts of GFAP-positive processes at each circle and the radius of the largest circle intercepting the astrocyte were analyzed and reported.
NGS data analysis
FastQ files obtained from the NCBI GEO Accession ID GSE185916 were imported to Partek Genomics Suite (Flow ver. 10.0.21.0328; Copyright 2009, Partek, St. Louis, MO, USA), where further processing was carried out. Read quality was confirmed for each sample using FastQC. High-quality reads were aligned using STAR (2.7.3a). Aligned reads were quantified to the mouse genome assembly (mm10, RefSeq transcripts assembly 93) and normalized to the median ratio (for analysis using DeSeq2). Differential analysis was carried out using DeSeq2. Gene ontology analysis was carried out from Median Ratio-normalized counts with reference to the default KEGG geneset database.
Statistical summary
All analyses were done blindly. The number of experimental samples for each group are listed in the figure legends. Numbers and individual dots refer to individual samples (individual cells) unless clarified otherwise in figure legends. N represents number of animals used for the experiment. Data representation and statistical analysis was performed using GraphPad Prism (Graphpad Software). For image analysis, ImageJ (NIH) was used. Statistical significance was set at ∗ p < 0.5, ∗ ∗ p > 0.01, ∗ ∗ ∗ p < 0.001 and ∗ ∗ ∗ ∗ p < 0.0001 (unless mentioned otherwise in figure legends).


留言 (0)