
記住我


Twenty young volunteers who had corrected to normal vision participated in the current study (ten males and ten females; mean age: 22.94 ± 2.24 years). Participants went through initial screening by identifying a gap direction of static Landolt’s C ring with gap size of 3 minimum angle of resolutions (MARs), or the smallest size of visual stimuli used in the behavioral task employed for this study. All the participants successfully identified gap directions of every static stimuli. Individuals with any identifiable neurological disorder, head injury, or personal or family history of psychiatric illness were excluded. The study protocol was approved by the Institutional Review Board (IRB) of Hanyang University, South Korea (IRB No. HYU-2020–010). The participants gave their written informed contents before the experiments. Subjects participated in three stimulation sessions, with each session (peak, trough, and sham) at least 72 h apart. No participants reported adverse symptoms, such as itchiness or phosphene.
TACS with tailored waveformSingle-channel tACS with customized current waveforms and sham stimulation were applied to each participant on three separate days, with the current waveforms applied over the electrode at Oz. All the sessions were counterbalanced and randomized. The peak and trough sessions indicate the timing at which gamma (80 Hz) waves were entrained over the alpha (10 Hz) waves in the stimulation current waveform. The peak-to-peak amplitude of the stimulation current was 3 mA, with three cycles of 1.2 mA, 80 Hz entrained over an interval π/8, 3π/8 (peak) or interval 5π/8, 7π/8 (trough) of 1.8 mA, 10 Hz AC. For the sham condition, 10 Hz AC was ramped up to 3 mA and immediately ramped back to 0 mA once the current reached the peak, with 30 s of ramping periods. All stimulations were delivered using Starstim8 of Neuroelectrics (Barcelona, Spain).
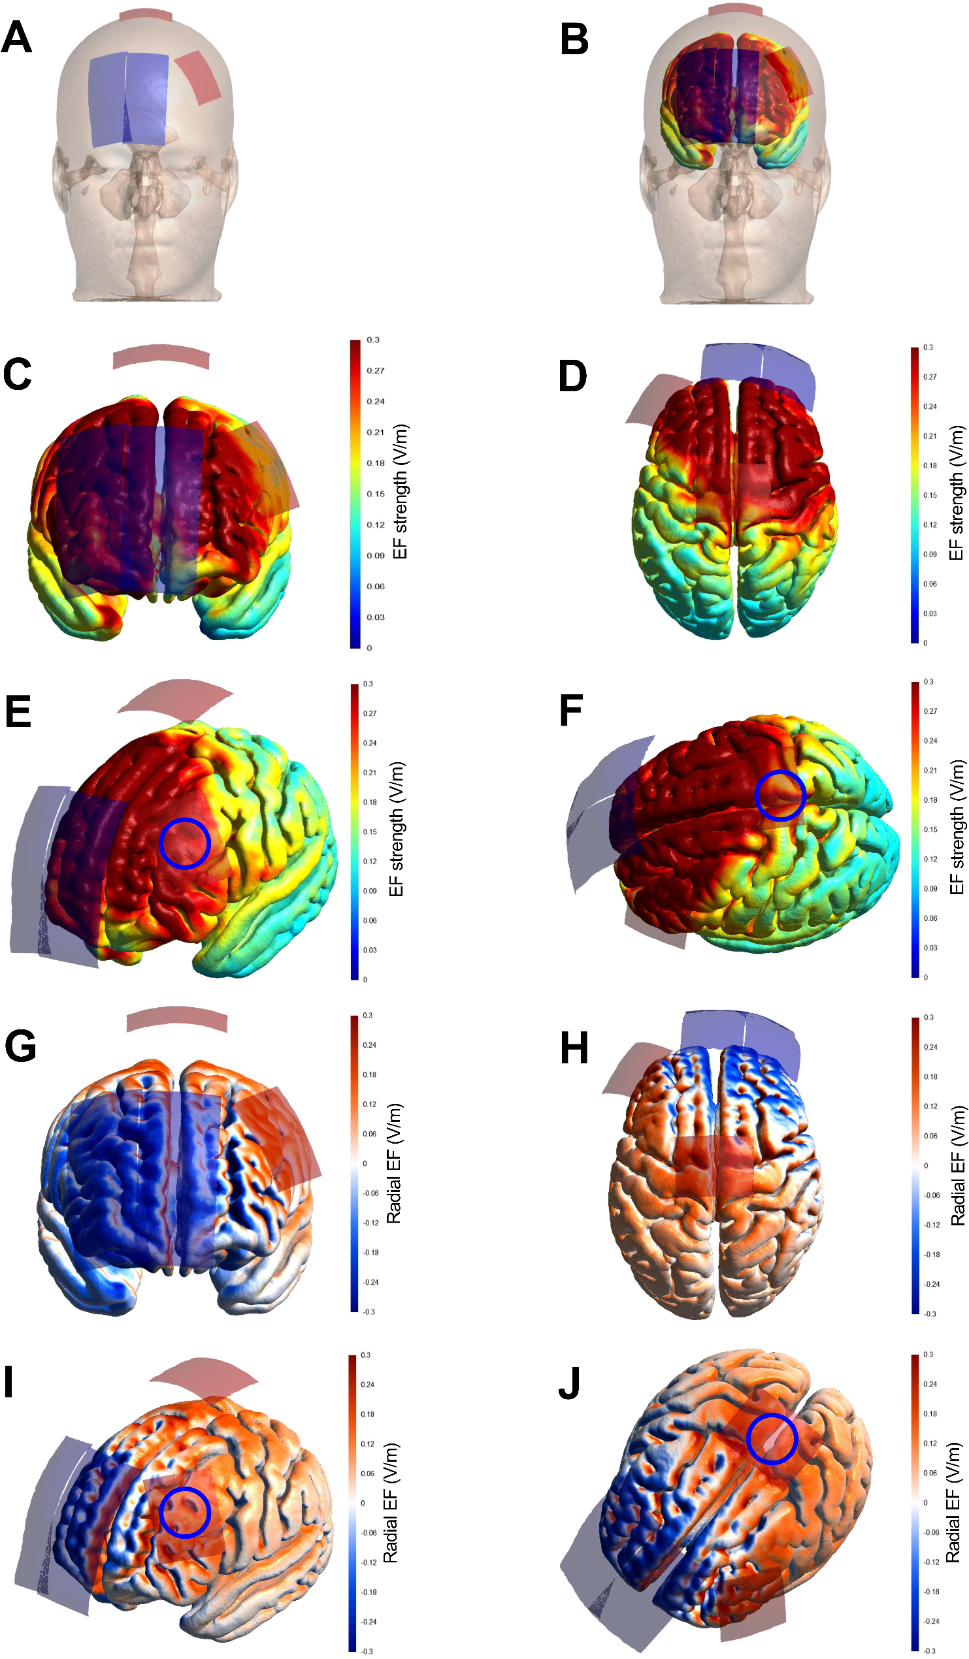
The stimulation current was delivered through saline soaked, circular electrodes with an area of 25 cm2 placed over Cz and Oz of the 10–20 international EEG system. The stimulation montage was validated using computer simulation based on finite element method (FEM). The finite element head model was constructed from a sample MRI data (Fig. 1B), and the electric fields were computed using solver embedded in COMETS 2 [21]. The maximum electric field delivered by our setup was 0.32 V/m, which was sufficient to modulate neuronal activities [22, 23]. The electric field distribution over the cortex is illustrated in Fig. 1C. The stimulation lasted 20 min, excluding the ramping times. The ramping times were 60 s, with a ramp-up and ramp-down of 30 s each. The participants underwent three DVA task sessions: pre, post0, and post10. Pre, post0, and post10 sessions denoted the task sessions performed prior to the stimulation, immediately after the stimulation, and 10 min after the stimulation, respectively. Three participants were excluded from the analyses because they could not participate in all three stimulation (2 participants) sessions or was accidentally informed of stimulation condition (1 participant). Additionally, one participant was excluded for the analysis of 3 MARs trials since the size-specific accuracy of a participant did not reach the chance level (25%) in all the task sessions under a stimulation condition.
Fig. 1
The stimulation parameters: A The injection current pattern, at the Oz electrode, of the peak (left) and trough (right) stimulation conditions (created using Matlab 2019b), B constructed finite element head model for the calculation of electric field (created using tetview), and C the electrode montage and electric field distribution over the cortex at phase of 0° under the stimulation setup (created using tecplot10)
Behavioral taskA computerized DVA task was constructed using C# and Unity based on a previous study [20]. During the task, participants were asked to indicate the direction of the gap of a Landolt’s C-ring moving at a constant speed by using the arrow keys of the keyboard. For each trial, the stimulus presented was random in speed (from 200 to 700 degrees/s, with a step of 100 degrees/s), movement direction (left to right or vice versa), gap direction (up, down, left, and right), and size (gap size of 3, 4, and 5 MARs). All possible combinations of random factors were 144, which was the number of trials in one session. When no stimuli were presented, a fixation cross appeared on the screen. The ISI was also random, ranging from 1500 to 2500 ms. The movement of the visual stimuli covered the visual angle ranging from -10° to 10°. This range of visual angles failed to induce ocular saccades during DVA performance [20]. To maintain the visual angle, the stimuli were kept constant, and the distance between the subjects and the center of the monitor was fixed at 70 cm. To display the stimuli as fluently as possible, a 240 Hz monitor was used. A flowchart of the task session is illustrated in Fig. 2. Participants performed three sessions of computerized DVA tasks under each stimulation condition: prior to the stimulation (pre), immediately after the stimulation session (post0), and 10 min after the stimulation session (post10).
Fig. 2
A The experimental protoco. The experimental protocol. Participants remained in eyes opened, resting state during intervention period, and B Description of a computerized DVA task session. One trial consisted of a fixation lasting 1.5–2.5 s and a Landolt’s C-ring with random gap direction (left, right, top, bottom) moving across the screen (left or right) followed by the fixation
Initially, the participants underwent a screening test, wherein they were asked to identify the direction of the gap of ten 3 MARs stimuli in a static state. During the main sessions, both overall accuracy and accuracy, specific to the stimulus size, were evaluated. The experimental protocol and the schedule of tasks are illustrated in Fig. 2.
EEG recording and analysisDuring all task sessions, EEG was recorded. Of the 17 participants who completed the experiment, data from one subject were excluded from the analysis due to recording errors. The EEG data were recorded over the Oz position (the electrode at Oz site was replaced as necessary, i.e., from EEG electrode to the stimulation electrode after the pre session) according to the International 10–20 EEG system with reference attached over the right mastoid, at a sampling rate of 2,048 Hz. The recorded data were high pass filtered at 1 Hz, and 60 Hz components were notch filtered to remove power noises. In all the analyses, trials with an EEG amplitude higher than 100 µV were excluded (maximum of 14 trials were removed, from one subject in post0 session of peak stimulation condition) from the analysis to eliminate trials contaminated with noise. For trials that were not contaminated, the inter-trial phase coherence (ITPC) and power spectrum was computed and averaged across trials for each participant. The ITPC was computed using newtimf function of EEGLAB in MATLAB version 2019b [24], with frequency range of 1 to 100 Hz with a step size of 1 Hz. The power spectrum was computed based on fft function in MATLAB. Finally, the PAC was computed using a MATLAB toolbox available at https://data.mrc.ox.ac.uk; the PAC was computed for phase frequency of 4 Hz to 20 Hz with a step size of 1 Hz and amplitude frequency of 30 Hz to 100 Hz with a step size of 5 Hz. All the features were computed for the time window spanning -1000 ms to 0 ms, where 0 ms was the stimulus onset.
Statistical analysisAll the statistical analyses were conducted using Matlab 2019b. For the behavioral data, both the qq-plot and data distribution indicated that the data did not follow normal distribution, as confirmed by the Shapiro–Wilk test (see Supplementary information for details). Therefore, a nonparametric analysis was employed. For behavioral performance data, Friedman’s test for within factor ‘session’ was performed to examine the overall and size-specific accuracy under each stimulation condition. Additionally, Friedman’s test was performed for within factor ‘Stimulation condition’ to assess the overall and size-specific accuracy of pre sessions to evaluate whether there was any difference between the baseline conditions for each day. Then, a post-hoc analysis of Wilcoxon’s signed-rank test was performed if necessary. Finally, multiple corrections of p-values were made using false discovery rate (FDR).
For EEG data, statistical analyses were conducted for the ITPC, 10 Hz power, 80 Hz power, and PAC. For every feature, Friedman’s test was performed for within factor ‘session’, and subsequent Wilcoxon’s signed rank test was performed if necessary. All the p-values acquired from the Wilcoxon’s signed rank test was corrected using FDR. Because stimulation parameters targeted alpha (10 Hz) and high gamma (80 Hz), appropriate windows of interests were selected for each analysis.
For ITPC, six windows of interests for the statistical analyses were selected: all possible combinations between two frequency windows of 7 − 13 Hz and 70 − 90 Hz and 200 ms time windows starting from − 600 ms, − 400 ms, and − 200 ms. The time windows were chosen to represent time windows prior to the visual stimuli onset, as phase alignment during visual perception is reported to occur prior to the stimulus onset. For PAC, the statistical analyses were conducted for a phase frequency bin of 7 − 13 Hz and amplitude frequency bin of 70 − 90 Hz. The mean PAC value for the window of interest was computed for each session under the stimulation conditions, and Friedman’s test was performed. Since Friedman’s test did not yield any significance, no post-hoc analysis was conducted.
留言 (0)