
記住我


A total of 70 patients undergoing 18F-FDG PET examinations were enrolled in the study approved by our Ethics Committee (approved on 22/06/2021 with Registration number 448/2021/SPER/IRCCSE).
The patients’ age involved in this study were in the range of 22–82 years, with a median of 63 years. Patients without good mobility and/or appropriate clinical conditions, such as not allowing adequate monitoring conditions during the administration of radiopharmaceuticals, were not enrolled in the study. Clinical data such as age, weight, height and glucose level, which could influence the IV procedure, were also acquired to analyse any possible predictions or correlations with abnormal drug administration. Pearson test was used, considered meaningful for a p-value < 0.05, to analyse the existence of some type of correlations with DR-time curves acquisition parameters.
Monitoring systemsPatient monitoring of IV administration of 18F-FDG was performed using a personal spectrometric radiation detector RadEye SPRD-ER of Thermo Fisher Scientific (Waltham, Massachusetts, USA). RadEye SPRD-ER is a high sensitivity gamma radiation detector and DR measurement tool, which incorporates two highly sensitive scintillation detectors, a CsI(TI) working at low dose rates and a PVT (polyvinyl toluene) working at high dose rates, with a miniature photomultiplier for detection of very low radiation levels. It can measure dose in terms of ambient equivalent dose H*(10) [Sv/h] and its sensitivity energy range (40 keV–3 MeV) is suitable for monitoring diagnostic and therapeutic radiopharmaceuticals. It is a wearable device, it could be wireless and it guarantees real-time data transmission through a Bluetooth connection. The instrument is equipped with a display where the detected dose-rate value is shown in real time, and it can also be used as a spectrometer allowing the recognition of radiation sources. Two devices placed on the patient's arms were used for data acquisition. All data were subsequently transferred to the RadEye SPRD-ER v1.47.0 software, which shows both DR-time curves and radiopharmaceutical spectra acquired.
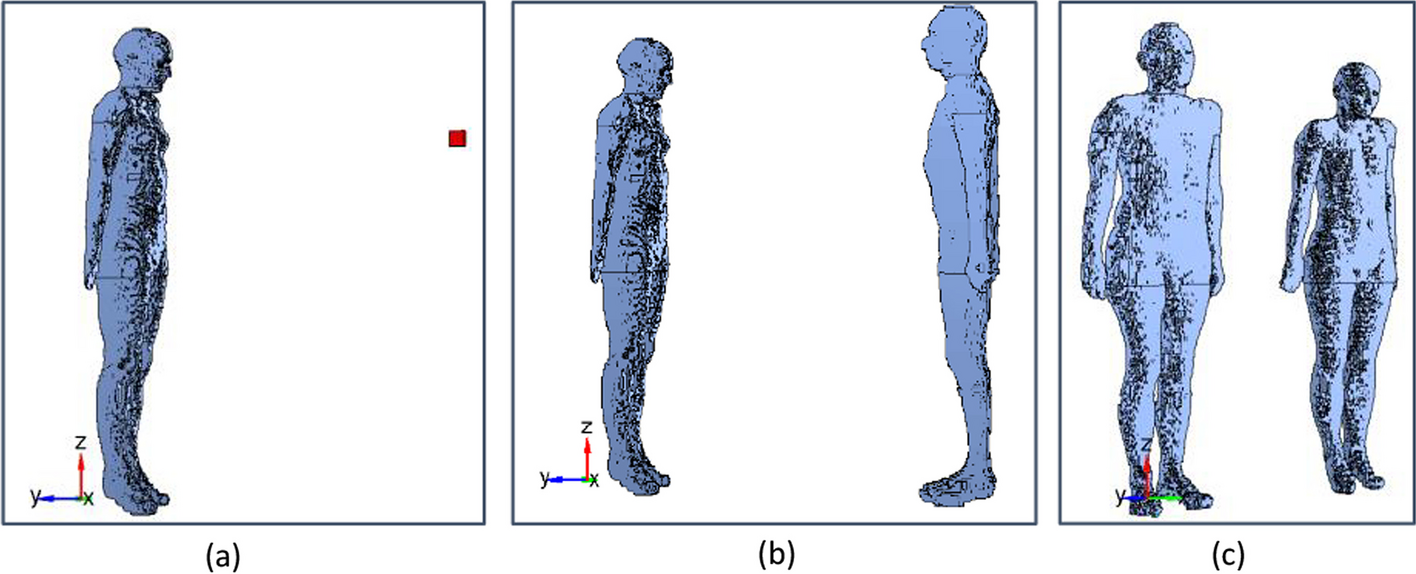
18F-FDG injection procedure18F-FDG injections were performed by nurses with more than 10 years of experience in nuclear medicine field. These procedures consist of two phases: initially, a bolus of drug is injected, lasting an average of 10 s (range 8–12), followed by a second saline infusion of 200 ml, which lasts approximately 7 min. All injections were performed in the ante-cubital fossa. All PET/CT studies were performed on a whole-body PET/CT scanner (Discovery MI, GE Medical System, Milwaukee, WI, USA). Each patient waited a time of 6 h before injection and the examinations were performed 60 min after IV administration of 2.5 MBq/kg of 18F-FDG. The blood glucose level measured at the time of the injection was within the acceptable range (i.e. < 200 mg/dl) in all patients. After gaining venous access and before the 18F-FDG injection, the two detectors were secured to the patient's arms. The first device was placed approximately 5 cm proximal to the injection site and the second detector was posed on the contralateral arm, making sure that their positions were almost mirrored. The measurement setup is reported in Fig. 1. Both sensors were left in place until the end of the IV administration and all DR data were sent to the control PC. Devices were set for collecting data at 1 s intervals. An example of a generic spectrum of the injected radionuclide and DR-time curve is shown in Fig. 2.
Fig. 1
A The RadEye SPRD-ER device. B RadEye is positioned on the injection arm, which in this case is the left arm. C Configuration of signal monitoring procedure during a patient administration by positioning both detectors on the injection (left) and the contralateral (right) arm
Fig. 2
On the left, 18F-FDG energy spectrum acquired by the RadEye SPRD-ER device during the initial check. On the right, an illustration of an ideal DR-Time curve. The continuous line is the signal acquired on the injection arm; the dashed line is the contralateral signal
Injection metricThe DR-time curves acquired during the radiopharmaceutical administration show, on the injection arm, a peak in the first infusion phase that is due to radioactive bolus passage close to the sensor. Reaching a peak, the signal rapidly drops, reaching a plateau level where the DR-time curve of the contralateral arm also converges. In Fig. 2, it is shown the ideal behaviour of a good administration process devoid of abnormal and extravasation events. Based on the literature [17], the ideal trend for a correct IV administration is represented by the convergence towards the plateau of the DR-time curves of both patient arms, considering this behaviour a crucial element for establishing the presence of residual activity (ARS) in the injection region. When such behaviour occurs, it is possible to exclude the presence of extravasation. The same assumption was used in this study to evaluate the behaviour of our DR-time curves. Specifically, the following metrics were collected and analysed for each patient, to identify the most suitable parameters to monitor the radiopharmaceutical administration in the first 10 min:
DRinmax: Maximum DR value acquired by the sensor on the injection arm (in) that corresponds to the passage of radioactive bolus [µSv/h];
DRinmean: Average DR value acquired by the sensor on the injection arm after the measured signal reached a plateau [µSv/h];
t*: Time needed for the DRin value to reach a plateau [sec];
Δpin: It is the difference within the maximum DR value acquired by the sensor on the injection arm and the average DR value acquired by the sensor on the injection arm after the measured signal reached a plateau (DRinmax—DRinmean);
ΔRt: It is the difference within DRin(t) and DRcon(t), that are the DR values acquired at the same time (t) on injection (in) and contralateral (con) arm, respectively (DRin(t) — DRcon(t)).
Data analysisThe acquired DR-time curves were analysed, according to the parameters previously described, with a homemade algorithm run manually from a company PC. The algorithm was written in Python v3.7.9 by using the packages of NumPy, Pandas (for building the databases) and Scipy (for the Gaussian filter). The curves were pre-processed through a signal cutting one minute before and nine minutes after the injection peak (DRinmax), which represents the maximum value. The DR-time curves were adapted by Gaussian fit to avoid the noise due to small unavoidable movements of the patient's arm or inevitable movements during the injection.
For each patient, the algorithm identifies values of DRinmax, DRinmean, t*, and calculates ΔRt and Δpin quantities when the stability of each signal is reached. The condition that must be satisfied to guarantee signal stability is that, for at least 60 consecutive seconds, ΔRt in two consecutive instants (i, i + 1) is not greater than 15 µSv/h. This threshold was established after having evaluated the average values assumed by ΔRt for each consecutive instant on the plateau, considering all administered doses monitored on the enrolled patients. Once the plateau value was reached, evaluations of the patients' DR-time curves were carried out, both by analysing the behaviour of the metric and by defining which of these parameters could identify the expected behaviours for normal, abnormal or extravasation cases. The statistical uncertainties of the devices, corresponding to the relative error on measured DR which is approximately 10%, were also considered.
Extravasation regions and dose estimationsThe ARS in the region surrounding the injection site was estimated from the images using the following method to evaluate its impact on local tissue in terms of dose and to estimate the SUV correction. All the identified extravasation areas were segmented on the PET image and the mean activity concentration values [MBq/ml] were calculated. The process started by determining the extravasation area by manually segmenting the volumes of interest (VOI) choosing a 3-D threshold technique on the PET images using Velocity 3.2 (Varian Medical Systems, Palo Alto, USA).
Different approaches were proposed to segment the volumes most suitable in case of extravasation [11, 23, 24]. Following the strategy proposed by Tylski [23] and Innocent [24], two volumes were segmented corresponding to 10% (Th10) and 40% (Th40) of the maximum intensity uptake voxel values in the extravasated areas. Then, the mean activity concentration values [MBq/ml] in these two volumes were calculated using the Velocity applicative. The total ARS at the injection site was evaluated as the product of the mean activity concentration and the total volume (ml) of the segmented area. Since the identified ARS corresponds to the activity in the extravasation area after 1 h from the administration, the total ARS was decay corrected (physical half-life) by reporting at the time of injection. The dose factors were calculated with OLINDA version 2.3.3 (Hermes Medical Solutions AB, Sweden) using the sphere model [25]. Water spheres of masses compatible with the extravasations were calculated, and their dose per unit of activity was multiplied by the mean activity values to recover the self-dose of infiltrated tissue.
SUV correction methodThe standardised uptake value (SUV) is a semi-quantitative parameter used by nuclear medicine physicians to distinguish between normal and abnormal levels of the tracer uptake. It is well known that SUV has several limitations, and it is dependent on many patient-related factors, such as the VOI definition, the Ain, the body size, and the time between injection and image acquisition.
PET images of all patients enrolled in the study were analysed, and special attention was paid to all those patients who recorded an anomalous trend of the DR-times curves during administration. PET images were appropriately evaluated by a senior nuclear medicine physician to verify the potential presence of cases of extravasation.
In case of extravasation, the SUV values were corrected by subtracting the estimated activity at the injection area from the value of the total Ain [9,10,11]. In particular, the impact due to extravasation phenomena was quantified.
留言 (0)