


記住我
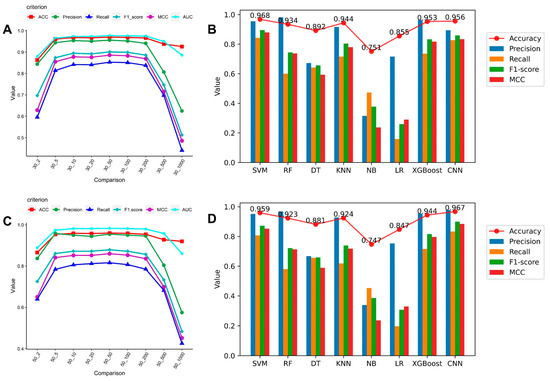


Figure 1. Line graph and histogram of sRNA sequence specificity verification using machine learning: (A) The SVM performance trend at x times change in the 30 RPM value data set. (B) The evaluation result of each machine learning model at the 10 times change in 30 RPM value. (C) The SVM performance trend at x times changes in the 50 RPM value data set. (D) The evaluation result of each machine learning model at the 10 times change in 50 RPM value.
Figure 2. Target genes function enrichment analysis and KEGG pathway results.
Figure 3. Entire experimental design scheme: (A) Data pre-processing stage: Process high-throughput data to count sRNA expression, obtain sRNAs with significant expression changes before and after infection, and divide multiple ranges to construct specific sRNA datasets. (B) Multi-machine learning analysis phase: constructing sequence features of the obtained positive and negative samples and analyzing different ranges using multiple models. (C) Regulatory analysis stage: We conducted genomic matching of the analyzed sRNAs to obtain possible sources and then started target gene prediction and performed functional enrichment analysis to obtain gene function regulation results in Arabidopsis.
Figure 4. The sequence reads of each RPM value distribution of sRNA.
Table 1. 108 sRNA partial displays: RPM values, counts, length, and target genes before and after sRNA infection. RPM1 and RPM2 are the sRNA expressions before and after infection, Count1 and Count2 are the respective sRNA counts before, and after infection, Len is the length of sRNA, and Target is the predicted target gene.
Table 1. 108 sRNA partial displays: RPM values, counts, length, and target genes before and after sRNA infection. RPM1 and RPM2 are the sRNA expressions before and after infection, Count1 and Count2 are the respective sRNA counts before, and after infection, Len is the length of sRNA, and Target is the predicted target gene.
SeqRPM1.RPM2.Count1.Count2.Len.TargetGAGGACGAGAACATGAACTGGA1.2551092.535353066222AT1G63450.1, AT1G10590.3, AT1G30790…CATGGAACTCAATGGCTGTCAT1.210719.360342018822AT4G37200.1, AT3G51940.1, AT1G47128…AATTGCCGGAGAAGGGAAACTC0.360532.210101493422AT5G55120.1, AT2G27810.1, AT2G27810…AAGACAAGACTCTAAAACTCCT0.450469.215121316722AT2G18800.1, AT5G58210.3, AT5G58210…CCGAAGCAGAACTGAAGAGCCT0.400360.825111012622AT1G24620.1, AT1G50460.2, AT1G50460……… AGCTAGTGGGGGTTCTGACAC0.00053.8450151121AT5G45455.1, AT5G08390.1, AT2G47490.1GATGATCGCCATAGCACTTGAT0.03552.2351146622AT1G70520.1, AT3G51220.1CGCTACTATCATCGCCGGGGGT0.10052.0953146222AT5G35604.1, AT3G19430.2, AT4G13730…TACGGATGAGCAAGTGCTGGACT0.09050.8302142623AT3G59790.1, AT3G07400.1, AT5G61160.1GTCGAAGAAGGAGGCTTGCCC0.00050.5500141821AT1G61140.3, AT4G31210.3, AT4G31210.1…
留言 (0)