

記住我
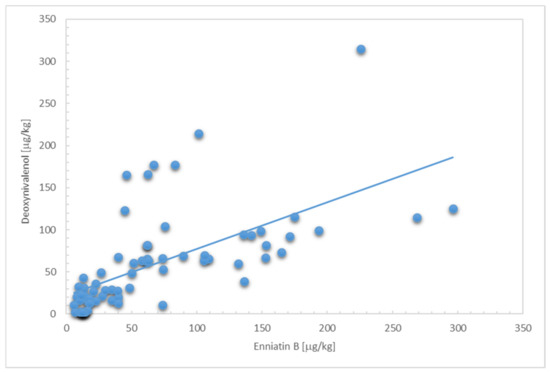

Figure 1. Scatter plot depicting the associations between concentration levels of enniatin B and deoxynivalenol in cereal-based foodstuffs, excluding infant food. Nine samples with non-detected levels of deoxynivalenol were assigned the limit of detection of 2 µg/kg.
Table 1. Occurrence of enniatin B (µg/kg) in analysed cereal-based foodstuff.
Table 1. Occurrence of enniatin B (µg/kg) in analysed cereal-based foodstuff.
nDFMeanMedianMinMaxWhite bread4100103.5105.162.16142.0Wholemeal bread410074.4675.1146.30101.3Tin bread3100163.3175.174.70225.4Bread rusks3100178.7193.673.75268.7Crackers310069.1548.3222.67136.5Cookies310020.6013.7313.2434.82Other cookies310019.4811.896.6639.88Muffins310011.6810.367.9016.79Cakes310023.4227.6212.9729.67Breakfast cereals3100113.8148.939.65153.0Pasta3100110.639.6247.19152.5Baby food *32286.714.652.5316.79Table 2. Normalised consumption (g/kg bw/day) of cereal-based products for the population under 18 years old from ENALIA survey in Spain. Mean levels and standard deviation (SD) were computed considering only consumers identified as percentage of consumers (% cons).
Table 2. Normalised consumption (g/kg bw/day) of cereal-based products for the population under 18 years old from ENALIA survey in Spain. Mean levels and standard deviation (SD) were computed considering only consumers identified as percentage of consumers (% cons).
FoodAgeN%MeanSDGroupTotalConsWhite bread 0–11 months18243%1.130.8212–35 months33379%1.811.213–9 years old58995%1.590.8810–17 years old62797%1.150.61Wholegrain bread0–11 months1821%0.890.4112–35 months3332%3.643.143–9 years old5896%1.440.7710–17 years old6279%0.980.60Bread rusks0–11 months----12–35 months3334%0.780.743–9 years old5895%0.560.4710–17 years old6273%0.330.15Crackers0–11 months1825%0.310.1112–35 months33312%0.982.203–9 years old5895%0.920.9610–17 years old6275%0.550.64Cookies0–11 months18281%1.040.5512–35 months33374%1.370.833–9 years old58948%1.270.7810–17 years old62734%0.790.50Other cookies0–11 months----12–35 months3331%1.540.953–9 years old5893%1.621.1010–17 years old6272%1.301.12Muffins0–11 months1821%3.33-12–35 months33310%2.551.063–9 years old58916%1.730.7910–17 years old62716%1.080.59Cake0–11 months----12–35 months3330.30%7.89-3–9 years old5891%3.911.9310–17 years old6272%2.060.83Breakfast cereals0–11 months1822%2.923.1812–35 months3333%1.751.353–9 years old5899%1.130.9510–17 years old6278%0.690.49Pasta0–11 months1829%2.281.6012–35 months33349%2.381.703–9 years old58958%1.761.3210–17 years old62759%1.100.92Table 3. Exposure to enniatin B (ng/kg bw/day) among the adult population. The estimates were calculated with the deterministic and probabilistic method through consumption of cereal-based food from the Catalonia region and Spain considering only consumers using the upper bound scenario for left-censored data.
Table 3. Exposure to enniatin B (ng/kg bw/day) among the adult population. The estimates were calculated with the deterministic and probabilistic method through consumption of cereal-based food from the Catalonia region and Spain considering only consumers using the upper bound scenario for left-censored data.
MethodRegionAge GroupMedianMeanSDMinP75P95P99DeterministicCatalonia18–40130.6138.172.337.14178.8269.2350.041–60109.1114.959.867.22143.2222.5299.7>60105.3111.454.344.79146.1202.8259.7Spain18–40172.6196.3132.86.77260.2423.7565.241–60152.2170.1100.74.69219.4338.1453.4>60144.5154.293.911.79213.7338.6396.9ProbabilisticCatalonia18–40131.0138.568.100.00180.3261.5327.441–60109.5116.661.950.00153.7228.3290.1>60105.4112.055.450.00146.2213.0263.8Spain18–40174.0199.0137.60.00267.6452.4651.541–60148.2174.6123.00.00234.0405.2583.3>60133.6161.0125.80.00214.2391.5606.0Table 4. Summary of exposure assessments to enniatin B among adult population reported in previous studies.
Table 4. Summary of exposure assessments to enniatin B among adult population reported in previous studies.
CountryContaminationTable 5. Exposure to enniatin B (ng/kg bw/day) among the population under 18 years. The estimates were calculated with the deterministic and probabilistic method through the consumption of cereal-based food from the Catalonia region and Spain considering only consumers.
Table 5. Exposure to enniatin B (ng/kg bw/day) among the population under 18 years. The estimates were calculated with the deterministic and probabilistic method through the consumption of cereal-based food from the Catalonia region and Spain considering only consumers.
MethodRegionAge GroupnMedianMeanSDMinimumP75P95P99Deterministic LBCatalonia0–36 months13328.3229.4522.150.7941.6873.2794.57Deterministic UB0–36 months13349.8951.8739.011.473.40129.1166.6DeterministicSpain0–11 months18245.96100.8133.65.72120.5328.0622.212–35 months333263.9324.2262.15.42458.6797.51181.33–9 years589264.3313.0199.610.47404.8710.2970.510–17 years627182.2213.0131.811.63270.8447.2673.2ProbabilisticSpain0–11 months10,00046.2194.82123.00.00132.6327.6590.012–35 months10,000254.5308.4234.50.00422.3780.81092.23–9 years10,000266.0310.8201.10.00401.0697.11032.910–17 years10,000185.7224.2154.20.00283.18511.7813.5
留言 (0)