


記住我

Conceptualization, H.W.; Methodology, H.W., R.J.B., Q.L., M.P.H., J.C. and Y.T.; Formal Analysis, H.W.; Investigation, H.W., R.J.B., Q.L., M.P.H. and J.C.; Resources, Y.T. and S.Y.C.; Data Curation, H.W.; Writing—Original Draft Preparation, H.W.; Writing—Review and Editing, R.J.B., M.P.H., J.C. and S.Y.C.; Visualization, H.W., M.P.H. and J.C.; Supervision, H.W. and S.Y.C.; Project Administration, H.W. and S.Y.C.; Funding Acquisition, H.W. and S.Y.C. All authors have read and agreed to the published version of the manuscript.
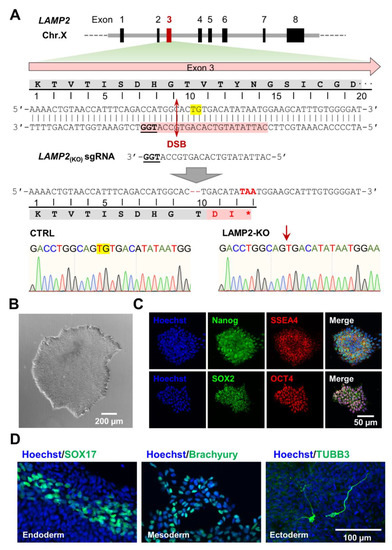
Figure 1. Generation of LAMP2 knock out iPSC model of Danon disease. (A) Top: LAMP2 gene structure and design of small guide RNA for CRISPR/Cas9 knockout. Middle: error-prone repairs of double strand break (DSB) induced a 2-base deletion in exon 3 of LAMP2, which results in an early stop codon that truncates LAMP2. Bottom: Sequence chromatograms showed the result of gene editing. Yellow background highlights the deleted nucleotides. * indicates stop codon that induce truncation of LAMP2; (B) LAMP2 KO iPSCs exhibit the typical stem cell clone morphology as shown in phase contrast view; (C) Immuno-fluorescence staining shows the expression of pluripotency markers (Nanog, SSEA-4, SOX2, and OCT4) in LAMP2 KO iPSCs; (D) In vitro 3-germ layer differentiation of LAMP2 KO iPSCs was confirmed by the immunofluorescence staining of specific markers: SOX17 for endoderm, Brachyury for mesoderm, and γ-tubulin for ectoderm.
Figure 1. Generation of LAMP2 knock out iPSC model of Danon disease. (A) Top: LAMP2 gene structure and design of small guide RNA for CRISPR/Cas9 knockout. Middle: error-prone repairs of double strand break (DSB) induced a 2-base deletion in exon 3 of LAMP2, which results in an early stop codon that truncates LAMP2. Bottom: Sequence chromatograms showed the result of gene editing. Yellow background highlights the deleted nucleotides. * indicates stop codon that induce truncation of LAMP2; (B) LAMP2 KO iPSCs exhibit the typical stem cell clone morphology as shown in phase contrast view; (C) Immuno-fluorescence staining shows the expression of pluripotency markers (Nanog, SSEA-4, SOX2, and OCT4) in LAMP2 KO iPSCs; (D) In vitro 3-germ layer differentiation of LAMP2 KO iPSCs was confirmed by the immunofluorescence staining of specific markers: SOX17 for endoderm, Brachyury for mesoderm, and γ-tubulin for ectoderm.
Figure 2. Morphological changes in LAMP2 KO iPSC-CMs. (A) Immunofluorescence staining of Ctrl iPSC-CMs with sarcomere markers (green for α-actinin and red for TNTN2) with detailed sarcomere structures shown in zoom-in view. White arrows indicate the sarcomere arrangement analyzed in detail in panel B; (B) Distribution pattern of α-actinin and TNNT2 signals along the sarcomere; (C,D) Immunofluorescence staining of sarcomere proteins in LAMP2 KO iPSC-CMs showed an irregular distribution of actinin and TNNT2 signals; € Quantification of mRNA expression of LAMP2 in both Ctrl and LAMP2 KO iPSC-CMs. Results from 3 independent experiments for Ctrl and LAMP2 KO group. Red dashed line indicates the ratio of LAMP2/GAPDH in Ctrl group was normalized to 1; (F) Western blot confirms the absence of LAMP2 protein in LAMP2 KO iPSC-CMs. Left: Western blot image; right: Western blot image merged with gel image indicates the predicted size of the target band; (G,H) Fast Fourier transformation analysis showed the regularity of α-actinin (G) and TNNT2 (H) signal distribution is significantly decreased in LAMP2 KO iPSC-CMs. N = 59 for Ctrl, N = 73 for LAMP2 KO. Data from at least 3 independent experiments. Red lines indicate the mean value of each group. *** p < 0.001, and **** p < 0.0001 versus Ctrl iPSC-CMs by unpaired t-test.
Figure 2. Morphological changes in LAMP2 KO iPSC-CMs. (A) Immunofluorescence staining of Ctrl iPSC-CMs with sarcomere markers (green for α-actinin and red for TNTN2) with detailed sarcomere structures shown in zoom-in view. White arrows indicate the sarcomere arrangement analyzed in detail in panel B; (B) Distribution pattern of α-actinin and TNNT2 signals along the sarcomere; (C,D) Immunofluorescence staining of sarcomere proteins in LAMP2 KO iPSC-CMs showed an irregular distribution of actinin and TNNT2 signals; € Quantification of mRNA expression of LAMP2 in both Ctrl and LAMP2 KO iPSC-CMs. Results from 3 independent experiments for Ctrl and LAMP2 KO group. Red dashed line indicates the ratio of LAMP2/GAPDH in Ctrl group was normalized to 1; (F) Western blot confirms the absence of LAMP2 protein in LAMP2 KO iPSC-CMs. Left: Western blot image; right: Western blot image merged with gel image indicates the predicted size of the target band; (G,H) Fast Fourier transformation analysis showed the regularity of α-actinin (G) and TNNT2 (H) signal distribution is significantly decreased in LAMP2 KO iPSC-CMs. N = 59 for Ctrl, N = 73 for LAMP2 KO. Data from at least 3 independent experiments. Red lines indicate the mean value of each group. *** p < 0.001, and **** p < 0.0001 versus Ctrl iPSC-CMs by unpaired t-test.
Figure 3. LAMP2 KO impairs β-adrenergic signaling in iPSC-CMs. (A,B) Representative Fluo-4 calcium transient trace in Ctrl iPSC-CMs before (A) and after (B) isoproterenol (ISO) treatment; (C,D) Representative Fluo-4 calcium transient trace in LAMP2 KO iPSC-CMs before (C) and after (D) ISO treatment; (E–G) LAMP2 KO iPSC-CMs exhibit prolonged transient rise ti€(E) and unchanged transient decay Tau (F) and beating rate (G) at baseline compared to Ctrl group. ISO treatment induced smaller functional improvement in LAMP2 KO groups compared to Ctrl, resulting in significant differences between Ctrl and LAMP2 KO cells. N = 59, 103, 37, and 90 cells in Ctrl, LAMP2 KO, Ctrl + ISO, and LAMP2 KO + ISO group from at least 3 independent experiments. ns: no significance, *** p < 0.001 and **** p < 0.0001 by two-way ANOVA test followed by Holm–Sidak method.
Figure 3. LAMP2 KO impairs β-adrenergic signaling in iPSC-CMs. (A,B) Representative Fluo-4 calcium transient trace in Ctrl iPSC-CMs before (A) and after (B) isoproterenol (ISO) treatment; (C,D) Representative Fluo-4 calcium transient trace in LAMP2 KO iPSC-CMs before (C) and after (D) ISO treatment; (E–G) LAMP2 KO iPSC-CMs exhibit prolonged transient rise ti€(E) and unchanged transient decay Tau (F) and beating rate (G) at baseline compared to Ctrl group. ISO treatment induced smaller functional improvement in LAMP2 KO groups compared to Ctrl, resulting in significant differences between Ctrl and LAMP2 KO cells. N = 59, 103, 37, and 90 cells in Ctrl, LAMP2 KO, Ctrl + ISO, and LAMP2 KO + ISO group from at least 3 independent experiments. ns: no significance, *** p < 0.001 and **** p < 0.0001 by two-way ANOVA test followed by Holm–Sidak method.
Figure 4. Metabolic maturation enhanced pro-arrhythmic calcium signaling in LAMP2 KO iPSC-CMs. (A,B) Representative Fura-2 calcium transient trace in Ctrl iPSC-CMs before (A) and after (B) maturation medium (MM) treatment for 48 h; (C,D) Representative Fura-2 calcium transient trace in LAMP2 KO iPSC-CMs before (C) and after (D) maturation medium (MM) treatment for 48 h. Cell were paced at 0.5 HZ in all the groups; (E–G) LAMP2 KO iPSC-CMs showed unchanged diastolic cytosol calcium level (E), slightly decreased calcium transient amplitude (F), and a trend of increased irregular beating (G) compared to Ctrl group. MM treatment significantly brought down the diastolic calcium levels in both Ctrl and LAMP2 KO iPSC-CMs, yet only induced decreased transient amplitude and increased irregular beating events in the LAMP2 KO group. N = 80, 91, 88, and 114 cells in Ctrl, LAMP2 KO, Ctrl + MM, and LAMP2 KO + MM group from at least 3 independent experiments. ns: no significance, * p < 0.05, ** p < 0.01, *** p < 0.001, and **** p < 0.0001 by two-way ANOVA followed by test Holm–Sidak method.
Figure 4. Metabolic maturation enhanced pro-arrhythmic calcium signaling in LAMP2 KO iPSC-CMs. (A,B) Representative Fura-2 calcium transient trace in Ctrl iPSC-CMs before (A) and after (B) maturation medium (MM) treatment for 48 h; (C,D) Representative Fura-2 calcium transient trace in LAMP2 KO iPSC-CMs before (C) and after (D) maturation medium (MM) treatment for 48 h. Cell were paced at 0.5 HZ in all the groups; (E–G) LAMP2 KO iPSC-CMs showed unchanged diastolic cytosol calcium level (E), slightly decreased calcium transient amplitude (F), and a trend of increased irregular beating (G) compared to Ctrl group. MM treatment significantly brought down the diastolic calcium levels in both Ctrl and LAMP2 KO iPSC-CMs, yet only induced decreased transient amplitude and increased irregular beating events in the LAMP2 KO group. N = 80, 91, 88, and 114 cells in Ctrl, LAMP2 KO, Ctrl + MM, and LAMP2 KO + MM group from at least 3 independent experiments. ns: no significance, * p < 0.05, ** p < 0.01, *** p < 0.001, and **** p < 0.0001 by two-way ANOVA followed by test Holm–Sidak method.
Figure 5. Real-time PCR quantification of mRNA expression of key cardiac genes in Ctrl and LAMP2 KO iPSC-CMs. (A,B) Increased expression of sarcomere and cytoskeletal genes ACTC1 (A) and MYBPC3 (B) genes in the Ctrl but not LAMP2 KO iCMs after MM treatment; (C) Decreased expression of adult troponin I subtype, TNNI3, in MM-treated LAMP2 KO cells; (D) Increased expression of CASQ2, which encodes Ca2+ buffering protein calsequestrin-2 in the Ctrl but not LAMP2 KO iCMs after MM treatment; (E–G) Increased mitochondrial gene expression, such as GAPDH (E), PPARGC1A (F), and COX8A1 (G) in Ctrl but not LAMP2 KO cells after MM treatment; (H) Increased expression of BAG3, a cochaperone protein of HSP70, in LAMP2 KO but not Ctrl iCMs after MM treatment. Results from at least 3 independent experiments. Red dashed line indicates the relative mRNA expression in Ctrl group at base level were normalized to 1. * p < 0.05, ** p < 0.01, *** p < 0.001, and **** p < 0.0001 by two-way ANOVA test followed by Holm–Sidak method.
Figure 5. Real-time PCR quantification of mRNA expression of key cardiac genes in Ctrl and LAMP2 KO iPSC-CMs. (A,B) Increased expression of sarcomere and cytoskeletal genes ACTC1 (A) and MYBPC3 (B) genes in the Ctrl but not LAMP2 KO iCMs after MM treatment; (C) Decreased expression of adult troponin I subtype, TNNI3, in MM-treated LAMP2 KO cells; (D) Increased expression of CASQ2, which encodes Ca2+ buffering protein calsequestrin-2 in the Ctrl but not LAMP2 KO iCMs after MM treatment; (E–G) Increased mitochondrial gene expression, such as GAPDH (E), PPARGC1A (F), and COX8A1 (G) in Ctrl but not LAMP2 KO cells after MM treatment; (H) Increased expression of BAG3, a cochaperone protein of HSP70, in LAMP2 KO but not Ctrl iCMs after MM treatment. Results from at least 3 independent experiments. Red dashed line indicates the relative mRNA expression in Ctrl group at base level were normalized to 1. * p < 0.05, ** p < 0.01, *** p < 0.001, and **** p < 0.0001 by two-way ANOVA test followed by Holm–Sidak method.
Figure 6. ROS overload led to over-activation of CaMKII in LAMP2 KO iCMs after MM treatment. (A) Western blot quantification of LC3-I and LC3-II expression in Ctrl and LAMP2 KO iCMs. Impaired autophagic flux is evidenced by the significantly increased LC3-II/I ratio, as the degradation mechanism of LC3-II is compromised in LAMP2 KO both before and after MM treatment. Results from at least 4 independent experiments; (B) Representative images of Hoechst and CellRoxTM staining of cellular ROS levels; (C) Quantitative results showed increased ROS level in LAMP2 KO and LAMP2 KO + MM groups. N = 147, 167, 182, and 136 cells in Ctrl, LAMP2 KO, Ctrl + MM, and LAMP2 KO + MM group from at least 3 independent experiments. ns: no significance; (D) Representative images of MitoTrackerTM green and MitoSoxTM red co-staining of mitochondrial morphology and mROS levels. Rectangular images showed zoom-in views of the dashed boxes. White arrows indicate the mitochondrial networks. Grey arrows indicate fragmentized mitochondria with increased mROS levels; (E) Western blot quantification of the expression and phosphorylation levels of cardiac CaMKIIδ. The p-CaMKIIδ/CaMKIIδ ratio is significantly increased in LAMP2 KO and LAMP2 KO + MM groups. Results from at least 3 independent experiments. Red dashed line indicates the value in Ctrl group at base level were normalized to 1. * p < 0.05, ** p < 0.01, *** p < 0.001, and **** p < 0.0001 by two-way ANOVA test followed by Holm–Sidak method.
Figure 6. ROS overload led to over-activation of CaMKII in LAMP2 KO iCMs after MM treatment. (A) Western blot quantification of LC3-I and LC3-II expression in Ctrl and LAMP2 KO iCMs. Impaired autophagic flux is evidenced by the significantly increased LC3-II/I ratio, as the degradation mechanism of LC3-II is compromised in LAMP2 KO both before and after MM treatment. Results from at least 4 independent experiments; (B) Representative images of Hoechst and CellRoxTM staining of cellular ROS levels; (C) Quantitative results showed increased ROS level in LAMP2 KO and LAMP2 KO + MM groups. N = 147, 167, 182, and 136 cells in Ctrl, LAMP2 KO, Ctrl + MM, and LAMP2 KO + MM group from at least 3 independent experiments. ns: no significance; (D) Representative images of MitoTrackerTM green and MitoSoxTM red co-staining of mitochondrial morphology and mROS levels. Rectangular images showed zoom-in views of the dashed boxes. White arrows indicate the mitochondrial networks. Grey arrows indicate fragmentized mitochondria with increased mROS levels; (E) Western blot quantification of the expression and phosphorylation levels of cardiac CaMKIIδ. The p-CaMKIIδ/CaMKIIδ ratio is significantly increased in LAMP2 KO and LAMP2 KO + MM groups. Results from at least 3 independent experiments. Red dashed line indicates the value in Ctrl group at base level were normalized to 1. * p < 0.05, ** p < 0.01, *** p < 0.001, and **** p < 0.0001 by two-way ANOVA test followed by Holm–Sidak method.
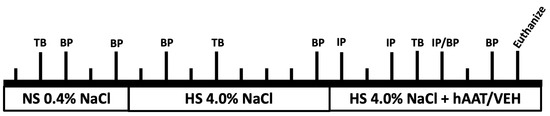
Figure 7. Restoration of calcium homeostasis of LAMP2 KO iCMs by ROS scavenger. (A) Diagram of experimental design. (B) Treatment of NACA but not rapamycin significantly reduced the cellular ROS overload in LAMP2 KO iCMs in MM. N = 181, 135, 145, and 143 cells in Ctrl + MM, LAMP2 KO + MM, LAMP2 KO + MM + NAC, and LAMP2 KO + MM + Rapa group from at least 3 independent experiments. (C) Western blot showed NACA reduced the p-CaMKIIδ/CaMKIIδ ratio in LAMP2 KO iCMs, but no change was detected in rapamycin treated cells. Results from at least 3 independent experiments. (D–F) Fura-2 calcium imaging analysis suggested that NACA treatment restored the diastolic calcium level (D), calcium transient amplitude (E), and regular beating (F) in LAMP2 KO iCMs, while no beneficial effect was observed in the rapamycin treated group. N = 88, 114, 105, and 98 cells in Ctrl + MM, LAMP2 KO + MM, LAMP2 KO + MM + NAC, and LAMP2 KO + MM + Rapa group from at least 3 independent experiments. Red dashed line indicates the value in Ctrl group at base level were normalized to 1. ns: no significance, ** p < 0.01, *** p < 0.001, and **** p < 0.0001 by one-way ANOVA test followed by Tukey’s test.
Figure 7. Restoration of calcium homeostasis of LAMP2 KO iCMs by ROS scavenger. (A) Diagram of experimental design. (B) Treatment of NACA but not rapamycin significantly reduced the cellular ROS overload in LAMP2 KO iCMs in MM. N = 181, 135, 145, and 143 cells in Ctrl + MM, LAMP2 KO + MM, LAMP2 KO + MM + NAC, and LAMP2 KO + MM + Rapa group from at least 3 independent experiments. (C) Western blot showed NACA reduced the p-CaMKIIδ/CaMKIIδ ratio in LAMP2 KO iCMs, but no change was detected in rapamycin treated cells. Results from at least 3 independent experiments. (D–F) Fura-2 calcium imaging analysis suggested that NACA treatment restored the diastolic calcium level (D), calcium transient amplitude (E), and regular beating (F) in LAMP2 KO iCMs, while no beneficial effect was observed in the rapamycin treated group. N = 88, 114, 105, and 98 cells in Ctrl + MM, LAMP2 KO + MM, LAMP2 KO + MM + NAC, and LAMP2 KO + MM + Rapa group from at least 3 independent experiments. Red dashed line indicates the value in Ctrl group at base level were normalized to 1. ns: no significance, ** p < 0.01, *** p < 0.001, and **** p < 0.0001 by one-way ANOVA test followed by Tukey’s test.
Figure 8. Diagram of the cellular mechanisms of arrhythmogenesis in DD cardiomyocytes. Left: in healthy cardiomyocytes, active autophagy mechanisms maintain the protein homeostasis and mitochondrial function. Right: in Danon disease, the lack of LAMP2 impaired the maturation of lysosome and its fusion with autophagosome, result in the accumulation of misfolded proteins and damaged mitochondria. Moreover, the increased demand of contractile function in response to increased adrenaline level (in patients) or to MM (in iPSC-CM model) will exaggerate the autophagic stress. Damaged mitochondria lead to ROS overload and overactivation of CaMKIIδ, which is known to be a key regulator during the pathogenesis of cardiac remodeling and arrhythmia.
Figure 8. Diagram of the cellular mechanisms of arrhythmogenesis in DD cardiomyocytes. Left: in healthy cardiomyocytes, active autophagy mechanisms maintain the protein homeostasis and mitochondrial function. Right: in Danon disease, the lack of LAMP2 impaired the maturation of lysosome and its fusion with autophagosome, result in the accumulation of misfolded proteins and damaged mitochondria. Moreover, the increased demand of contractile function in response to increased adrenaline level (in patients) or to MM (in iPSC-CM model) will exaggerate the autophagic stress. Damaged mitochondria lead to ROS overload and overactivation of CaMKIIδ, which is known to be a key regulator during the pathogenesis of cardiac remodeling and arrhythmia.
留言 (0)