


記住我

C.I.L. and A.A.A. designed the study. C.I.L., L.P.L., N.B., A.G.M., M.F.G., J.C.A., A.S.E., R.A. and L.A.S. performed experiments and analyzed data. C.I.L., L.P.L., N.B., A.G.M., M.F.G., J.C.A., N.E., A.S.E., R.A., S.S., L.A.S., N.D.D. and A.A.A. edited and approved the final version of this manuscript. All authors have read and agreed to the published version of the manuscript.
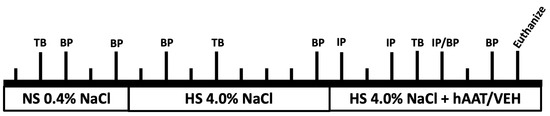
Figure 1. Schematic of study design. Each vertical line represents one day. Tail bleeds (TB), Blood pressure (BP), intraperitoneal (IP) injection of either hAAT or vehicle. There were 3 phases: normal salt (NS), high salt (HS), and high salt plus treatment (hAAT) or vehicle (VEH).
Figure 1. Schematic of study design. Each vertical line represents one day. Tail bleeds (TB), Blood pressure (BP), intraperitoneal (IP) injection of either hAAT or vehicle. There were 3 phases: normal salt (NS), high salt (HS), and high salt plus treatment (hAAT) or vehicle (VEH).
Figure 2. hAAT detection in kidney cortex lysates of db/db mice after hAAT treatment compared to vehicle treatment. The concentration (ng/mL) of hAAT in hypertensive diabetic db/db mice treated with hAAT or vehicle was measured by ELISA. The total volume of kidney lysate used was 15 µL. *** p < 0.001.
Figure 2. hAAT detection in kidney cortex lysates of db/db mice after hAAT treatment compared to vehicle treatment. The concentration (ng/mL) of hAAT in hypertensive diabetic db/db mice treated with hAAT or vehicle was measured by ELISA. The total volume of kidney lysate used was 15 µL. *** p < 0.001.
Figure 3. Changes in systolic blood pressure in hypertensive diabetic db/db mice after treatment with vehicle or hAAT. (A). Tail cuff systolic blood pressure measurements during the inactive (AM) and active (PM) cycles for female and male hypertensive diabetic db/db mice treated with hAAT and hypertensive diabetic db/db mice given vehicle in which both groups were maintained on a high salt (HS) diet. N = 6 hAAT treated (3 females and 3 males) and N = 6 VEH (3 females and 3 males) mice. These results were analyzed using a One-Way ANOVA followed by a Holm–Sidak comparison. *** represents a p < 0.001. (B). Representative immunohistochemistry images of MARCKS and ENaC alpha proteins in non-salt loaded diabetic db/db mice and salt-loaded hypertensive diabetic db/db mice (N = 6 mice in each group).
Figure 3. Changes in systolic blood pressure in hypertensive diabetic db/db mice after treatment with vehicle or hAAT. (A). Tail cuff systolic blood pressure measurements during the inactive (AM) and active (PM) cycles for female and male hypertensive diabetic db/db mice treated with hAAT and hypertensive diabetic db/db mice given vehicle in which both groups were maintained on a high salt (HS) diet. N = 6 hAAT treated (3 females and 3 males) and N = 6 VEH (3 females and 3 males) mice. These results were analyzed using a One-Way ANOVA followed by a Holm–Sidak comparison. *** represents a p < 0.001. (B). Representative immunohistochemistry images of MARCKS and ENaC alpha proteins in non-salt loaded diabetic db/db mice and salt-loaded hypertensive diabetic db/db mice (N = 6 mice in each group).
Figure 4. Western blot and densitometric analysis for ENaC alpha. (A). Western blot for ENaC alpha subunit protein expression. Eighty micrograms of total protein from kidney cortex lysates from hypertensive diabetic db/db mice treated with either hAAT or vehicle were resolved by SDS-PAGE and then transferred to nitrocellulose membranes which were blotted for ENaC alpha subunit protein expression. (B). Image J was used to obtain densitometry values for each band which were normalized to the Ponceau staining. N = 6 mice in each group. ** p < 0.01.
Figure 4. Western blot and densitometric analysis for ENaC alpha. (A). Western blot for ENaC alpha subunit protein expression. Eighty micrograms of total protein from kidney cortex lysates from hypertensive diabetic db/db mice treated with either hAAT or vehicle were resolved by SDS-PAGE and then transferred to nitrocellulose membranes which were blotted for ENaC alpha subunit protein expression. (B). Image J was used to obtain densitometry values for each band which were normalized to the Ponceau staining. N = 6 mice in each group. ** p < 0.01.
Figure 5. Western blot and densitometric analysis of MARCKS protein expression after hAAT or vehicle treatment. (A). Western blot for MARCKS protein expression. Eighty micrograms of total protein from kidney cortex lysates from hypertensive diabetic db/db mice treated with either hAAT or vehicle were resolved by SDS-PAGE and then transferred to nitrocellulose membranes which were blotted for MARCKS protein expression. (B). Image J was used to obtain densitometry values for each band which were normalized to the Ponceau staining. N = 6 mice in each group. * p < 0.05.
Figure 5. Western blot and densitometric analysis of MARCKS protein expression after hAAT or vehicle treatment. (A). Western blot for MARCKS protein expression. Eighty micrograms of total protein from kidney cortex lysates from hypertensive diabetic db/db mice treated with either hAAT or vehicle were resolved by SDS-PAGE and then transferred to nitrocellulose membranes which were blotted for MARCKS protein expression. (B). Image J was used to obtain densitometry values for each band which were normalized to the Ponceau staining. N = 6 mice in each group. * p < 0.05.
Figure 6. Colocalization of MARCKS and ENaC alpha subunit protein expression in the kidney cortex of hypertensive diabetic db/db mice after treatment with vehicle or hAAT. Representative immunohistochemistry images using a mouse monoclonal antibody against the alpha subunit of ENaC and a rabbit polyclonal antibody against recombinant MARCKS protein were used to investigate colocalization of the two proteins in the hypertensive diabetic db/db kidney. N = 6 mice in each group.
Figure 6. Colocalization of MARCKS and ENaC alpha subunit protein expression in the kidney cortex of hypertensive diabetic db/db mice after treatment with vehicle or hAAT. Representative immunohistochemistry images using a mouse monoclonal antibody against the alpha subunit of ENaC and a rabbit polyclonal antibody against recombinant MARCKS protein were used to investigate colocalization of the two proteins in the hypertensive diabetic db/db kidney. N = 6 mice in each group.
Figure 7. Western blot and densitometric analysis of aquaporin-2 protein expression in the hypertensive diabetic kidney. (A). Western blot for aquaporin-2 protein expression. Eighty micrograms of total protein from kidney cortex lysates from hypertensive diabetic db/db mice treated with either hAAT or vehicle were resolved by SDS-PAGE and then transferred to nitrocellulose membranes which were blotted for aquaporin-2 protein expression. (B). Image J was used to obtain densitometry values for each band which were normalized to the Ponceau staining. N = 6 mice in each group.
Figure 7. Western blot and densitometric analysis of aquaporin-2 protein expression in the hypertensive diabetic kidney. (A). Western blot for aquaporin-2 protein expression. Eighty micrograms of total protein from kidney cortex lysates from hypertensive diabetic db/db mice treated with either hAAT or vehicle were resolved by SDS-PAGE and then transferred to nitrocellulose membranes which were blotted for aquaporin-2 protein expression. (B). Image J was used to obtain densitometry values for each band which were normalized to the Ponceau staining. N = 6 mice in each group.
Figure 8. Western blot and densitometric analysis of NPRC protein expression after hAAT or vehicle treatment. (A). Western blot for NPRC protein expression. Eighty micrograms of total protein from kidney cortex lysates from hypertensive diabetic db/db mice treated with either hAAT or vehicle were resolved by SDS-PAGE and then transferred to nitrocellulose membranes which were blotted for NPRC protein expression. (B). Image J was used to obtain densitometry values for each band which were normalized to the Ponceau staining. N = 6 mice in each group.
Figure 8. Western blot and densitometric analysis of NPRC protein expression after hAAT or vehicle treatment. (A). Western blot for NPRC protein expression. Eighty micrograms of total protein from kidney cortex lysates from hypertensive diabetic db/db mice treated with either hAAT or vehicle were resolved by SDS-PAGE and then transferred to nitrocellulose membranes which were blotted for NPRC protein expression. (B). Image J was used to obtain densitometry values for each band which were normalized to the Ponceau staining. N = 6 mice in each group.
Figure 9. Western blot and densitometric analysis of cathepsin B and kidney kallikrein protein expression after hAAT or vehicle treatment. (A). Western blot for cathepsin B protein expression. Eighty micrograms of total protein from kidney cortex lysates from hypertensive diabetic db/db mice treated with either hAAT or vehicle. (B). Densitometry values were obtained using Image J for the cathepsin B band in panel A normalized to the Ponceau staining. N = 6 mice in each group. (C). Western blot for kallikrein protein expression. Eighty micrograms of total protein from kidney cortex lysates from hypertensive diabetic db/db mice treated with either hAAT or vehicle. (D). Densitometry values were obtained using Image J for the kallikrein band in panel C normalized to the Ponceau staining. N = 6 mice in each group.
Figure 9. Western blot and densitometric analysis of cathepsin B and kidney kallikrein protein expression after hAAT or vehicle treatment. (A). Western blot for cathepsin B protein expression. Eighty micrograms of total protein from kidney cortex lysates from hypertensive diabetic db/db mice treated with either hAAT or vehicle. (B). Densitometry values were obtained using Image J for the cathepsin B band in panel A normalized to the Ponceau staining. N = 6 mice in each group. (C). Western blot for kallikrein protein expression. Eighty micrograms of total protein from kidney cortex lysates from hypertensive diabetic db/db mice treated with either hAAT or vehicle. (D). Densitometry values were obtained using Image J for the kallikrein band in panel C normalized to the Ponceau staining. N = 6 mice in each group.
Figure 10. Characterization of urinary EVs from hAAT and vehicle treated db/db mice. (A). Summary graph for EV size from the active (AM) cycle. (B). Summary graph for EV size from the inactive (PM) cycle. (C). Summary graph for EV concentration from the active (AM) cycle. (D). Summary graph for EV concentration from the inactive (PM) cycle. (E). Western blots for multiple EV markers including caveolin-1, annexin A2, GAPDH, and TSG101. (F). Densitometric analysis of the caveolin-1 blot normalized to the Annexin A2 blot. (G). Representative TEM image of uEVs from diabetic db/db mice. AM reflects urine collected overnight during the active cycle of the mice and PM reflects urine collected during the day of the inactive cycle of the mice. White arrows indicate individual uEVs. * p < 0.05 and ** p < 0.01.
Figure 10. Characterization of urinary EVs from hAAT and vehicle treated db/db mice. (A). Summary graph for EV size from the active (AM) cycle. (B). Summary graph for EV size from the inactive (PM) cycle. (C). Summary graph for EV concentration from the active (AM) cycle. (D). Summary graph for EV concentration from the inactive (PM) cycle. (E). Western blots for multiple EV markers including caveolin-1, annexin A2, GAPDH, and TSG101. (F). Densitometric analysis of the caveolin-1 blot normalized to the Annexin A2 blot. (G). Representative TEM image of uEVs from diabetic db/db mice. AM reflects urine collected overnight during the active cycle of the mice and PM reflects urine collected during the day of the inactive cycle of the mice. White arrows indicate individual uEVs. * p < 0.05 and ** p < 0.01.
Figure 11. Lipidomics analysis of lipid classes enriched in urinary EVs from hAAT and vehicle treated db/db mice. Prior to lipid extraction, urinary EVs from each group was normalized to particles/mL. (A). Quantitative assessment of hexosylceramides (HCER). (B). Quantitative assessment of monoacylglycerol (MAG) and phosphatidylcholine (PC). (C). Quantitative assessment of lysophosphatidylethanolamine (LPE), phosphatidylethanolamine (PE), and phosphatidylglycerol (PG) from uEVs isolated from the urine during the active (AM) or inactive (PM) cycles of hypertensive diabetic mice treated with hAAT or vehicle. Samples were normalized to EV concentration. N = 4 hAAT AM, N = 4 vehicle AM, N = 4 hAAT PM, N = 4 VEH PM. AM reflects urine collected overnight during the active cycle of the mice and PM reflects urine collected during the day of the inactive cycle of the mice. * represents p-value < 0.05, ** represents p-value < 0.01.
Figure 11. Lipidomics analysis of lipid classes enriched in urinary EVs from hAAT and vehicle treated db/db mice. Prior to lipid extraction, urinary EVs from each group was normalized to particles/mL. (A). Quantitative assessment of hexosylceramides (HCER). (B). Quantitative assessment of monoacylglycerol (MAG) and phosphatidylcholine (PC). (C). Quantitative assessment of lysophosphatidylethanolamine (LPE), phosphatidylethanolamine (PE), and phosphatidylglycerol (PG) from uEVs isolated from the urine during the active (AM) or inactive (PM) cycles of hypertensive diabetic mice treated with hAAT or vehicle. Samples were normalized to EV concentration. N = 4 hAAT AM, N = 4 vehicle AM, N = 4 hAAT PM, N = 4 VEH PM. AM reflects urine collected overnight during the active cycle of the mice and PM reflects urine collected during the day of the inactive cycle of the mice. * represents p-value < 0.05, ** represents p-value < 0.01.
Table 1. Urine Osmolality and Urine Electrolytes were measured using the urine collected during the treatment phase. N = 6 hAAT treated (3 females and 3 males) mice and N = 6 VEH (3 females and 3 males) mice. These results were analyzed using a One-Way ANOVA followed by a Holm–Sidak comparison.
Table 1. Urine Osmolality and Urine Electrolytes were measured using the urine collected during the treatment phase. N = 6 hAAT treated (3 females and 3 males) mice and N = 6 VEH (3 females and 3 males) mice. These results were analyzed using a One-Way ANOVA followed by a Holm–Sidak comparison.
GROUPMEAN + SEMp-VALUENa+Table 2. Cathepsin S, Cathepsin B, and calpain protease activity in the plasma of db/db mice treated with hAAT or vehicle. Data is presented as mean ± SEM. AAT n = 6, VEH n = 6.
Table 2. Cathepsin S, Cathepsin B, and calpain protease activity in the plasma of db/db mice treated with hAAT or vehicle. Data is presented as mean ± SEM. AAT n = 6, VEH n = 6.
PROTEASEGROUPSMEAN ± SEM RELATIVE FLUORESCENCE UNITS (RFU)STUDENT’S T-TEST COMPARISONp-VALUECATHEPSIN SAAT
留言 (0)