3.1. Theoretical Solubilities: COSMO-RS Calculations
The evaluation of the solubility capacity of extraction solvents toward targeted compounds in the matrix is a crucial step for extraction. In this context, the COSMO-RS software was used in this work as a powerful tool to compare different EtOH/H2O mixtures in order to determine the most efficient ratio to solubilize the main phenolic compounds in olive pomace. To describe the local surface polarity, COSMO-RS calculations present the conductor–polarization charge density (σ) on each molecule’s surface. Afterwards, the description of differences and similarities between the ethanol/water mixture and the investigated polyphenols was analyzed in terms of the σ-profiles, the σ-potentials and σ-surfaces of each compound. In this way, the relative solubilities of the targeted compounds (solutes) in the solvent system were predicted. The calculations were performed in mass:mass with the consideration of investigated polyphenols as solid solutes.
Figure 3a,b (20 °C and 50 °C) show the relative solubility values (log10(x_RS)) of investigated polyphenols in different ethanol/water mixtures. The best extraction solvent for the majority of solutes was found to be 100% of ethanol, which is therefore taken by the software as a reference; it then gives all the other solvents relative to it. The different colors, shown in the table of COSMO-RS results, provide information on the relative solubility of phenolic compounds in the solvent mixture. Green values represent a higher solubility index (0 to −1) compared to the other EtOH/H2O ratios in the solvent system, yellow values stipulate a medium solubility index (−1 to −4) relative to that of the reference solvent, while red values indicate a very low solubility index (
Figure 3a,b, it can be noticed that the solubility index of all investigated phenolic compounds is improved by increasing the temperature. Indeed, the range of green values was extended to (30:70) of EtOH/H2O at 50 °C (
Figure 3b) compared to that at 20 °C (40:60 of EtOH/H2O) (
Figure 3a).
It can be clearly observed that all six acids, as well as 3-hydroxytyrosol and tyrosol, have a high solubility index to the ratio 50:50 ethanol/water for both temperatures. Gallic acid also shows high solubility for EtOH/H2O ratios (40:60, 30:70 and 20:80), and vanillic acid and trans-cinnamic acid for EtOH/H2O ratios (40:60 and 30:70). On the other hand, both glycosidic forms of hydroxytyrosol present a medium solubility index in the reference solvent and it decreases through the solvent system to have mostly a low solubility in 100% water. Nuzhenide followed by Oleuropein shows the lowest solubility values even in 100% EtOH, as indicated by its medium solubility index.
3.2. MacerationTo determine the optimal extraction conditions, the extraction duration was evaluated as a function of TPC obtained by CM with EtOH/H2O ratio (60:40) as solvent for temperatures of 20 °C and 50 °C. Kinetic monitoring shows similar profiles (
Figure 4). However, the comparison of extraction yields shows that the temperature influences the yields according to the prediction of COSMO-RS. The maximum yields obtained are 3.75 ± 0.07 mg TE/g DOP at 20 °C and 4.76 ± 0.13 mg TE/g DOP at 50 °C after 20 min of maceration.UPLC analyses corroborate the TPC results for the four quantified phenols: the highest extraction yields were obtained at 50 °C. The highest concentration was obtained for 3-hydroxytyrosol with (39.0 ± 1.9) 10−2 and (57.6 ± 1.2) 10−2 mg HT/g DOP at 20 °C and 50 °C, respectively, followed by tyrosol with (23.4 ± 1.0) 10−2 and (27.9 ± 0.7) 10−2 mg TY/g DOP at 20 °C and 50 °C, respectively; then, p-coumaric acid with (20.6 ± 0.5) 10−2 and (23.5 ± 0.5) 10−2 mg p-CA/g DOP at 20 °C and 50 °C, respectively, and then caffeic acid with (16.3 ± 0.5) 10−2 mg CA/g DOP at both temperatures (
Figure 5).The comparative analysis using the Student’s test of the phenolic compounds’ extraction mean rates between two temperature conditions (20 °C vs. 50 °C after 20 min of maceration) show a statistical difference for 3-hydroxytyrosol, tyrosol and p-coumaric acid. However, concerning caffeic acid, there is no significant difference of mean rate between 20 °C and 50 °C (p-value = 0.11) (
Table 2).
These statistical results allowed us to prove the increased effect of extraction rate related to 3-hydroxytyrosol, tyrosol and p-coumaric acid at 50 °C.
We can conclude that the extraction yield of most of the phenolic compounds was improved by increasing the temperature, except that of caffeic acid, which was not affected by temperature. The extraction duration evaluated as a function of TPC obtained by CM with EtOH/H2O ratio (60:40) as solvent for the temperatures of 20 °C and 50 °C was then applied to study all the different EtOH/H2O ratios that were studied previously with the COSMO-RS software. Experimental results showed that extracts obtained with (60:40) of EtOH/H2O had the highest TPC values with 3.73 ± 0.02 at 20 °C and 4.59 ± 0.12 mg TE/g DOP at 50 °C, followed by those of (70:40) and (50:50) of EtOH/H2O with 3.60 ± 0.02 and 3.66 ± 0.09 at 20 °C, and 4.29 ± 0.03 and 4.30 ± 0.02 mg TE/g DOP at 50 °C, respectively (
Figure 6). Moreover, the results of ANOVA analysis to compare mean groups (from 40:60 to 80:20 EtOH/H2O) at two different extraction temperature conditions show the presence of statistical differences between each percentage group (p value.ANOVA < 0.05). In addition, using a post-hoc test, the TPC extraction rate related to the solvent ratio of 60:40 EtOH/H2O at 50 °C was found to be statistically different from all other rates at both temperatures (Tukey-p value < 0.05). On the contrary, the extraction rate obtained with the same solvent ratio at 20 °C was not found to be statistically different from those determined using 50:50 and 70:30 EtOH/H2O at 20 °C, as well as using 40:60 EtOH/H2O at 50 °C. In addition, the extraction rates of TPC corresponding to 50:60 and 70:30 EtOH/H2O are not statistically different at 50 °C. This leads to the conclusion that the ratio 60:40 EtOH/H2O at 50 °C could be the most efficient solvent for extracting the majority of phenolic compounds from olive pomace (
Figure 6).
The lowest values were found when olive pomace was extracted with 100% EtOH or 100% water at both temperatures, which is contrary to the COSMO-RS prediction. The contradiction with COSMO-RS solubility prediction for the higher percentage of ethanol can be explained by the fact that the COSMO-RS calculation of the solubility index of solutes in the solvent system follows a linear trend, i.e., the increase in solubility values results from the increase in ethanol concentrations.
Hence, it can be concluded that the threshold for a valid COSMO-RS prediction model was considered in a solvent system with half water and half ethanol or 60% of ethanol. Consequently, this prediction model can only be validated by the experimental results up to a ratio of 60% ethanol. From 70% ethanol, the decrease in the solutes’ solubility can be explained by the change in polarity of the solvent system, which is not favorable for efficient solubilization [
15,
29].After this first screening with the Folin–Ciocalteu spectrophotometric test, a second screening by UPLC/DAD was performed under the same conditions but only at 50 °C. As can be seen in
Figure 7a, 3-hydroxytyrsol and p-coumaric acid follow the same trend as the TPC results while tyrosol and caffeic acid exhibit different behavior depending on the solvent ratios. The sum of these quantified phenols shown in
Figure 7b follows the same trend as that presented by the TPC results. This also corroborates that the 60:40 EtOH/H2O mixture provides the best solubility for the target phenolic compounds followed by the 50:50 ethanol/water mixture.Based on the experimental results that correlated well with the COSMO-RS prediction, the best EtOH/H2O mixture that was selected is (60:40). These results have already been reported in the literature for the extraction of phenolic compounds from olive pomace [
15]. Furthermore, the extraction temperature was selected as 50 °C, which presents more efficient results than at 20 °C. 3.3. Intensification
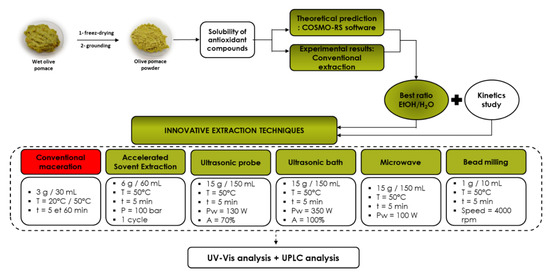
Different innovative green extraction techniques were performed and compared to CM to improve the yield and reduce the extraction time. Therefore, olive pomace powder was dissolved in an EtOH/H2O mixture (60:40) with a sample-to-solvent ratio equal to 1:10 (g/mL) and was subjected to different eco-extraction methods for 5 min at 50 °C: ASE, UAE-P, UAE-B, BM and MAE.
Figure 8a shows that the phenolic extract recovered using ASE presents the highest TPC value (5.31 ± 0.04 mg TE/g DOP), followed by UAE, which reveals higher levels of the probe system (5.04 ± 0.06 mg TE/g DOP) compared to the bath system (4.80 ± 0.11 mg TE/g DOP). The lowest extraction yields correspond to BM (4.32 ± 0.70 mg TE/g DOP) and MAE techniques (4.33 ± 0.02 mg TE/g DOP) with almost identical results (
Figure 8a).The results of TPC in the different extracts were perfectly confirmed by UPLC analysis (
Figure 8b,c). In
Figure 9, a
n UPLC chromatogram of phenolic compounds from olive pomace powder extracted by ASE is presented.
Figure 8b presents the sum of the four phenolic compounds quantified by UPLC, detailed in
Figure 8c. The results show that the sum of phenols detected by UPLC follows exactly the same trend as TPC. As shown in
Figure 8c, 3-hydroxytyrosol has the highest concentration, ranging from (45.2 ± 1.4) 10−2 to (65.7 ± 0.6) 10−2 mg HT/g DOP, followed by tyrosol with (20.3 ± 1.4) 10−2 to (33.2 ± 0.2) 10−2 mg TY/ g DOP and p-coumaric acid with values between (18.0 ± 1.4) 10−2 and (32.5 ± 0.6) 10−2 mg p-CA/g DOP. The lowest concentration was detected for caffeic acid as (12.0 ± 0.8) 10−2 to (22.4 ± 0.5) 10−2 mg CA/g DOP.
ASE increased the extraction yield by 28.5% compared to CM for a duration of 5 min. The ultrasonic techniques also showed significant improvement in extraction efficiency, considering that the ultrasonic probe is a little more efficient than the bath one.
Extraction techniques based on BM and MAE were found to be the least efficient investigated techniques, with extraction yields slightly higher than the results obtained by CM.
To conclude, ASE was found to be effective as an innovative technique to enhance the extraction of phenolic compounds from dried olive pomace powder. The efficiency of the ASE method would be explained by the effect of the pressure applied during extraction. This latter allows the improvement of the diffusivity of the EtOH/H2O mixture through the pores of olive pomace particles. Others studies have also shown significant results with ASE for the extraction of phenolic compounds [
16,
21,
30]. 3.4. Comprehension of MechanismDuring the extraction process (
Figure 10), the matrix effect depends on its physical and chemical composition. Solid, granular or powdered compounds can differ significantly, which generates differences in the extraction process. Additionally, the large number of organic compounds present in the matrix increases the complexity of extraction procedure. The type and properties of the solvent, such as polarity or viscosity, also have an important role in the extraction phenomenon.
ASE turned out to be the best technique for the extraction intensification of phenolic compounds from dried olive pomace powder. Furthermore, the combination of high pressure and temperature improves performance due to the disruption of surface equilibrium and the resulting solubility and mass transfer effects. Using the ASE technique, the powder of the olive pomace sample is enclosed in a cartridge filled with the hydroalcoholic solvent and then extracted statically under a pressure of 100 Bar and a temperature of 50 °C for only 5 min. After that, the sample extract is purged from the cell into the collection vessel using compressed gas.
A temperature of 50 °C disrupts the solute–matrix interaction and lowers the surface tension of the matrix, solvent and solutes, which favorizes the diffusion phenomenon. On the other hand, the high temperature decreases the viscosity of solvent leading to an improvement in its ability to solubilize targeted compounds from the matrix [
31]. From the pressure point of view, the high pressure used facilitates the extraction of phenolic compounds trapped in matrix pores. Indeed, the pressure forces the solvent into the areas of matrices that are not normally accessible by the solvent under atmospheric conditions.We found that, in the case of the UAE technique, the use of probe sonication produces better results than the bath. These results are in full agreement with the findings of Jamalabadi et al. (2019) [
32], who showed that probe sonication was more efficient than the bath one in terms of influencing the physicochemical and microstructural properties of matrixes, which leads to the intensification of extraction yields.On the other hand, it seems that the MAE and BM techniques have almost the same effect on the structure of the studied matrix. The dried olive pomace, in its powder form, probably cannot be influenced by the movement of the beads, which normally leads to the destruction of the grains in a smaller size increasing the contact surface between solute and solvent and thus improving the extraction of phenolic compounds [
33].For MAE, the lack of stirring is not favorable for improving the solubility of phenolic compounds in the solvent. The microwave irradiation does not stimulate the cells, which typically leads to its disintegration, and then promotes the release of targeted molecules [
24].


留言 (0)