


記住我

S.N.: conceptualization, methodology, formal analysis, investigation, writing—original draft preparation, writing—review and editing. D.M.: writing—review and editing, project administration, funding acquisition. R.B.: methodology, investigation. D.F.: conceptualization, methodology, investigation, writing—original draft preparation, writing—review and editing, supervision, project administration, funding acquisition. A.-C.C.: conceptualization, methodology, investigation, writing—original draft preparation, writing—review and editing, supervision, project administration, funding acquisition. All authors have read and agreed to the published version of the manuscript.
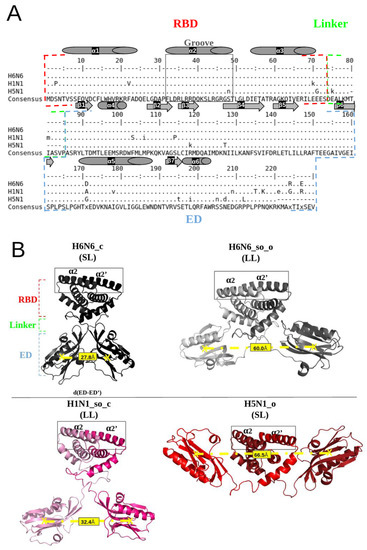
Figure 1. Illustration of the NS1 sequence conservation and the structural polymorphism of the NS1 protein: (A) Alignment of H6N6, H1N1 and H5N1 sequences extracted from the UniProt database (accession number: P03496, A5A5U1, Q20NS3 respectively) [25] using the “showalign” tool of software suite EMBOSS [24], showing conservation of the RBD region and particularly the “RBD-groove”, where the sequence is boxed in full gray lines. The RBD, ED and linker (long (LL) or short (SL)) are bordered by red, blue and green dotted lines, respectively. The α-helices are represented by cylinders and the β-sheets by arrows. Only differences relative to the consensus sequence (above and underneath) are shown, and the consensus line can be displayed in a mixture of upper- and lower-case symbols. Upper case indicates strong consensus and lower case indicates weak consensus; hyphens in H5N1 sequence are deletions (Δ80–84). (B) Representation of the four NS1 initial structures (4OPA, 4OPH, 5NT2 and 3F5T), colored in black, gray, pink and red, respectively, using the PyMol visualization software [26]. The “RBD-groove” is bordered by gray, full lines enclosing the two α2 and α2′ helices. The boundaries of the RBD, ED and the linker are shown in red, blue and green, respectively. The d(ED-ED’) distance between the EDs monomers centers of mass quantifies the structural polymorphism of the different structures, which is on average 27.8 Å for H6N6_c, 60.0 Å for H6N6_so_o, 32.4 Å for H1N1_so_c and 66.5 Å for H5N1_o. Figure 1. Illustration of the NS1 sequence conservation and the structural polymorphism of the NS1 protein: (A) Alignment of H6N6, H1N1 and H5N1 sequences extracted from the UniProt database (accession number: P03496, A5A5U1, Q20NS3 respectively) [25] using the “showalign” tool of software suite EMBOSS [24], showing conservation of the RBD region and particularly the “RBD-groove”, where the sequence is boxed in full gray lines. The RBD, ED and linker (long (LL) or short (SL)) are bordered by red, blue and green dotted lines, respectively. The α-helices are represented by cylinders and the β-sheets by arrows. Only differences relative to the consensus sequence (above and underneath) are shown, and the consensus line can be displayed in a mixture of upper- and lower-case symbols. Upper case indicates strong consensus and lower case indicates weak consensus; hyphens in H5N1 sequence are deletions (Δ80–84). (B) Representation of the four NS1 initial structures (4OPA, 4OPH, 5NT2 and 3F5T), colored in black, gray, pink and red, respectively, using the PyMol visualization software [26]. The “RBD-groove” is bordered by gray, full lines enclosing the two α2 and α2′ helices. The boundaries of the RBD, ED and the linker are shown in red, blue and green, respectively. The d(ED-ED’) distance between the EDs monomers centers of mass quantifies the structural polymorphism of the different structures, which is on average 27.8 Å for H6N6_c, 60.0 Å for H6N6_so_o, 32.4 Å for H1N1_so_c and 66.5 Å for H5N1_o.Figure 2. Classification and representation of the three main identified druggable groove-pocket clusters: (A) Hierarchical classification of druggable groove-pockets extracted from the MD simulations of the four crystallographic NS1 structures (H6N6_c, H6N6_so_o, H1N1_so_c and H5N1_o), indicated by the colors black, gray, pink and red, respectively, on the Forms line. Three clusters (I, II and III) were identified in the Clusters line, colored blue, orange and yellow, and comprising 220, 236 and 816 druggable groove-pockets respectively. (B) Representative pockets of three binding sites are illustrated on one representative groove conformation, in blue, orange and yellow for clusters I, II and III, respectively. (C) Histogram of the distribution of druggable pockets per cluster for each of the H6N6_c, H6N6_so_o, H1N1_so_c and H5N1_o structures.
Figure 2. Classification and representation of the three main identified druggable groove-pocket clusters: (A) Hierarchical classification of druggable groove-pockets extracted from the MD simulations of the four crystallographic NS1 structures (H6N6_c, H6N6_so_o, H1N1_so_c and H5N1_o), indicated by the colors black, gray, pink and red, respectively, on the Forms line. Three clusters (I, II and III) were identified in the Clusters line, colored blue, orange and yellow, and comprising 220, 236 and 816 druggable groove-pockets respectively. (B) Representative pockets of three binding sites are illustrated on one representative groove conformation, in blue, orange and yellow for clusters I, II and III, respectively. (C) Histogram of the distribution of druggable pockets per cluster for each of the H6N6_c, H6N6_so_o, H1N1_so_c and H5N1_o structures.
Figure 3. Residue frequency histograms of the druggable groove-pockets (for residues in more than 15% of the pockets) for the three clusters: (A) Cluster I, (B) Cluster II, (C) Cluster III. The bars in the histograms represent the distribution of the number of pockets, including a specific residue for each of the structures H6N6_c, H6N6_so_o, H1N1_so_c, H5N1_o shown in black, gray, pink and red respectively. Two dotted lines indicate the residues seen in more than 50% and 75% of the pockets in the class studied, and the residues selected as key residues in each class are shown in black on the X axis.
Figure 3. Residue frequency histograms of the druggable groove-pockets (for residues in more than 15% of the pockets) for the three clusters: (A) Cluster I, (B) Cluster II, (C) Cluster III. The bars in the histograms represent the distribution of the number of pockets, including a specific residue for each of the structures H6N6_c, H6N6_so_o, H1N1_so_c, H5N1_o shown in black, gray, pink and red respectively. Two dotted lines indicate the residues seen in more than 50% and 75% of the pockets in the class studied, and the residues selected as key residues in each class are shown in black on the X axis.
Figure 4. Characterization of the physico-chemical properties of the three druggable groove-pockets identified according to the classification into three clusters: the most frequent residues are colored in red and orange for the positively and negatively charged ones, in blue and slate-blue for the aromatic and aliphatic ones, and in white for the polar. (A) is cluster I, which is a small pocket at the end of the groove, (B) is cluster II, which is a small pocket located at the opposite side of cluster I. (C) is a large pocket identified on cluster III, located in the center of the groove, recovering a large groove interface.
Figure 4. Characterization of the physico-chemical properties of the three druggable groove-pockets identified according to the classification into three clusters: the most frequent residues are colored in red and orange for the positively and negatively charged ones, in blue and slate-blue for the aromatic and aliphatic ones, and in white for the polar. (A) is cluster I, which is a small pocket at the end of the groove, (B) is cluster II, which is a small pocket located at the opposite side of cluster I. (C) is a large pocket identified on cluster III, located in the center of the groove, recovering a large groove interface.
Figure 5. Illustration of the common binding site of the different subtypes, including the 14 most frequent residues (α [ASP12, LEU15, ARG19, PHE32, ARG35, ASP39, SER42); α’ [ASP12, LEU15, ARG19, PHE32, ARG35, ASP39, ARG46]). Physico-chemical properties of the corresponding residues colored red and orange for the positively and negatively charged ones, respectively, blue and slate-blue for the aromatic and aliphatic ones, respectively, and white for polar.
Figure 5. Illustration of the common binding site of the different subtypes, including the 14 most frequent residues (α [ASP12, LEU15, ARG19, PHE32, ARG35, ASP39, SER42); α’ [ASP12, LEU15, ARG19, PHE32, ARG35, ASP39, ARG46]). Physico-chemical properties of the corresponding residues colored red and orange for the positively and negatively charged ones, respectively, blue and slate-blue for the aromatic and aliphatic ones, respectively, and white for polar.
Table 1. Number of groove-pockets (total or druggable) and groove conformations, according to the four forms of NS1 (H6N6_c, H6N6_so_o, H1N1_so_c, H5N1_o) obtained in the initial static PDB structures and on a set of 500 conformations sampled during the MD simulations.
Table 1. Number of groove-pockets (total or druggable) and groove conformations, according to the four forms of NS1 (H6N6_c, H6N6_so_o, H1N1_so_c, H5N1_o) obtained in the initial static PDB structures and on a set of 500 conformations sampled during the MD simulations.
Subtype_FormsH6N6_cH6N6_so_oH1N1_so_cH5N1_oTotal of Four StructuresInitial (static) structure/MD sampling conformations1/Table 2. Table of the three groove-druggable binding sites (I, II, III). Total pocket number observed in different clusters or binding sites. Average druggability score of pockets associated with each binding site and its corresponding standard deviation (sd). Key residues observed in more than 75% of the cluster of druggable pockets for each binding site are listed.
Table 2. Table of the three groove-druggable binding sites (I, II, III). Total pocket number observed in different clusters or binding sites. Average druggability score of pockets associated with each binding site and its corresponding standard deviation (sd). Key residues observed in more than 75% of the cluster of druggable pockets for each binding site are listed.
Pocket ClustersPocket NumberDruggability Score
留言 (0)