
記住我
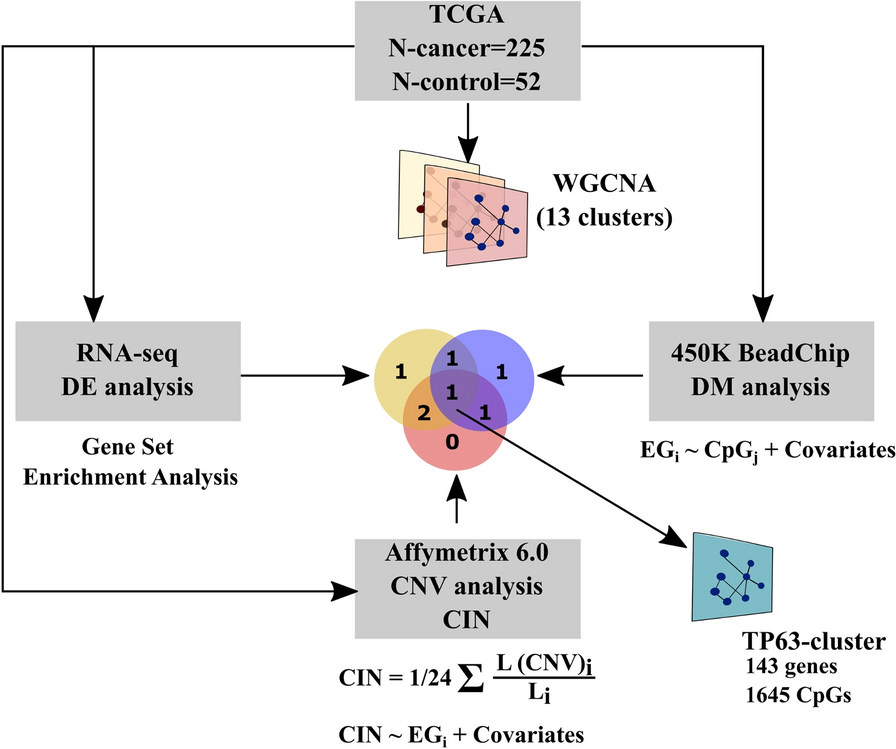
To identify comprehensive chromatin interactions in human prostate cancer cells, we performed Hi-C and Micro-C in C42B prostate cancer cells. While Hi-C uses restriction enzymes that cleave specific sequences, Micro-C uses MNase to digest cross-linked DNA in regions that are not stably bound by proteins across the genome. Therefore, Hi-C can result in multi-nucleosome-sized fragments while Micro-C resulted in mono, di, or tri-nucleosome sized fragments (Fig. 1A). After generating multiple replicates of Hi-C and Micro-C datasets, we sequenced Hi-C and Micro-C data at total 1 billion read pairs per data (Hi-C 1 billion data: total 1,094,888,777 raw read pairs, Micro-C 1 billion data: total 1,050,616,368 raw read pairs) (Additional file 1: Table S1A). Hi-C and Micro-C reads are mapped to the genome using BWA MEM [18]; 79% of Micro-C reads were mapped to the genome, and 61% of Hi-C reads were mapped to genome (Additional file 1: Table S1). Starting from the total 1 billion read pairs, after removing duplicates (PCR duplicates % for Hi-C 1 billion data: 9.78%, Micro-C 1 billion data: 15.36%) and invalid ligated reads using Pairtools (https://pairtools.readthedocs.io/en/latest), Micro-C had 560 million valid read pairs, and Hi-C had 433 million valid read pairs. Micro-C valid read pairs also included similar percentage of trans read pairs (pairs between different chromosomes) and cis read pairs (pairs between the same chromosome) (Additional file 1: Table S1). To compare the coverage, we generated 1 kb, 2 kb, 4 kb, 5 kb, 10 kb, and 20 kb resolution chromatin interaction heatmaps using Hi-C 1 billion data and Micro-C 1 billion data (Fig. 1B, Additional file 2: Figure S1). Hi-C and Micro-C data showed a comparable number of interactions at lower resolutions like 20 kb. However, when we compared Hi-C 1 billion data and Micro-C 1 billion data at higher resolutions, such as 5 kb and 2 kb resolutions, Micro-C showed better coverage than Hi-C (Fig. 1B, Additional file 2: Figure S1). However, at 1 kb resolution, both Hi-C 1 billion data and Micro-C 1 billion data displayed less interactions, indicating that 1 billion read pairs were not enough to detect chromatin interactions at 1 kb resolution.
Fig. 1
Comparison of Hi-C and Micro-C data. A Experimental methods of Hi-C and Micro-C. Unlike Hi-C that uses restriction enzyme, Micro-C uses MNase, allowing to fragment chromatin to mono, di-, and tri-nucleosomes. B Chromatin interaction heatmaps of Hi-C and Micro-C data near chr7p14 region. C Venn diagram of TADs identified from Hi-C and Micro-C. D Triangular heatmaps of Hi-C and Micro-C near chr1p32 region. TADs identified from each data are shown at the bottom. E Average chromatin interaction signals at shared loops (loops found in Hi-C and Micro-C) and unique loops are shown. F Triangular heatmaps of Hi-C and Micro-C near chr7p14 region and loops identified from each data are shown at the bottom
Next, we identified TADs using TopDom program (Shin et al., 2016) from Hi-C 1 billion data and Micro-C 1 billion data at 50 kb resolution. We identified similar numbers of TADs from Hi-C and Micro-C data (Hi-C: 5,566 vs Micro-C: 5,828) (Additional file 3: Table S2). Hi-C and Micro-C displayed similar patterns of TADs that are about 450 kb sized, and identified TADs are mostly shared between datasets (Fig. 1C, D). When we compared the number of identified chromatin loops using Mustache program [19], Hi-C 1 billion data and Micro-C 1 billion data identified a similar number of loops at 10 kb resolution (Hi-C: 25,377 vs Micro-C: 25,502), 25 kb resolution (Hi-C: 13,216 vs Micro-C: 12,890), and 50 kb resolution (Hi-C: 6,141 vs Micro-C: 6,407) (Additional file 4: Table S3). However, at higher resolutions such as 5 kb resolution, Hi-C data identified 22,945 loops while Micro-C data identified 28,390 loops; additional 5,000 loops were identified in Micro-C data (Additional file 4: Table S3). When we compared loops, 12,531 loops are commonly found in both Hi-C and Micro-C (shared loops), 10,414 loops are found exclusively in Hi-C (Hi-C only loops) and 15,386 loops are found exclusively in Micro-C (Micro-C only loops) (Fig. 1E). Micro-C identified more loops than Hi-C at 2 kb resolution (Hi-C: 4,429 vs Micro-C: 7,744) and 1 kb resolution (Hi-C: 199 vs Micro-C: 909) (Additional file 4: Table S3). For example, we were able to detect more robust loops from Micro-C 1 billion data than Hi-C 1 billion data at chr7q14 region (Fig. 1F).
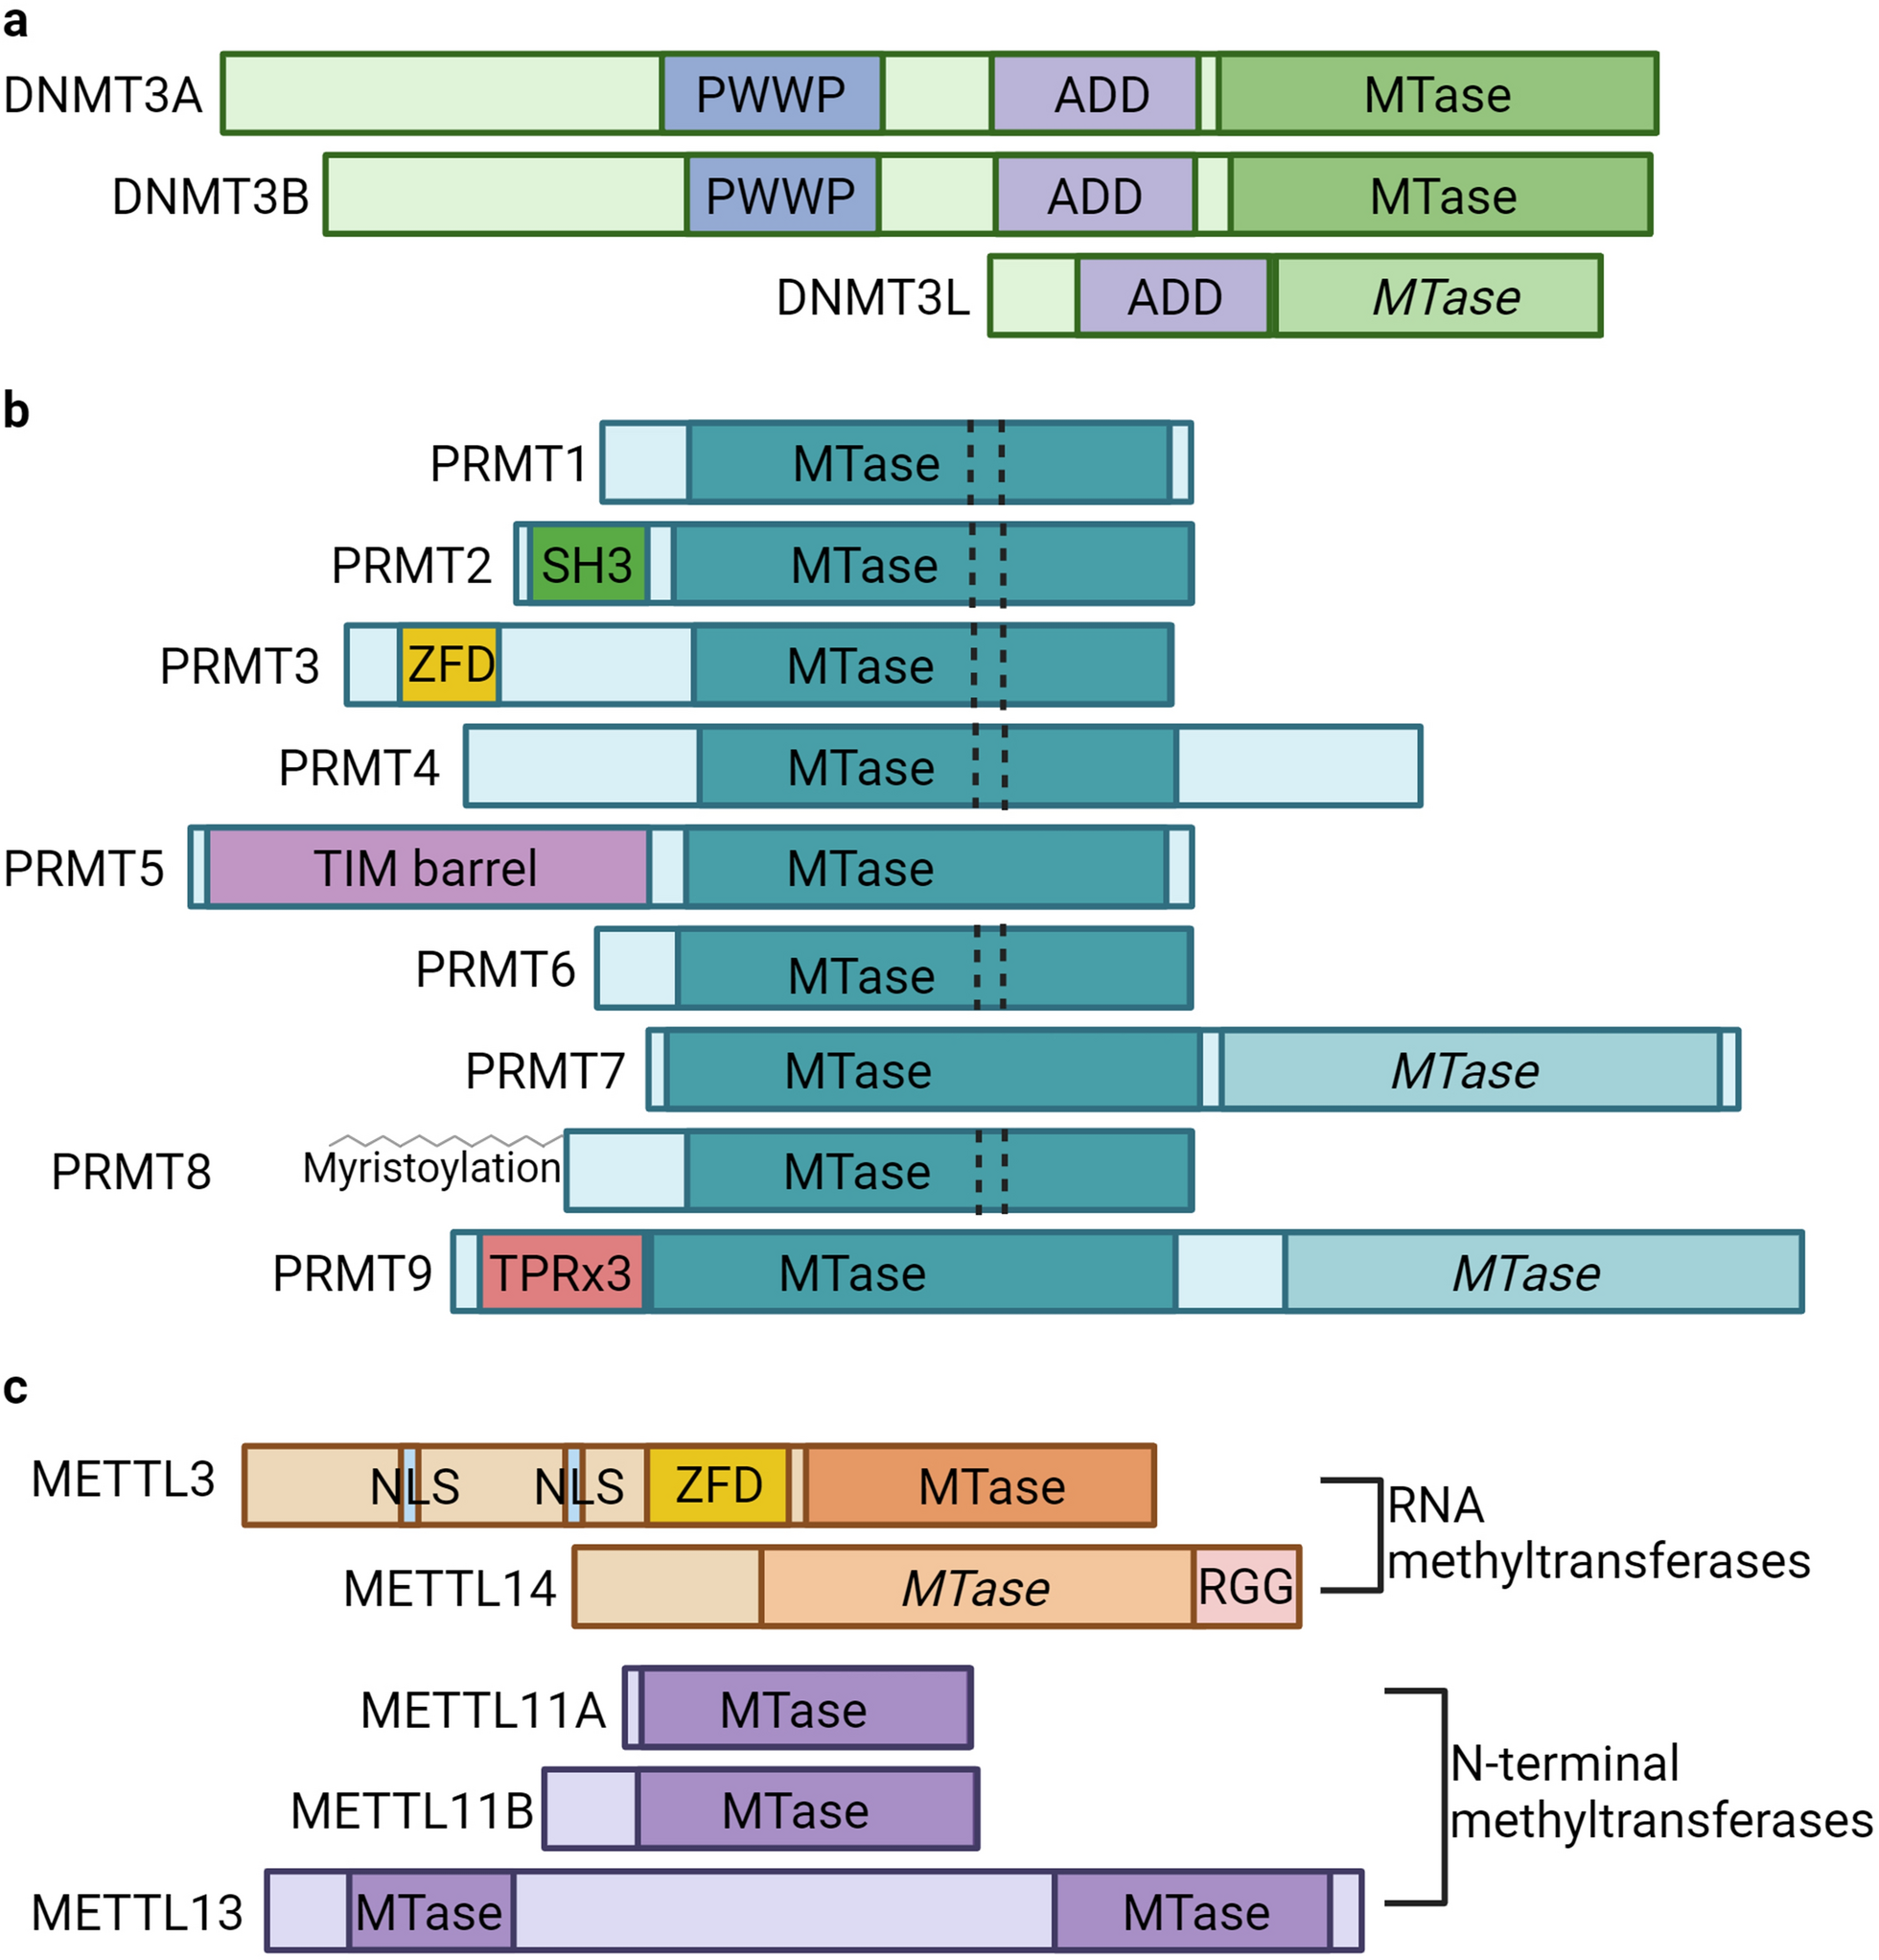
More than 2 billion reads of Micro-C are needed to capture chromatin interactions at 1 kb resolutionWhile Micro-C 1 billion data analysis identified more chromatin interactions at higher resolution compared to Hi-C 1 billion data, it still identified a small amount of chromatin interactions at 2 kb or higher resolution. Therefore, we generated additional libraries (total 16 libraries) and sequenced Micro-C data to have 2 billion and 3 billion raw read pairs and performed comparison analysis (Additional file 1: Table S1). Similar to Micro-C 1 billion data, both 2 billion and 3 billion data had about 80% of its reads aligned to the genome. After removing PCR duplicates (PCR duplicates % for Micro-C 1 billion data: 15.36%, Micro-C 2 billion data: 16.44%, Micro-C 3 billion data: 18.43%) and invalid read pairs, we used valid read pairs of Micro-C 1 billion data (560 million valid read pairs), 2 billion data (1.33 billion valid read pairs) and 3 billion data (1.89 billion valid read pairs) for downstream analyses (Additional file 1: Table S1). Micro-C 1 billion, 2 billion, and 3 billion data identified over 5,800 TADs which are mostly shared (90%) among datasets (Additional file 3: Table S2). Micro-C 1 billion, 2 billion, and 3 billion data showed comparable heatmaps and chromatin interaction patterns at lower resolutions, but Micro-C 2 billion and 3 billion data showed much stronger interaction signals at 1 kb resolution and identified more chromatin interactions that were not seen in Micro-C 1 billion data (Fig. 2A).
Fig. 2
Comparison of Micro-C data in different read depth sequencing. A Chromatin interaction heatmaps of Micro-C 1 billion, 2 billion, and 3 billion data near chr7q21 region. Heatmaps are generated at 1 kb resolution (top), 5 kb resolution (middle), and 10 kb resolution (bottom). B Numbers of loops identified by Mustache at different resolutions from Hi-C 1 billion, Micro-C 1 billion, Micro-C 2 billion, and Micro-C 3 billion data are shown. C Fractions of loops that have different lengths (distances) found from Hi-C 1 billion, Micro-C 1 billion, 2 billion, and 3 billion data are shown. D Numbers of loops shared (between any datasets) or unique among Hi-C 1 billion, Micro-C 1 billion, 2 billion, and 3 billion data are shown
To comprehensively compare chromatin loops identified by Hi-C 1 billion, Micro-C 1 billion, 2 billion, and 3 billion data at different resolutions, we identified chromatin loops at 1 kb, 2 kb, 5 kb, 10 kb, 25 kb, and 50 kb-binned matrices of data using Mustache [19], SIP [20], and HiCCUPS [21] loop calling programs (Fig. 2B, Additional file 2: Figure S2A and S2B and Figure S3). At 50 kb, 25 kb, and 10 kb resolutions, all of the datasets identified a comparable number of chromatin loops from all loop calling programs (Additional file 4: Table S3). However, starting from 5 kb resolution, Micro-C 2 billion data and 3 billion data identified more chromatin loops than Micro-C 1 billion data. For example, Micro-C 2 billion data (2 kb resolution: 27,554, 1 kb resolution: 40,533) and 3 billion data (2 kb resolution: 566,22, 1 kb resolution: 54,506) identified substantially more chromatin loops at 1 kb and 2 kb resolutions, compared to Hi-C 1 billion data (2 kb resolution: 4,429, 1 kb resolution: 199) and Micro-C 1 billion data (2 kb resolution: 7,744, 1 kb resolution: 909) (Fig. 2B, Additional file 4: Table S3). This pattern was also consistent among loop calling programs (Additional file 4: Table S3, Additional file 2: Figure S2A and S2B), indicating that more than 2 billion reads of Micro-C are needed to capture chromatin interactions at 1 kb resolution.
Deeply sequenced Micro-C data identifies additional long-range loops that are not detected from relatively lowly sequenced dataBecause Mustache program identified the greatest number of loops and the identified loops are largely shared with the loops from other loop calling programs, the loops identified from Mustache have been used in further analysis (Additional file 2: Figure S2C). Next, we investigated if there is any difference on the distance of loops identified by datasets by categorizing loops to shorter distanced to longer-range loops (< 200 kb, 200 kb–400 kb, 400 kb–600 kb, 600 kb–800 kb, 800 kb–1 Mb, > 1 Mb). Interestingly, we found that Micro-C 2 billion data and 3 billion data called more long-range loops than Hi-C 1 billion data and Micro-C 1 billion data (Fig. 2C, Additional file 2: Figure S2D and S2E). For example, Micro-C 3 billion data called 2.8 times more loops that are > 1 Mb in distance than Hi-C 1 billion data at 5 kb resolution.
Next, we compared chromatin loops found among Hi-C 1 billion, Micro-C 1 billion, 2 billion, and 3 billion data to see how many of these loops were shared among each other at 5 kb resolution. Most of chromatin loops found in each dataset were also found in Micro-C 2 billion or Micro-C 3 billion data, with Micro-C 3 billion data identifying > 68% more unique loops than the others (Fig. 2D, Additional file 2: Figure S2F and S2G). When we further examined the distance of unique and shared loops, we found that unique loops found in Micro-C 2 billion data and Micro-C 3 billion data had longer distance than the shared loops (Additional file 2: Figure S2H-S2K). Particularly, Micro-C 3 billion data detected a lot of additional > 1 Mb-sized loops that were not detected from other datasets. Similar patterns are found in both 10 kb resolution and 5 kb resolution analyses, indicating that deeply sequenced Micro-C data outperforms less sequenced data on identifying long-range loops.
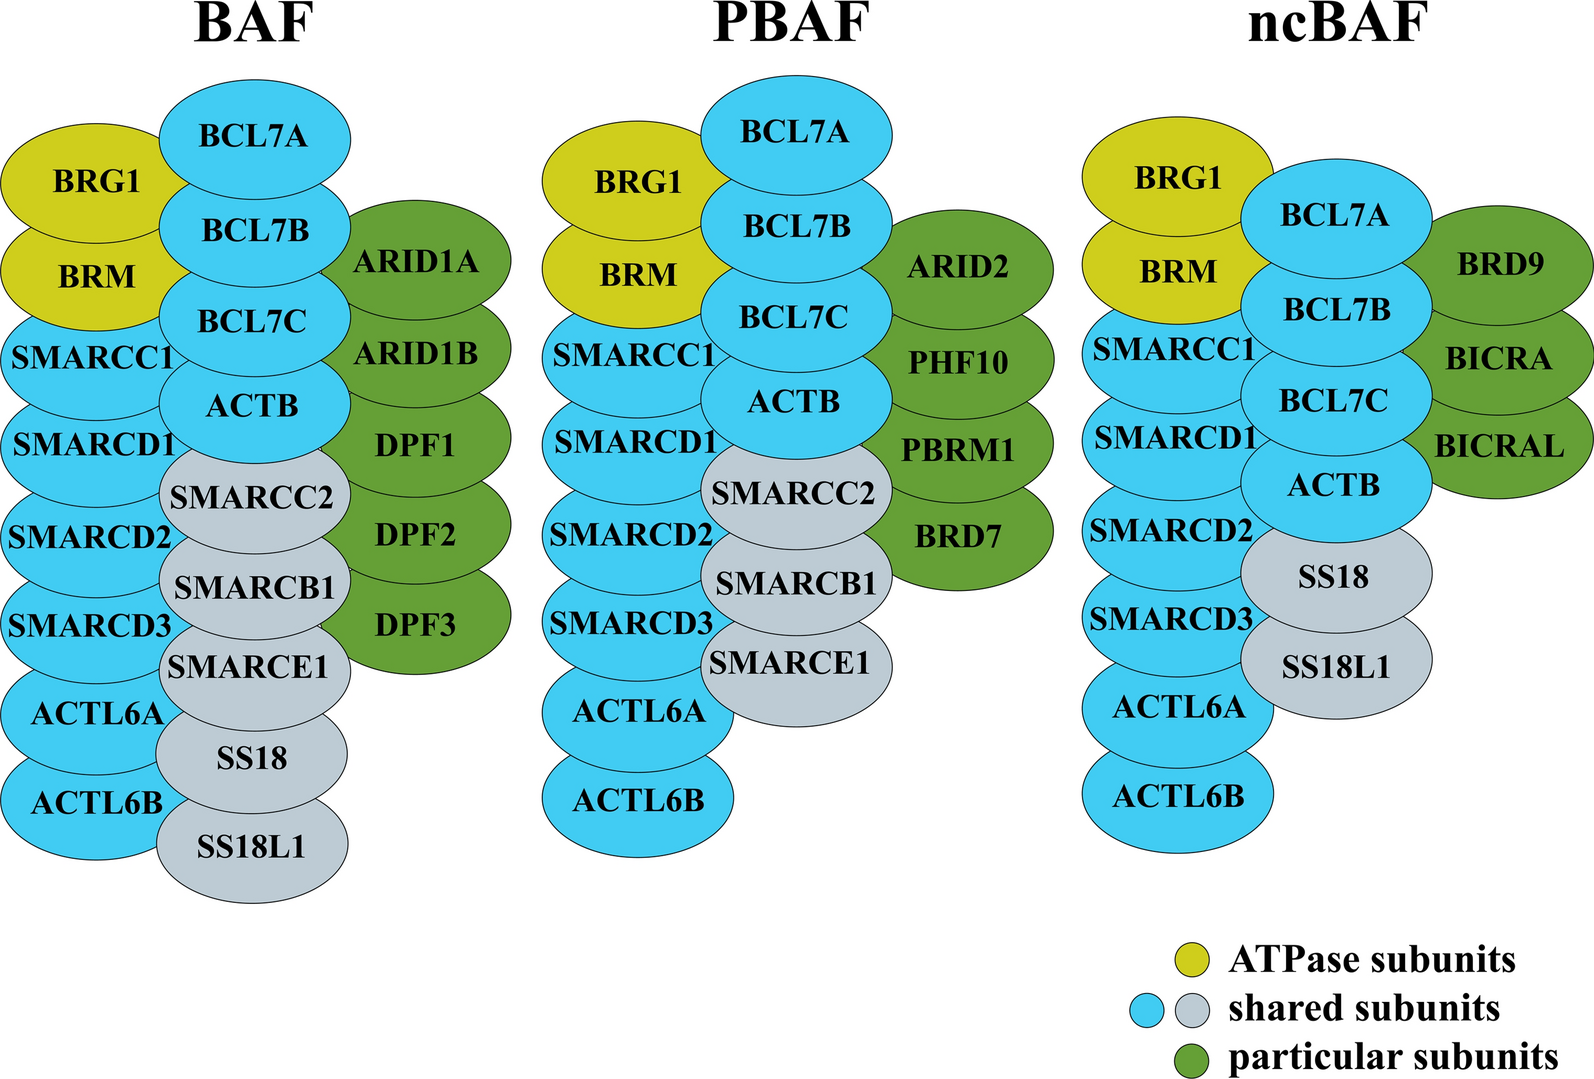
Structural variants and interchromosomal loops in prostate cancer cells are identified using Micro-CGenomic rearrangements such as inversions, deletions, and translocations are observed in prostate cancer cells [22,23,24,25]. Structural variants, which are genomic rearrangements that affect large fragments of DNA, are commonly found in cancer genomes and play a key role in tumorigenesis [26]. Previous studies showed that it is possible to identify interchromosomal (between different chromosomes) and intrachromosomal (within a chromosome) structural variants, using chromatin interaction data such as Hi-C [27, 28]. Therefore, we used our C42B prostate cancer Hi-C and Micro-C data to identify structural variants using NeoLoopFinder [27]. We identified 13–18 interchromosomal structural variants and 26–31 intrachromosomal structural variants from Hi-C and Micro-C data. In total, 41 structural variants were found in Hi-C 1 billion data, 39 in Micro-C 1 billion data, 47 in Micro-C 2 billion data, and 46 in Micro-C 3 billion data (Fig. 3A, Additional file 4: Table S3).
Fig. 3
Chromatin loops near structural variants. A Numbers of inter- and intra-chromosomal structural variants identified from Hi-C and Micro-C data are shown. B Numbers of each category of structural variants identified from Hi-C and Micro-C data are shown. C Numbers of loops identified around the structural variants from Hi-C and Micro-C data are shown at 5 kb and 10 kb resolutions. D Numbers of neoloops (loops newly gained due to the structural variants) that are shared (between any datasets) or unique among Hi-C 1 billion, Micro-C 1 billion, 2 billion and 3 billion data are shown. E An example heatmap of Micro-C data near the ARID1A gene that includes inversion structural variant is shown on the top. Under the heatmap, RNA-seq and RefSeq gene tracks are shown. Example neoloops newly gained due to the structural variants are circled in blue
When we compared the identified structural variants, there were no big differences in the number of deletions, duplications, inversions, or translocations identified among datasets (Fig. 3B). However, the number of chromatin loops newly gained due to structural variants (neoloops) increased as the read number increased (Fig. 3C). At 5 kb resolution, we identified 6 loops in Hi-C 1 billion data, 15 in Micro-C 1 billion data, 81 in Micro-C 2 billion data, and 136 in Micro-C 3 billion data (Fig. 3C). When we compared the newly gained loops around structural variants from datasets, the loops were largely shared among datasets, but the greatest number of loops was identified from Micro-C 3 billion data only (unique loops) (Fig. 3D). For example, we identified new chromatin interactions that were induced by inversion at chromosome 1p36 region. Inversion of chromosome 1p36 region established new loops between 11.5Mbp and 27Mbp region near the ARID1A and DISP3 genes (Fig. 3E). By overlaying Micro-C signals with RNA-seq signals, we noted that the ARID1A gene, which was reported to be dysregulated in prostate tumors [29], was lowly expressed in C42B prostate cancer cells while the DISP3 gene was not expressed.
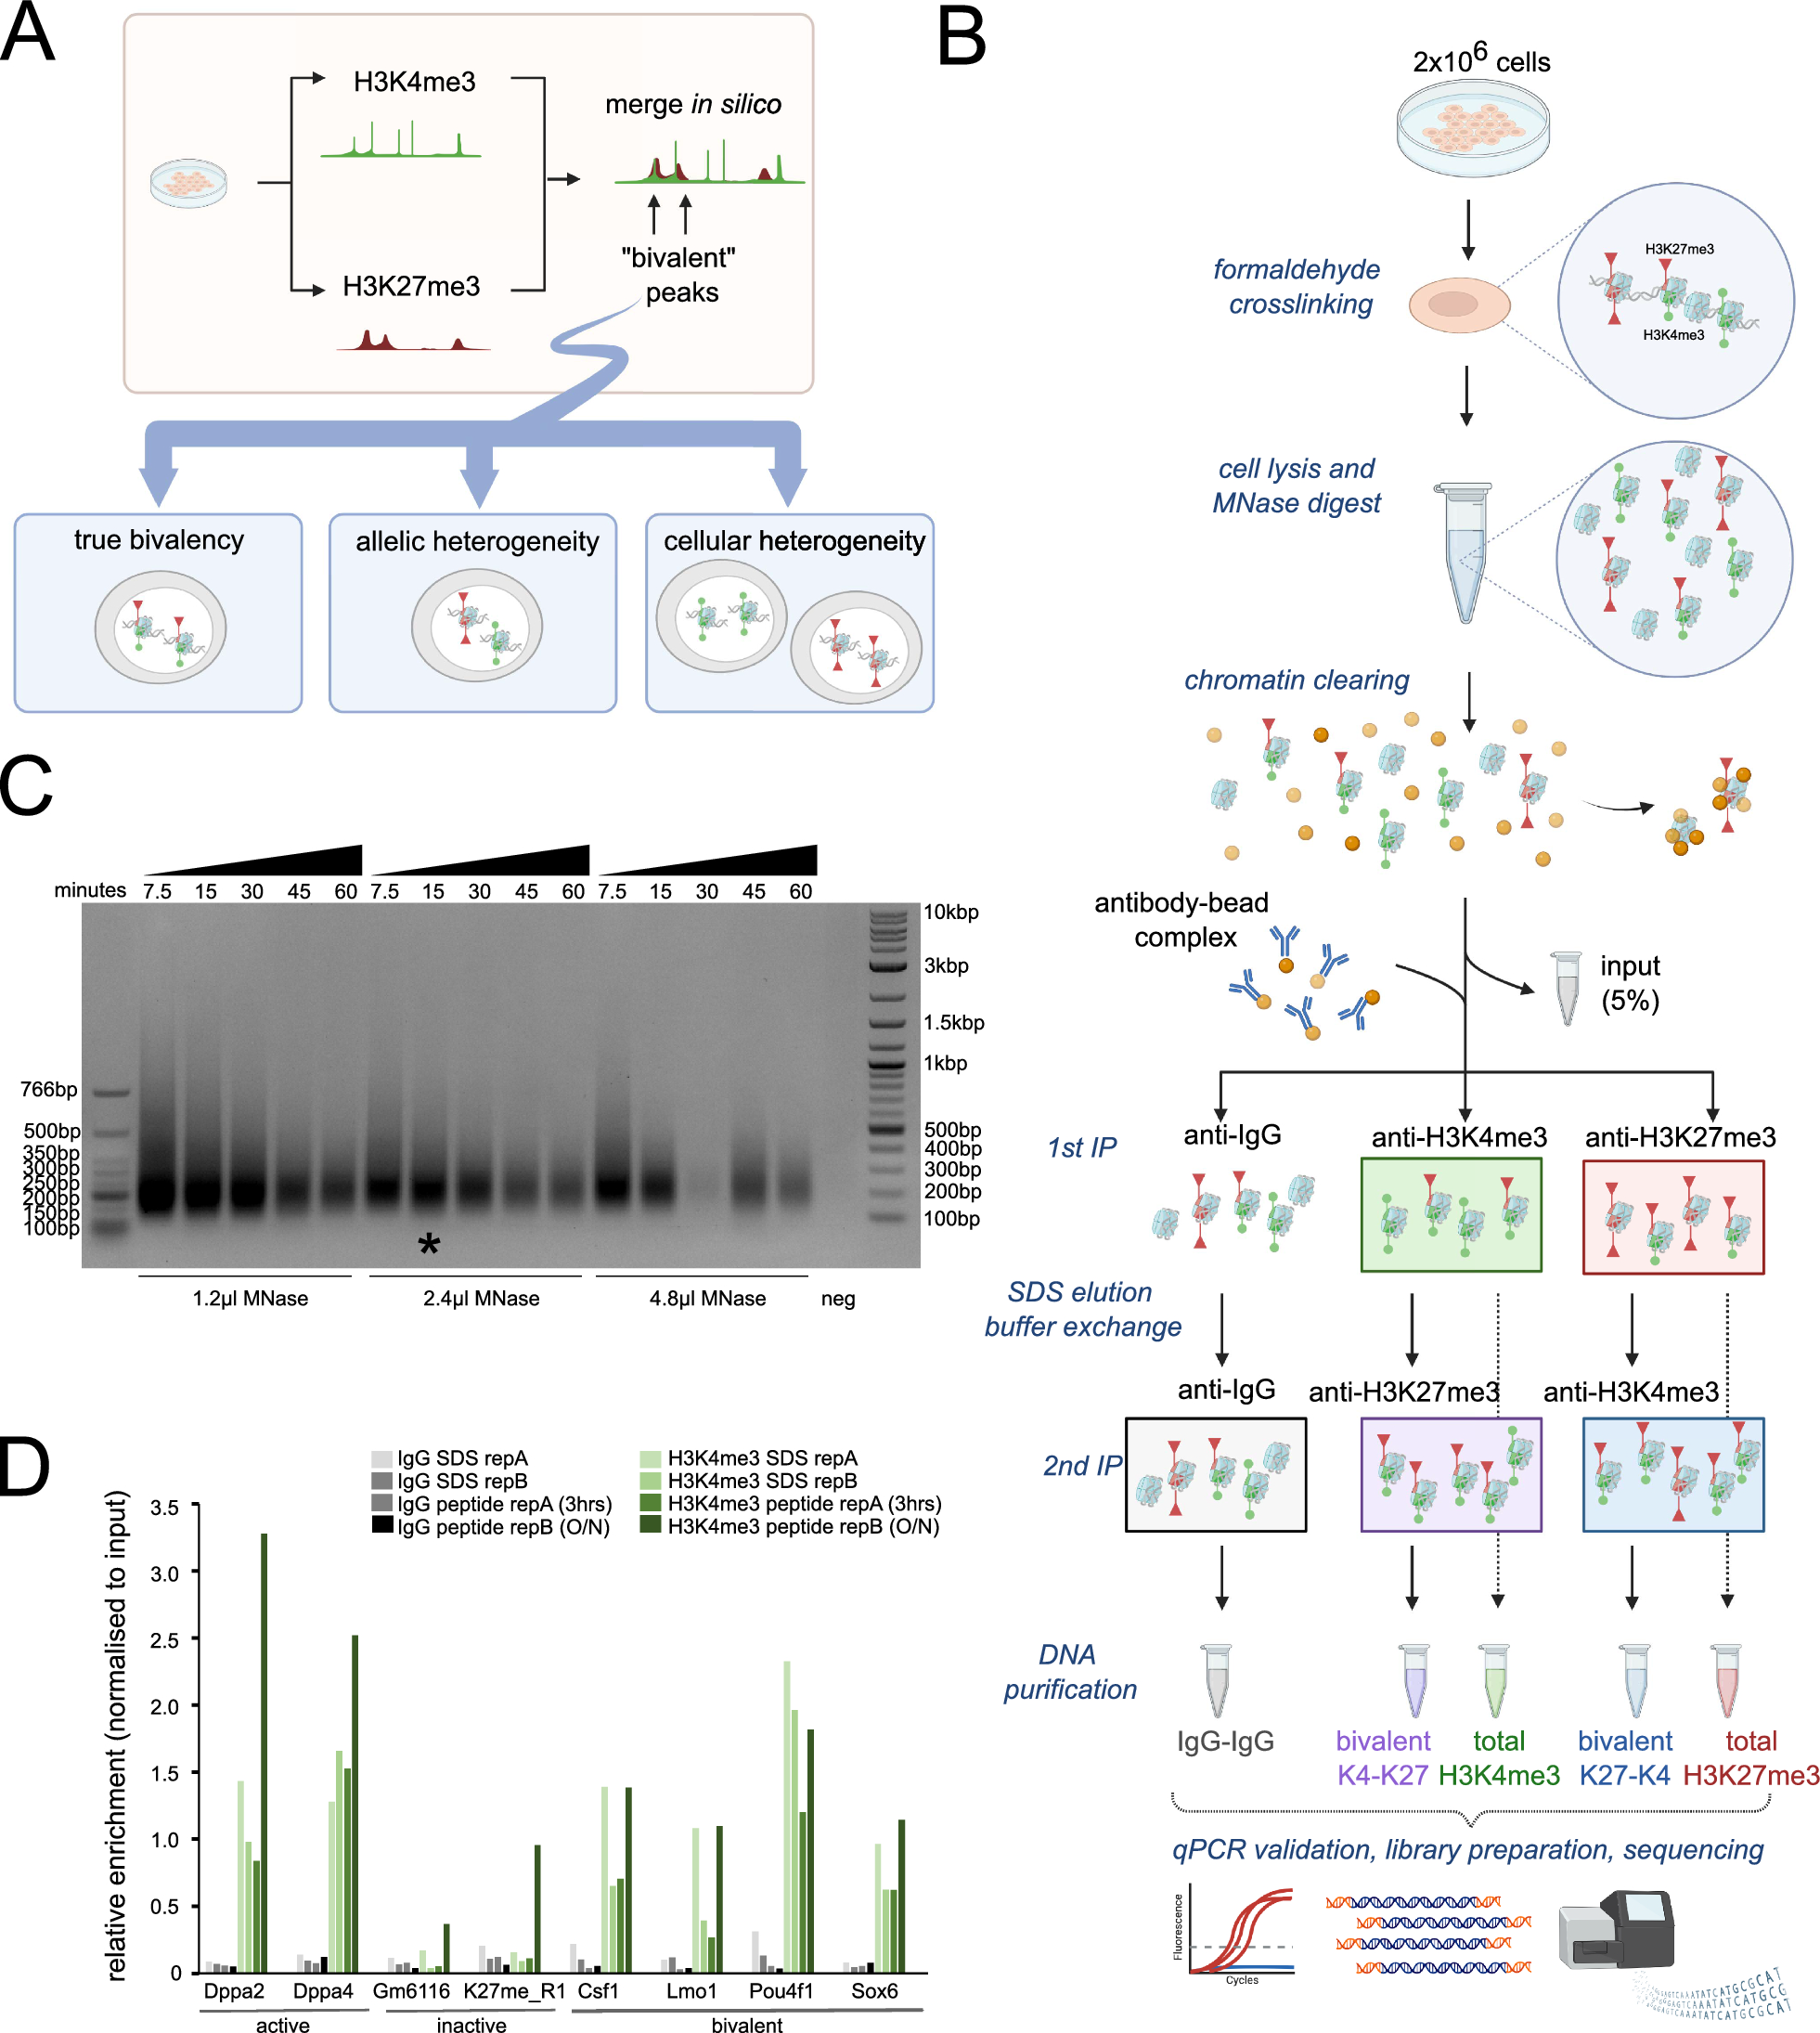
A subset of regulatory elements is involved in chromatin loopsRegulatory elements are reported to be involved in looping [21]. Therefore, we further examined the regulatory elements that were involved in chromatin looping. To identify active regulatory elements, we used ChIP-seq using specific antibodies of H3K4me3 (n = 12,716), H3K27ac (n = 30,329), and CTCF (n = 38,130), identifying reproducible and robust peaks from ChIP-seq replicates following the ENCODE guideline [30]. We also used H3K27me3 and H3K9me3 ChIP-seq to identify reproducible repressed regions (n = 379,103) and heterochromatin regions (n = 140,678), respectively. Furthermore, to identify NDRs (n = 65,838) and nucleosome positions at single molecule resolution, we used NOMe-seq (Fig. 4A, Additional file 1: Table S1).
Fig. 4
Regulatory elements and nucleosome-depleted regions (NDRs) that are involved in loops. A Genome browser screenshots of ChIP-seq (H3K4me3, H3K27ac, CTCF, H3K27me3, H3K9me3), NOMe-seq (DNA methylation, chromatin accessibility, nucleosome-depleted regions (NDRs)), Hi-C, Micro-C, and RefSeq Genes are shown. B Fractions of regulatory elements that intersect with loop anchors identified from Hi-C 1 billion, Micro-C 1 billion, 2 billion, and 3 billion data are plotted (left). A fraction of regulatory elements that intersect with loop anchors from any datasets is shown in grey (in loop) while the one not in loop is shown in orange (not in loop) (right). C Numbers of loops belong to different loop categories defined by intersecting the loop anchors with different types of regulatory elements (red: active promoter, orange: active enhancer, purple: active insulator, green: NDRs without features, grey: repressed region, pink: heterochromatin region, and white: none) are shown. They are in rank order with the most frequent category at the top and the 28th most frequent category at the bottom. Chromatin loops are called at 5 kb resolution using Micro-C 3 billion data. D Comparison of number of promoter–enhancer loops identified from Hi-C 1 billion, Micro-C 1 billion, 2 billion and 3 billion data. E Significance of chromatin interaction (q-value identified by Mustache) for top 5 loop categories. A mean q-value is shown in red. A median q-value is shown in blue
We next calculated the number of active promoters (defined using 2 kb windows of transcription start sites (TSSs) of expressed genes from RNA-seq, n = 27,002), active enhancers (defined as > 2 kb of TSSs with H3K27ac ChIP-seq peaks, n = 22,653), active insulators (defined as > 2 kb of TSSs with CTCF ChIP-seq peaks not found in active enhancers, n = 15,346), and NDRs without features (NDRs identified by NOMe-seq not found in active promoters, enhancers, and insulators, n = 28,870) that are involved in loops from Hi-C and Micro-C data. We and others previously found that the number of regulatory elements involved in looping from Hi-C is relatively small to the total number of regulatory elements [31, 32]. When we performed integrative analysis using Hi-C 1 billion, Micro-C 1 billion, 2 billion, and 3 billion data, we found that less than 40% of promoters were located at chromatin loop anchors of Hi-C 1 billion data and Micro-C 1 billion data, and 57% of promoters were found for Micro-C 3 billion data at 5 kb resolution (Fig. 4B). As different chromatin loops can be called by each data, we determined the total number of promoters involved in looping (promoters that intersected with loop anchors). Interestingly, even when we combined all promoters involved in loops from all datasets, only 69% of promoters were involved in chromatin looping. When we performed analyses for enhancers, similar patterns were detected (Fig. 4B). Insulators had the largest percentage of regions intersected with loop anchors as previous studies have shown that insulators are more enriched at loop anchors compared to promoters and enhancers [21, 31, 32]. However, even from combined data, we found that 85% of insulators were involved in chromatin looping (Fig. 4B). For NDRs that do not overlap with promoters, enhancers, and insulators (NDRs without features), we found that 54% of them were located at chromatin loop anchors (Fig. 4B). Our findings suggest that a subset of active regulatory elements is involved in chromatin looping.
Next, we determined loop categories by overlapping each chromatin loop anchor with promoters, enhancers, insulators, other NDRs, repressed regions, and heterochromatin regions (Fig. 4C). Looking at the loop categories, we found that the most common form of loop category was insulator–insulator, as expected from the high percentage of insulators intersecting with loops and previous studies reported [21, 33, 34], followed by insulator–repressed, and insulator–enhancer loop categories (Fig. 4C). The promoter–enhancer loop category was the fifth most common loop category even when we gave more priority on defining regulatory elements (see Methods) in Micro-C 3 billion data (Fig. 4C). When we performed analysis using different resolutions and Hi-C data and smaller reads Micro-C data, similar loop categories and ranks were observed, including the analysis which was performed at 1 kb resolution (Additional file 2: Figure S4).
The promoter–enhancer loop category is seen as an underlying transcription regulation by bringing an enhancer to interact with a promoter to regulate gene expression [35]. When we compared Hi-C 1 billion, Micro-C 1 billion, 2 billion, and 3 billion data, the number of promoter–enhancer loops identified slightly increased from Hi-C 1 billion data to Micro-C 1 billion data and saw bigger increases at Micro-C 2 billion and 3 billion data (Fig. 4D). However, the total number of promoter–enhancer loops was small compared to the total number of active promoters and enhancers, supporting that only a subset of promoters and enhancers is involved in chromatin loops. Comparison of statistical significance of chromatin interactions of the top 5 loop categories revealed that there were no differences in the distribution of q-values for insulator–insulator, promoter–insulator, enhancer–insulator, and promoter–enhancer loops except for insulator–repressed loops (Fig. 4E). The insulator–repressed loops had slightly higher q-value (indicating less significant and lower chromatin interaction counts) than insulator–insulator, promoter–enhancer, enhancer–insulator, and insulator–insulator loops (Fig. 4E, Additional file 2: Figure S5A).
Moreover, we compared the gene expression level of active promoters involved in different loop categories. We detected no noticeable differences in gene expression among active promoters involved in most loop categories (Additional file 2: Figure S5B). However, we found that gene expression level of promoters involved in promoter–heterochromatin loops had lower expression levels than promoters involved in promoter–enhancer loops and promoter–insulator loops (p-value < 3.14 e−5, p-value < 1.18 e−4, respectively) (Additional file 2: Figure S5B). When we also tested if ChIP-seq signals or NOMe-seq signals differ between regulatory elements that belong to different loop categories, we identified some marginal differences (Additional file 2: Figure S5C-H). For example, H3K27ac ChIP-seq signal values were relatively stronger for ones involved in enhancer–promoter loops than enhancer–repressed loops and enhancer–heterochromatin loops (p-value < 4.18e−15, p-value < 1.76 e−05, respectively) (Additional file 2: Figure S5D).
Promoter capture Micro-C identifies additional chromatin interactions involved in promoters which are not detected by Micro-CWhile Micro-C 3 billion data identified numerous chromatin loops, we found that only the subset of promoters was identified to be involved in loops, and the number of promoter–enhancer loops identified was still relatively low compared to insulators-involved loops (Fig. 4C). This could be due to the fact that insulators-involved loops are dominant for genome-wide Micro-C reads. Therefore, we tested by performing promoter capture Micro-C with probes that are designed to capture promoter-specific chromatin interactions from Micro-C (Fig. 5A, Additional file 2: Figure S6A). Probes (120 bp in size) were designed to − 1 kb, − 0.5 kb, + 0.5 kb, + 1 kb of total 315,286 TSSs and were used to pull down promoter regions from 8 Micro-C replicates by generating 8 promoter capture Micro-C libraries; each library was sequenced about 20 million read pairs (Additional file 1: Table S1). 161,144 probes that span total 19,337,280 base pairs were used. There were total of 68,206,114 valid read pairs after filtering duplicates and invalid read pairs, which indicates that there were 423 valid read pairs per probe (Additional file 1: Table S1).
Fig. 5
Promoter capture Micro-C data analysis. A An overview of promoter capture Micro-C experimental procedure, including the promoter probe design scheme. Probes (green bar) with biotins (orange circle) are designed surrounding TSSs, and Micro-C reads are pulled down using the probes for promoter capture Micro-C. B Chromatin interaction heatmaps of Micro-C and promoter capture Micro-C data near chr1q41 region at 2 kb (top), 5 kb (middle), and 10 kb (bottom) resolutions. C Significance of chromatin interaction (Chicago score (-log p-value), Mustache (q-value)) for loops found in both promoter capture Micro-C and Micro-C (shared) and only one data is plotted. A mean value in shown in red. A median value is shown in blue. D Fractions of active promoters that intersect with the loop anchors from Micro-C 1 billion, 2 billion, 3 billion data or promoter capture Micro-C data are shown (left). A fraction of active promoters that intersect with loop anchors from any datasets is shown in grey (in loop) while the one not in loop is shown in orange (not in loop) (right). E Numbers of promoter-involved loops and loop categories (red: active promoter–active promoter, orange: active promoter–active enhancer, purple: active promoter–active insulator, green: active promoter–NDRs, grey: active promoter–repressed region, pink: active promoter–heterochromatin region, and white: active promoter–none) identified from promoter capture Micro-C data are shown. Loops are called at 5 kb resolution
To compare chromatin interactions between Micro-C data (total 3 billion read pairs) and promoter capture Micro-C data (total 182 million read pairs), we generated heatmaps at 2 kb, 5 kb, and 10 kb resolutions (Fig. 5B). Promoter capture Micro-C heatmaps at higher resolutions such as 2 kb and 5 kb resolutions did not display similar patterns as Micro-C heatmaps because reads are sparse and specific regions are enriched for promoter capture Micro-C data (Fig. 5B). When we called TADs using promoter capture Micro-C data with TopDom program [36], we identified 5,535 TADs (Additional file 3: Table S2). When we compared these identified TADs with the TADs identified from Micro-C 3 billion data, 76% of them were found common, which indicated that a large portion of TADs overlapped to each other, but the percentage of overlap was relatively less compared to the ones we calculated among Micro-C 1 billion, 2 billion, and 3 billion data (Additional file 3: Table S2).
To investigate chromatin loops of promoter capture Micro-C data, we called chromatin loops from promoter capture Micro-C datasets using Chicago loop calling program [37]. When we measured the number of chromatin loops from promoter capture Micro-C by increasing the number of libraries and reads of sequenced, we found that the number of identified loops continued to increase but started to plateau around 160 million read pairs (Additional file 2: Figure S6B). We identified 10,000 to over 70,000 loops from 20 million read pairs to 180 million read pairs datasets (Additional file 2: Figure S6B, Additional file 4: Table S3). We were able to identify 73,833 chromatin loops at 5 kb resolution using the promoter capture Micro-C data that includes 182 million read pairs (Additional file 4: Table S3). When we compared the identified chromatin loops with Micro-C data, the loops that were identified in both promoter capture Micro-C data and Micro-C 3 billion data had significantly more chromatin interaction counts reflected with higher Chicago scores and lower Mustache q-values than loops that were only found in each data although all of loops were still comparably enriched (Fig. 5C, Mustache q-value < 0.20, Chicago score > 5). When we further compared virtual 4C profiles of promoter capture Micro-C and Micro-C data using 3D genome browser [38], we were able to see that interaction patterns are consistent between datasets (Additional file 2: Figure S7), but the quality of overall interaction maps of deeply sequenced Micro-C data was higher than promoter capture Micro-C data.
To determine how many promoters were involved in loops, detected from promoter capture Micro-C, we calculated the percentage of promoters involved in looping. We found that more promoters were intersected with anchors of the promoter capture Micro-C identified loops, compared to Micro-C 3 billion data (Fig. 5D). However, there were still 15% of promoters which were not involved in looping. When we intersected the other side of the identified loop anchor of promoter capture Micro-C loops with other active regulatory elements, most of the promoters were either looped to promoters, insulators, enhancers, or repressed regions (Fig. 5E). Significance of promoter capture Micro-C chromatin loops measured by Chicago scores among loop categories showed similar levels except that promoter–heterochromatin loops had lower Chicago scores (less interaction counts) than other loop categories (Additional file 2: Figure S6C). In summary, promoter capture Micro-C identified additional loops involving promoters and other regulatory elements while utilizing a lower amount of sequencing reads than Micro-C.
More highly phased nucleosomes are observed surrounding the active regulatory elements involved in chromatin loopsNext, we visualized Micro-C MNase signals at regulatory elements using Micro-C 3 billion data. At active promoters, we found a substantial dip near TSSs with nucleosome phasing at downstream regions, indicating that they are largely accessible (Fig. 6A). A dip of Micro-C signals and surrounding nucleosome phasing patterns were also detected in other regulatory elements, such as active enhancers, active insulators, and NDRs without features. When we categorized active regulatory elements into two groups: ones that are enriched at chromatin loop anchors (in loop) and ones that are not enriched at chromatin loop anchors (not in loop), we found that nucleosome phasing signals surrounding the regions were different (Fig. 6A). For example, stronger dips and highly phased nucleosome signals were detected at active promoters and insulators involved in loops compared to ones that were not involved in loops (p-value < 0.023).
Fig. 6
Nucleosome phasing and DNA methylation levels around regulatory elements involved in loops. A Average Micro-C signals around active promoters, enhancers, insulators, and NDRs without features (NDRs that do not overlap with active promoters, enhancers, and insulators) that are in loop (black) vs those that are not in loop (orange) are shown. B Average chromatin accessibility levels (%) of active promoters, enhancers, insulators, and NDRs without features that are in loop (black) vs those that are not in loop (orange) are shown. C Average DNA methylation levels of active promoters, enhancers, insulators, and NDRs without features that are in loop (black) vs those that are not in loop (orange) are shown
We further compared nucleosome positioning of active regulatory elements involved in loops and not in loops using independent NOMe-seq data (Fig.
留言 (0)